Sure, a Saturday morning right after a foot of fluffy snow is the best thing ever. But that same amount of snow on Tuesday in Illinois can make a commute last forever. Imagine it’s the dead of winter and the time of year when the ground is frozen, the air is bone-chilling, and there are piles of dirty, nasty, ice-encrusted snow all over the place.
This is about the time of year when you’re just about ready for spring — especially in Mundelein, the snowiest place in Illinois.
So, put on your parkas, snow boots, and gloves, and let’s go outside to see which Illinois cities get dumped on the most every year. After analyzing all the cities in Illinois with Saturday Night Science, we came up with this list as the 10 snowiest cities in Prairie State.
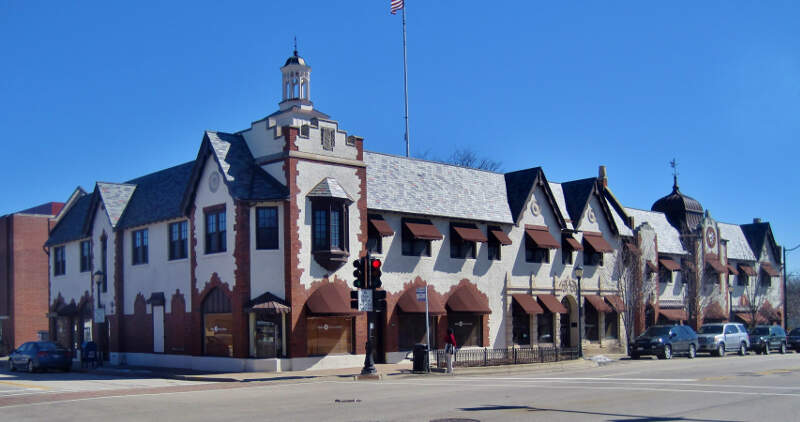
41.8 inches of snow per year
Mundelein is a village in Lake County, Illinois, United States and a northern suburb of Chicago. As of the 2010 census, the village population was 31,064. It is approximately thirty-five miles northwest of Chicago.
Data | Crime | Cost of living | Movers
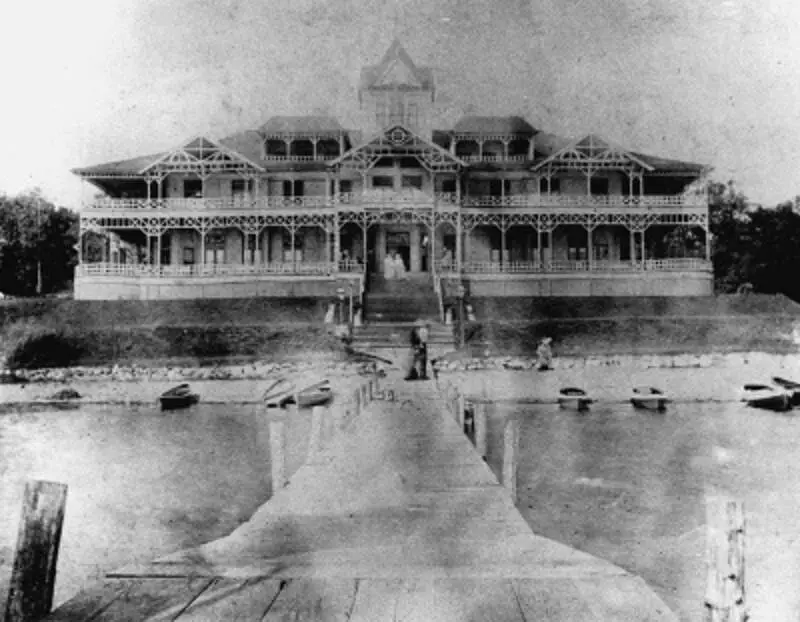
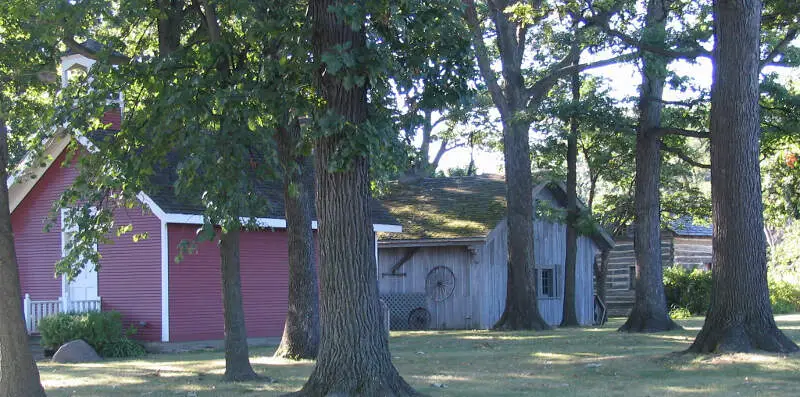
40.2 inches of snow per year
Fox Lake is a village in Grant and Antioch townships in Lake County, Illinois and Burton Township, McHenry County, Illinois, United States. The population was 10,579 at the 2010 census.
Data | Crime | Cost of living | Movers
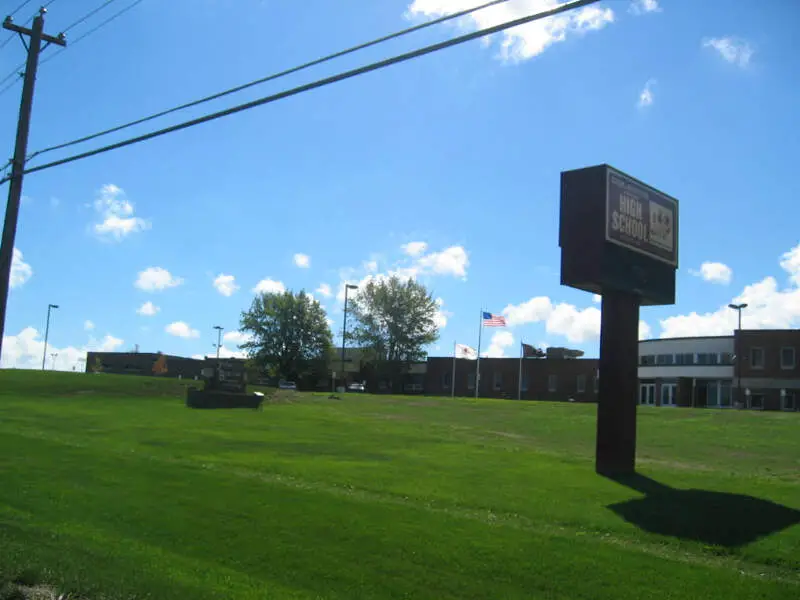
40.1 inches of snow per year
Data | Crime | Cost of living | Movers
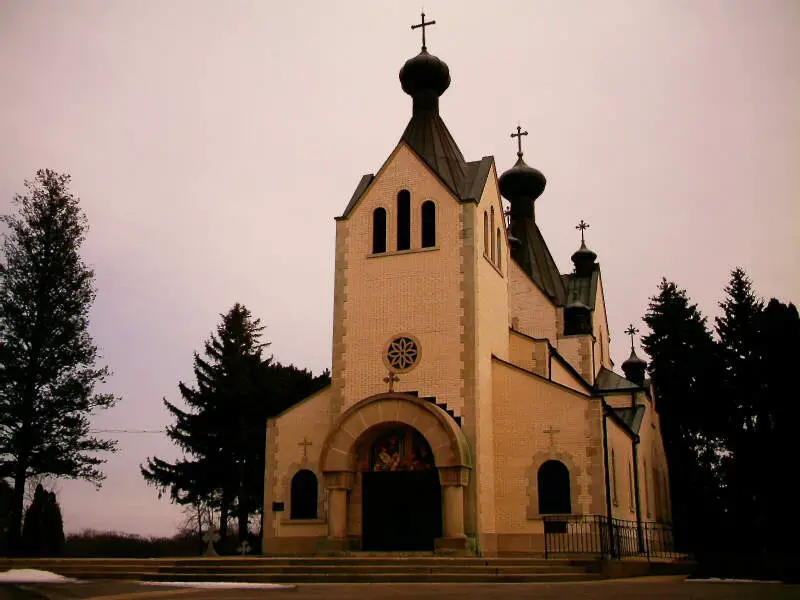
39.7 inches of snow per year
Data | Crime | Cost of living | Movers
39.5 inches of snow per year
Gurnee is a village in Lake County, Illinois, United States. Its population was 31,295 as of the 2010 census. It borders the city of Waukegan and is considered a part of the Chicago metropolitan area. It is best known for being the location of Six Flags Great America and Gurnee Mills, together drawing over 26 million visitors annually.
Data | Crime | Cost of living | Movers
39.5 inches of snow per year
Data | Crime | Cost of living | Movers
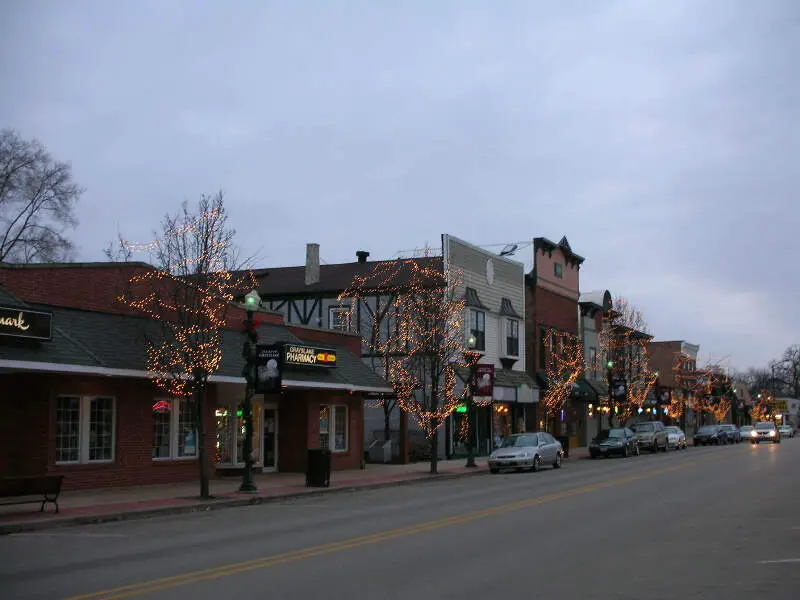
39.5 inches of snow per year
Grayslake is a village in Lake County in the U.S. state of Illinois. It is located in the Chicago metropolitan area, about 40 miles north of Chicago’s downtown, 14 miles west of Lake Michigan, and 15 miles south of the Wisconsin border. The village’s population at the 2010 census was 20,957.
Data | Crime | Cost of living | Movers
39.5 inches of snow per year
Libertyville is a village in Lake County, Illinois, United States and a suburb of Chicago. It is located 5 miles west of Lake Michigan on the Des Plaines River. The 2014 census population was 20,512. Located in northeastern Illinois, southwest of Waukegan and west of Lake Forest, its immediate neighbors are Mundelein to the west, Green Oaks, Mettawa, and Rondout to the east, Gurnee to the north, Grayslake to the northwest, and Vernon Hills to the south.
Data | Crime | Cost of living | Movers

39.5 inches of snow per year
Lake Zurich is a village in Lake County, Illinois, United States, a northwest suburb of Chicago. The population was 19,631 at the 2010 census.
Data | Crime | Cost of living | Movers
39.5 inches of snow per year
Deerfield is a village in Lake County, Illinois, United States, approximately 25 miles north of Chicago with a small portion extending into Cook County, Illinois. The population was 18,225 at the 2010 census, a decline of 175 from 2000.
Data | Crime | Cost of living | Movers
The receipts
Compare the top ten
Pick a metric. The bars rescale. The red line is Illinois’s statewide median.
On the map
Where Illinois’s snowiest cities are
Saturday Night Science
How We Determined The Cities In Illinois With The Most Snow
In order to rank the snowiest cities in Illinois, we used Saturday Night Science and the National Oceanic and Atmospheric Administration (NOAA) database, to see which cities in the Prairie State get the most annual snowfall.
We updated this article for 2026. This is our second time ranking the snowiest cities in Illinois.
Before we get too far, here are the annual snowfall rates for major cities: Chicago (35.2 inches), Aurora (28.1 inches), and Rockford (35.7 inches).
The snowiest cities in Illinois are Mundelein, Fox Lake, Spring Grove, Zion, Gurnee, Round Lake Beach, Grayslake, Libertyville, Lake Zurich, and Deerfield.
There’s a complete chart at the bottom.
The full plate
Detailed List Of The Snowiest Places In Illinois
Click any column to sort. Search by city name.
| Rank | City | Snow (Inches) | Population |
|---|---|---|---|
| 1 | Mundelein | 41.8 | 31,624 |
| 2 | Fox Lake | 40.2 | 10,539 |
| 3 | Spring Grove | 40.1 | 5,510 |
| 4 | Zion | 39.7 | 24,251 |
| 5 | Gurnee | 39.5 | 31,136 |
| 6 | Round Lake Beach | 39.5 | 27,966 |
| 7 | Grayslake | 39.5 | 21,117 |
| 8 | Libertyville | 39.5 | 20,395 |
| 9 | Lake Zurich | 39.5 | 19,923 |
| 10 | Deerfield | 39.5 | 18,588 |
| 11 | Round Lake | 39.5 | 18,446 |
| 12 | Lindenhurst | 39.5 | 14,414 |
| 13 | Antioch | 39.5 | 14,386 |
| 14 | Beach Park | 39.5 | 13,833 |
| 15 | Wauconda | 39.5 | 13,140 |
| 16 | Gages Lake | 39.5 | 10,025 |
| 17 | Lake Villa | 39.5 | 8,878 |
| 18 | Long Grove | 39.5 | 8,086 |
| 19 | Round Lake Park | 39.5 | 7,957 |
| 20 | Hawthorn Woods | 39.5 | 7,634 |
| 21 | Park City | 39.5 | 7,432 |
| 22 | Lincolnshire | 39.5 | 7,271 |
| 23 | Winthrop Harbor | 39.5 | 6,849 |
| 24 | Lakemoor | 39.5 | 6,535 |
| 25 | Lake Bluff | 39.5 | 5,813 |
| 26 | Grandwood Park | 39.5 | 5,757 |
| 27 | Highwood | 39.5 | 5,391 |
| 28 | Buffalo Grove | 39.4 | 41,591 |
| 29 | Vernon Hills | 39.4 | 25,768 |
| 30 | Waukegan | 39.2 | 88,570 |
| 31 | North Chicago | 38.8 | 29,925 |
| 32 | Arlington Heights | 37.7 | 75,802 |
| 33 | Lake Forest | 37.3 | 18,951 |
| 34 | Elmwood Park | 37.2 | 24,971 |
| 35 | Glenview | 37.1 | 45,969 |
| 36 | Melrose Park | 37.1 | 25,491 |
| 37 | River Forest | 37.1 | 11,233 |
| 38 | Island Lake | 36.7 | 8,041 |
| 39 | Niles | 36.6 | 29,955 |
| 40 | Park Ridge | 36.5 | 37,608 |
| 41 | Des Plaines | 36.4 | 58,930 |
| 42 | Morton Grove | 36.4 | 23,472 |
| 43 | Mount Prospect | 36.3 | 54,710 |
| 44 | Skokie | 36.0 | 65,061 |
| 45 | Lincolnwood | 36.0 | 12,666 |
| 46 | Evanston | 35.8 | 75,603 |
| 47 | Rockford | 35.7 | 150,283 |
| 48 | Oak Park | 35.7 | 52,080 |
| 49 | Wilmette | 35.7 | 27,420 |
| 50 | McHenry | 35.7 | 26,739 |
| 51 | Elk Grove Village | 35.5 | 33,333 |
| 52 | Cicero | 35.3 | 84,361 |
| 53 | Rolling Meadows | 35.3 | 23,401 |
| 54 | Chicago | 35.2 | 2,717,534 |
| 55 | Berwyn | 35.1 | 56,706 |
| 56 | Highland Park | 35.0 | 29,789 |
| 57 | Loves Park | 35.0 | 24,494 |
| 58 | Roselle | 35.0 | 22,979 |
| 59 | Forest Park | 34.8 | 14,194 |
| 60 | Machesney Park | 34.7 | 23,037 |
| 61 | Roscoe | 34.7 | 10,536 |
| 62 | Glencoe | 34.7 | 8,881 |
| 63 | Rockton | 34.7 | 7,567 |
| 64 | Schaumburg | 34.6 | 74,559 |
| 65 | Bellwood | 34.6 | 19,190 |
| 66 | Cary | 34.6 | 18,038 |
| 67 | Johnsburg | 34.6 | 6,321 |
| 68 | Lyons | 34.5 | 10,668 |
| 69 | Palatine | 34.2 | 69,188 |
| 70 | Oak Lawn | 34.2 | 56,980 |
| 71 | Wheeling | 34.2 | 37,982 |
| 72 | Calumet City | 34.2 | 37,184 |
| 73 | Northbrook | 34.2 | 33,572 |
| 74 | Chicago Heights | 34.2 | 30,428 |
| 75 | Burbank | 34.2 | 29,157 |
| 76 | Oak Forest | 34.2 | 28,134 |
| 77 | Harvey | 34.2 | 25,773 |
| 78 | Woodstock | 34.2 | 25,247 |
| 79 | Maywood | 34.2 | 24,138 |
| 80 | South Holland | 34.2 | 22,124 |
| 81 | Alsip | 34.2 | 19,396 |
| 82 | Matteson | 34.2 | 19,159 |
| 83 | Franklin Park | 34.2 | 18,410 |
| 84 | Palos Hills | 34.2 | 17,596 |
| 85 | Westchester | 34.2 | 16,783 |
| 86 | Lemont | 34.2 | 16,513 |
| 87 | Prospect Heights | 34.2 | 16,370 |
| 88 | La Grange | 34.2 | 15,709 |
| 89 | Midlothian | 34.2 | 14,906 |
| 90 | Norridge | 34.2 | 14,856 |
| 91 | Chicago Ridge | 34.2 | 14,407 |
| 92 | Richton Park | 34.2 | 13,744 |
| 93 | La Grange Park | 34.2 | 13,649 |
| 94 | Justice | 34.2 | 13,015 |
| 95 | Winnetka | 34.2 | 12,407 |
| 96 | Northlake | 34.2 | 12,353 |
| 97 | Schiller Park | 34.2 | 11,834 |
| 98 | Summit | 34.2 | 11,447 |
| 99 | Crestwood | 34.2 | 11,027 |
| 100 | Barrington | 34.2 | 10,576 |
Source: NOAA snowfall data via Saturday Night Science. 339 Illinois cities ranked.
Summary
Summary: The Snowiest Cities In Illinois For 2026
If you’re looking for the Illinois cities that get buried in snow each winter, this is an accurate list.
The snowiest cities in Illinois are Mundelein, Fox Lake, Spring Grove, Zion, Gurnee, Round Lake Beach, Grayslake, Libertyville, Lake Zurich, and Deerfield.


