There’s no denying it: there are plenty of places in Kentucky that are downright beautiful and full of excitement.
Unfortunately, not all towns and cities in Bluegrass State are so lucky.
Just like in all U.S. States, there are definitely some boring places within Kentucky’s’ borders. You know the places where everyone has an AARP card and the most exciting thing they do all day is post a picture of their grandchild on Facebook.
Like Monticello, for instance. In our latest analysis, we found that this city was the most boring city in all of Kentucky according to Saturday Night Science. But don’t feel bad if you’re a resident of Monticello. There are plenty of other boring, lackluster places in Kentucky as well.
Here they are. Try not to jump out of your seat with excitement.
40.6 median age · 34.0% married households · #14 oldest in Kentucky
Data | Crime | Cost of living | Movers
40.5 median age · 32.0% married households · #17 oldest in Kentucky
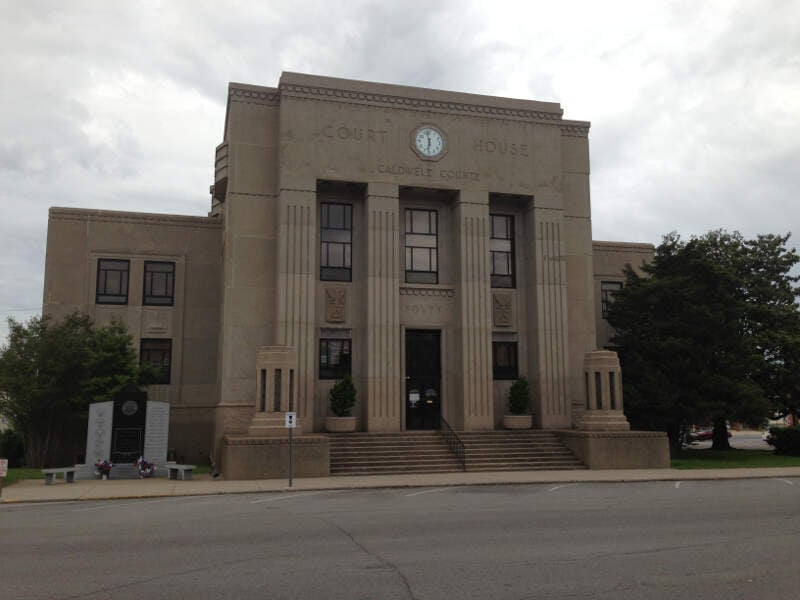
Princeton is a home rule-class city in Caldwell County, Kentucky, in the United States. It is the seat of its county. The population was 6,329 during the 2010 U.S. Census.
Data | Crime | Cost of living | Movers
43.6 median age · 31.0% married households · #6 oldest in Kentucky
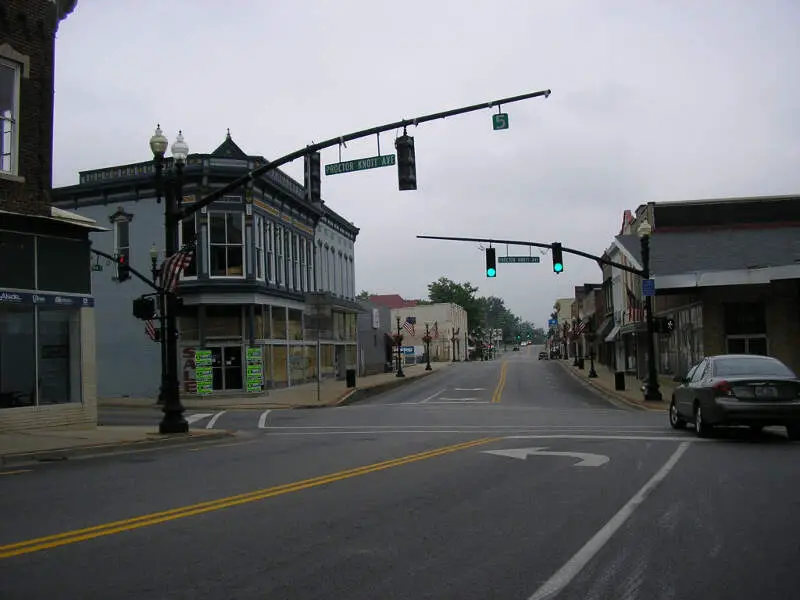
Russellville is a home rule-class city in Logan County, Kentucky, in the United States. It is the seat of its county. The population was 6,947 at the time of the 2010 U.S. Census.
Data | Crime | Cost of living | Movers
40.5 median age · 33.0% married households · #17 oldest in Kentucky
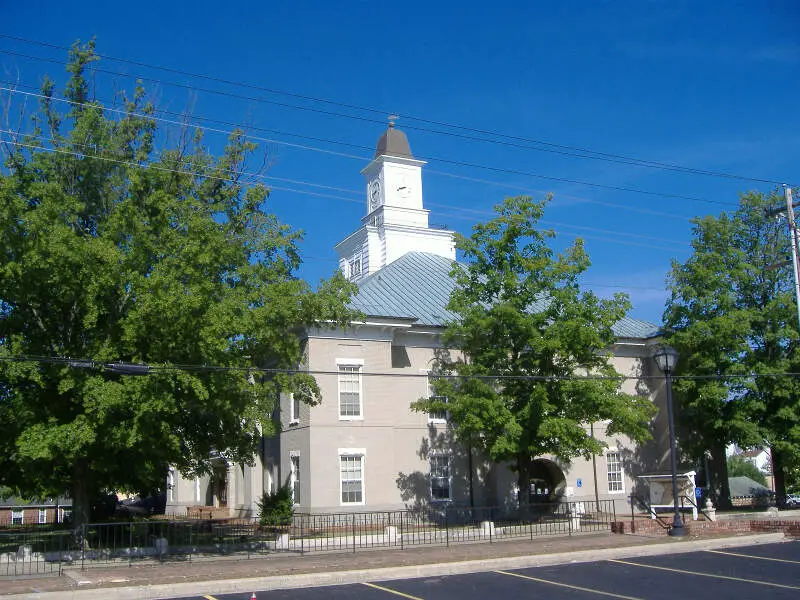
Lebanon is a home rule-class city in Marion County, Kentucky, in the United States. The population was 6,331 at the 2010 census. It is the seat of its county. Lebanon is located in central Kentucky, southeast of Louisville. A national cemetery is located nearby.
Data | Crime | Cost of living | Movers
40.0 median age · 31.0% married households · #22 oldest in Kentucky
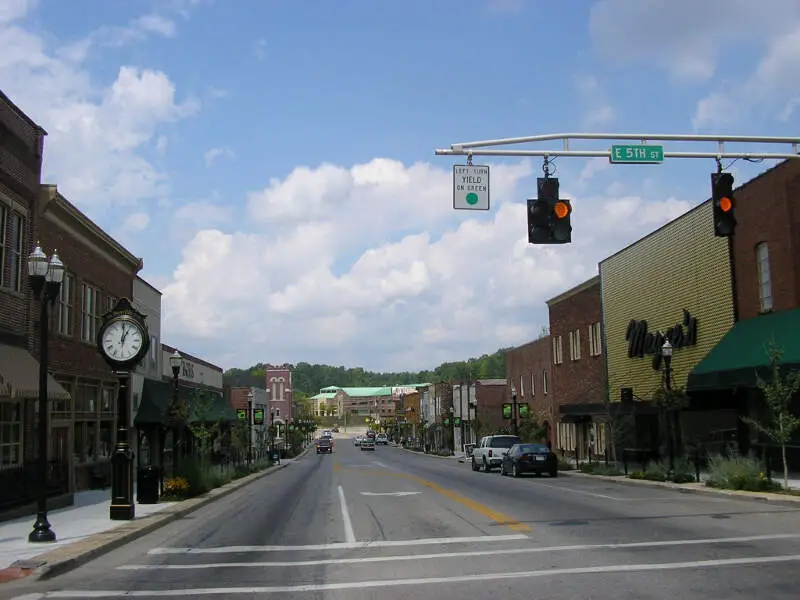
London is a home rule-class city in Laurel County, Kentucky, in the United States. It is the seat of its county. The population was 7,993 at the time of the 2010 U.S. census. London, Kentucky, is the second-largest city named London in the United States and the fourth-largest in the world. It is part of the London, Kentucky micropolitan area. Of the seventeen micropolitan areas in Kentucky, London is the largest; the London micropolitan area’s 2010 Census population was 126,369. London is also home to the annual World Chicken Festival that celebrates the life of Colonel Sanders and features the world’s largest skillet.
Data | Crime | Cost of living | Movers
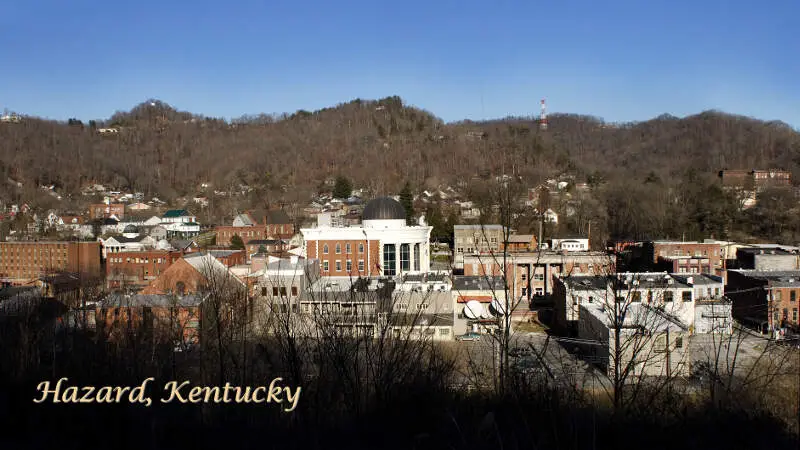
42.2 median age · 27.0% married households · #7 oldest in Kentucky
Hazard is a home rule-class city in and the county seat of Perry County, Kentucky, United States. The population was estimated to be 5,346 in 2014.
Data | Movers
45.5 median age · 31.0% married households · #4 oldest in Kentucky
Data | Crime | Cost of living | Movers
52.0 median age · 32.0% married households · #1 oldest in Kentucky
Cold Spring is a home rule-class city in Campbell County, Kentucky, in the United States. The population was 5,912 at the 2010 census, up from 3,806 at the 2000 census. It is part of the Cincinnati-Northern Kentucky metropolitan area.
Data | Crime | Cost of living | Movers
39.2 median age · 41.0% married households · #28 oldest in Kentucky
Mount Washington is a home rule-class city in northeast Bullitt County, Kentucky, in the United States. The population was 9,117 at the 2010 census. The city is one of several surrounding Louisville that have experienced a sharp rise in population in the past three decades, becoming a commuter town.
Data | Crime | Cost of living | Movers
40.0 median age · 28.0% married households · #22 oldest in Kentucky
Data | Crime | Cost of living | Movers
The receipts
Compare the top ten
Pick a metric. The bars rescale. The red line is Kentucky’s statewide median.
On the map
Where the quiet settles in Kentucky
Saturday Night Science
Methodology: How we determined the boring cities in the Bluegrass State
You would present the following case to your friends if you were argueing with them at a bar about the most boring place to live in Kentucky. And that’s why we call it Saturday Night Science.
Because our data speaks more truth than feelings.
To figure out how boring a place is, we factored in things we generally think make people exciting, and then we figure out which cities have the least number of those exciting people.
We used the U.S. American Community Census data to gather the information presented here. Some of the things people tend to think of as making a city’s population boring include:
- % of Population Over 25 (higher is more boring)
- % of Married Household (higher is more boring)
- Average Age (higher is more boring)
- % of Households With Kids (higher is more boring)
- Population density (lower is more boring)
Then, our algorithm generates a ranking for each place in these categories. After crunching the numbers, all of the cities ranked from most boring to most exciting.
For this ranking, we used every Kentucky city with at least 5,000 residents. This keeps us from prejudicing our rankings by including very small pockets of retired people.
Grab your rocker and hold on.
We updated this article for 2026, and it’s our eleventh time ranking the most boring cities in Kentucky.
The full plate
Detailed List Of The Most Boring Cities In Kentucky For 2026
Click any column to sort. Search by city name.
| Rank | City | Boring Score | Population | Average Age | % Married | % Kids |
|---|---|---|---|---|---|---|
| 1 | Monticello | 19.20 | 5,753 | 40.6 | 34.0% | 27.6% |
| 2 | Princeton | 19.60 | 6,241 | 40.5 | 32.0% | 35.5% |
| 3 | Russellville | 20.60 | 7,316 | 43.6 | 31.0% | 22.9% |
| 4 | Lebanon | 20.80 | 6,430 | 40.5 | 33.0% | 32.0% |
| 5 | London | 21.40 | 7,561 | 40.0 | 31.0% | 30.3% |
| 6 | Hazard | 21.60 | 5,008 | 42.2 | 27.0% | 26.8% |
| 7 | Edgewood | 21.90 | 8,447 | 45.5 | 31.0% | 32.9% |
| 8 | Cold Spring | 22.20 | 6,341 | 52.0 | 32.0% | 22.7% |
| 9 | Mount Washington | 23.90 | 18,480 | 39.2 | 41.0% | 39.0% |
| 10 | Crestwood | 24.60 | 6,356 | 40.0 | 28.0% | 44.4% |
| 11 | Maysville | 24.90 | 8,737 | 41.0 | 25.0% | 27.5% |
| 12 | Glasgow | 26.10 | 15,197 | 37.8 | 27.0% | 37.0% |
| 13 | Madisonville | 26.20 | 19,515 | 38.3 | 32.0% | 32.3% |
| 14 | Alexandria | 26.80 | 10,562 | 37.9 | 32.0% | 36.8% |
| 15 | Leitchfield | 27.30 | 6,819 | 42.0 | 24.0% | 21.0% |
| 16 | Bardstown | 28.10 | 13,804 | 38.1 | 34.0% | 30.2% |
| 17 | Corbin | 29.20 | 8,246 | 37.6 | 31.0% | 33.7% |
| 18 | Villa Hills | 29.50 | 7,480 | 43.6 | 30.0% | 30.5% |
| 19 | Middlesborough | 31.60 | 9,123 | 42.1 | 23.0% | 25.1% |
| 20 | Shepherdsville | 31.60 | 14,533 | 34.7 | 38.0% | 41.4% |
| 21 | Taylor Mill | 31.80 | 6,937 | 39.2 | 26.0% | 23.2% |
| 22 | Somerset | 31.80 | 12,216 | 39.8 | 21.0% | 30.0% |
| 23 | Douglass Hills | 31.90 | 5,474 | 49.9 | 31.0% | 23.0% |
| 24 | Pikeville | 31.90 | 7,490 | 40.4 | 25.0% | 21.7% |
| 25 | Hillview | 32.80 | 8,797 | 36.6 | 32.0% | 33.2% |
| 26 | Henderson | 33.90 | 27,852 | 39.9 | 29.0% | 29.4% |
| 27 | Paris | 34.10 | 10,160 | 37.8 | 35.0% | 26.5% |
| 28 | Winchester | 34.30 | 19,213 | 40.1 | 31.0% | 25.5% |
| 29 | Ashland | 35.20 | 21,295 | 40.7 | 22.0% | 30.7% |
| 30 | Fort Thomas | 35.50 | 17,169 | 38.8 | 27.0% | 34.1% |
| 31 | Cynthiana | 35.90 | 6,458 | 36.9 | 30.0% | 37.2% |
| 32 | Middletown | 35.90 | 9,763 | 42.0 | 22.0% | 22.8% |
| 33 | Shively | 36.00 | 15,638 | 47.5 | 23.0% | 27.1% |
| 34 | Union | 36.20 | 7,642 | 39.5 | 22.0% | 43.1% |
| 35 | Nicholasville | 36.30 | 32,197 | 37.7 | 32.0% | 33.1% |
| 36 | Jeffersontown | 36.50 | 29,199 | 40.5 | 28.0% | 24.9% |
| 37 | Mount Sterling | 37.10 | 7,551 | 37.8 | 30.0% | 25.9% |
| 38 | Walton | 37.40 | 5,730 | 29.9 | 27.0% | 49.8% |
| 39 | Paducah | 37.60 | 26,845 | 41.5 | 21.0% | 22.4% |
| 40 | Independence | 37.70 | 29,392 | 33.7 | 29.0% | 42.8% |
| 41 | Versailles | 38.10 | 10,492 | 39.0 | 23.0% | 34.1% |
| 42 | Dayton | 39.70 | 5,743 | 39.6 | 26.0% | 29.7% |
| 43 | Elizabethtown | 39.80 | 32,576 | 35.7 | 22.0% | 33.2% |
| 44 | La Grange | 40.00 | 10,311 | 34.8 | 25.0% | 40.3% |
| 45 | Lawrenceburg | 40.40 | 11,943 | 34.1 | 32.0% | 35.4% |
| 46 | Flatwoods | 40.80 | 7,269 | 38.2 | 23.0% | 30.8% |
| 47 | Erlanger | 40.80 | 19,875 | 38.0 | 23.0% | 30.3% |
| 48 | Shelbyville | 41.70 | 17,668 | 34.8 | 27.0% | 36.8% |
| 49 | Vine Grove | 41.80 | 6,830 | 37.4 | 13.0% | 33.6% |
| 50 | Fort Wright | 42.20 | 5,887 | 37.5 | 27.0% | 24.1% |
| 51 | Franklin | 43.60 | 10,360 | 35.8 | 21.0% | 29.6% |
| 52 | Danville | 43.70 | 17,327 | 37.8 | 22.0% | 26.1% |
| 53 | Georgetown | 43.70 | 39,117 | 32.7 | 29.0% | 37.3% |
| 54 | Harrodsburg | 44.10 | 9,313 | 37.7 | 22.0% | 24.8% |
| 55 | Mayfield | 44.60 | 9,868 | 37.5 | 21.0% | 28.3% |
| 56 | Berea | 44.90 | 15,786 | 33.2 | 25.0% | 29.4% |
| 57 | Owensboro | 46.20 | 60,302 | 37.5 | 27.0% | 30.3% |
| 58 | Oak Grove | 47.00 | 7,962 | 25.5 | 3.0% | 42.9% |
| 59 | Hopkinsville | 47.20 | 30,906 | 34.6 | 17.0% | 33.0% |
| 60 | Newport | 47.90 | 13,967 | 40.6 | 14.0% | 14.2% |
| 61 | Florence | 48.00 | 32,803 | 38.9 | 17.0% | 26.4% |
| 62 | Frankfort | 48.60 | 28,503 | 35.3 | 22.0% | 28.4% |
| 63 | Radcliff | 50.10 | 22,864 | 36.9 | 13.0% | 30.8% |
| 64 | Williamsburg | 51.00 | 5,270 | 24.8 | 22.0% | 31.2% |
| 65 | St. Matthews | 51.80 | 17,577 | 36.5 | 22.0% | 19.1% |
| 66 | Lyndon | 53.20 | 11,030 | 36.0 | 20.0% | 16.4% |
| 67 | Fort Mitchell | 53.40 | 8,713 | 36.4 | 17.0% | 33.2% |
| 68 | Covington | 54.30 | 41,110 | 37.6 | 14.0% | 21.8% |
| 69 | Bellevue | 54.80 | 5,636 | 35.2 | 21.0% | 19.4% |
| 70 | Elsmere | 54.90 | 9,205 | 30.6 | 29.0% | 28.0% |
| 71 | Wilmore | 58.00 | 6,057 | 29.2 | 21.0% | 33.8% |
| 72 | Campbellsville | 58.00 | 11,622 | 37.2 | 21.0% | 22.1% |
| 73 | Bowling Green | 59.60 | 75,388 | 28.7 | 15.0% | 28.1% |
| 74 | Richmond | 61.60 | 37,111 | 28.4 | 19.0% | 22.8% |
| 75 | Morehead | 62.40 | 6,870 | 22.0 | 12.0% | 17.1% |
| 76 | Murray | 62.40 | 18,080 | 25.8 | 13.0% | 27.9% |
| 77 | Highland Heights | 65.80 | 6,444 | 30.8 | 14.0% | 25.4% |
Source: U.S. Census ACS 2020-2024. 77 cities with more than 5,000 residents.
Summary
There You Have It – Now That You’re Asleep
On a ranking like this, there are usually no winners, but since Kentucky isn’t necessarily the most boring state in the United States, the cities on this ranking can at least take solace that there are, in fact, more boring cities in the country.
The most boring cities in Kentucky are Monticello, Princeton, Russellville, Lebanon, London, Hazard, Edgewood, Cold Spring, Mount Washington, and Crestwood.
If you’re also curious enough, here are the most exciting places in Kentucky, according to science. Not sold on Kentucky? Take the two-minute Find Your Place quiz and see which state actually fits you.
Questions and answers
Most Boring Places In Kentucky FAQs
What is the most boring place in Kentucky?
Monticello is the most boring place in Kentucky for 2026, according to Saturday Night Science. 34.0% of its households are married, which is exactly the kind of statistic that earns boring points.
What are the most boring cities in Kentucky?
The most boring places in Kentucky are Monticello, Princeton, Russellville, Lebanon, London, Hazard, Edgewood, Cold Spring, Mount Washington, and Crestwood. We ranked all 77 places with more than 5,000 residents.
What makes a town boring?
Older residents, lots of married households, lots of families with kids, and low population density. In other words, quiet — measured with Census American Community Survey data.
What is the most exciting place in Kentucky?
Highland Heights sits at the other end of the Boring Score, making it the most exciting place in Kentucky by our measure. Interpret that however you like.
Is being boring bad?
Not really. The traits that score boring points — settled neighbors, families, quiet streets — are the same things plenty of people move for. Take this as Saturday Night Science, not a verdict.