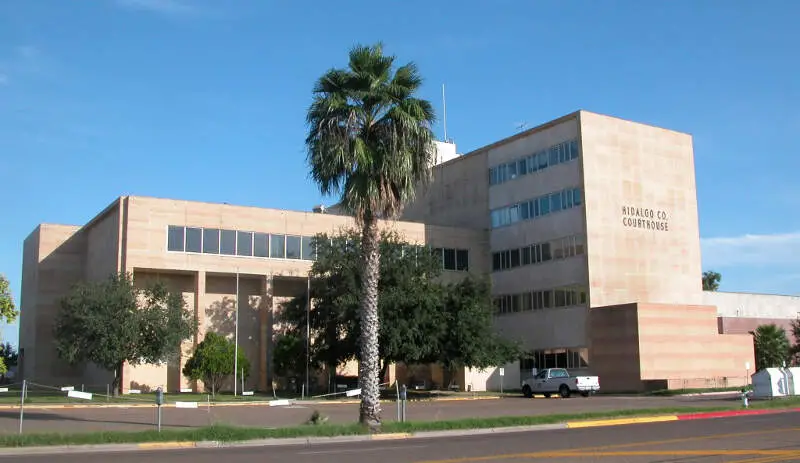

Life in Hidalgo County research summary. HomeSnacks has been researching the quality of life in Hidalgo County over the past eight years using Census data, FBI crime data, cost of living data, and other primary sources. Based on the most recently available data, we found the following about life in Hidalgo County:
The population in Hidalgo County is 873,167.
The median home value in Hidalgo County is $180,070.
The median income in Hidalgo County is $49,371.
The median rent in Hidalgo County is $875.
The unemployment rate in Hidalgo County is 7.6%.
The poverty rate in Hidalgo County is 27.7%.
The average high in Hidalgo County is 90.8° and there are 55.7 inches of rainfall annually.
The average high in Hidalgo County is 90.8°.
There are 55.73 nice days each year.
Expect an average of 55.7 inches of rain each year with 0.1 inches of snow.
There is an average of 6:10 hours of sun each day in Hidalgo County.
| Stat | Hidalgo County |
|---|---|
| Mean High | 90.8 |
| Nice Days | 55.73 |
| Rainfall | 55.7 |
| Snowfall | 0.1 |
| Sunny_hours | 6:10 |

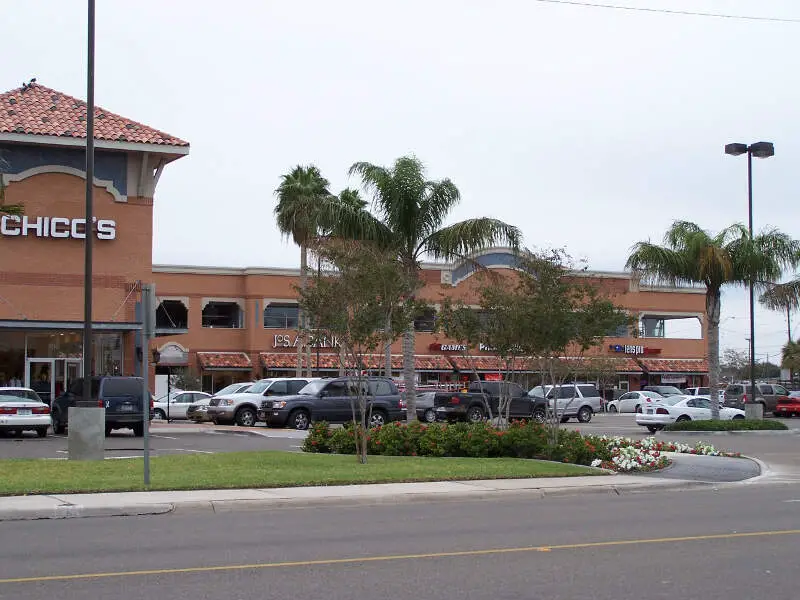
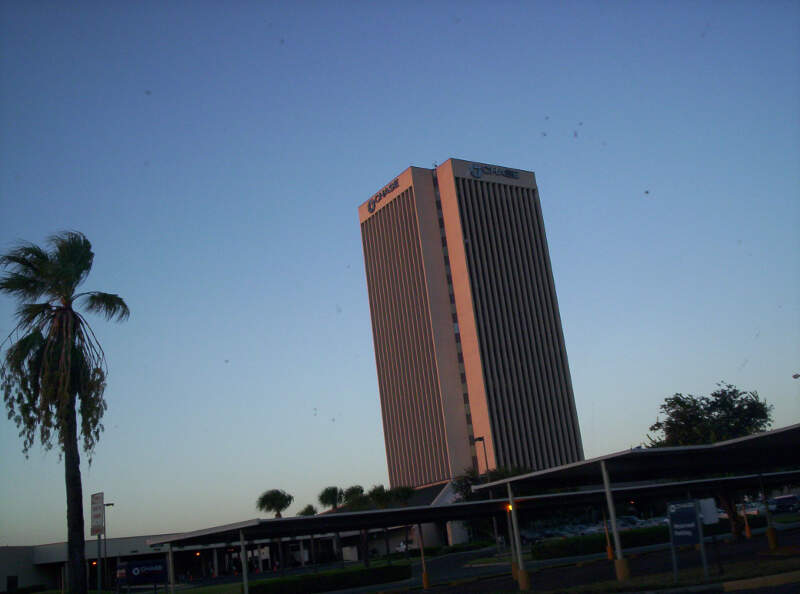

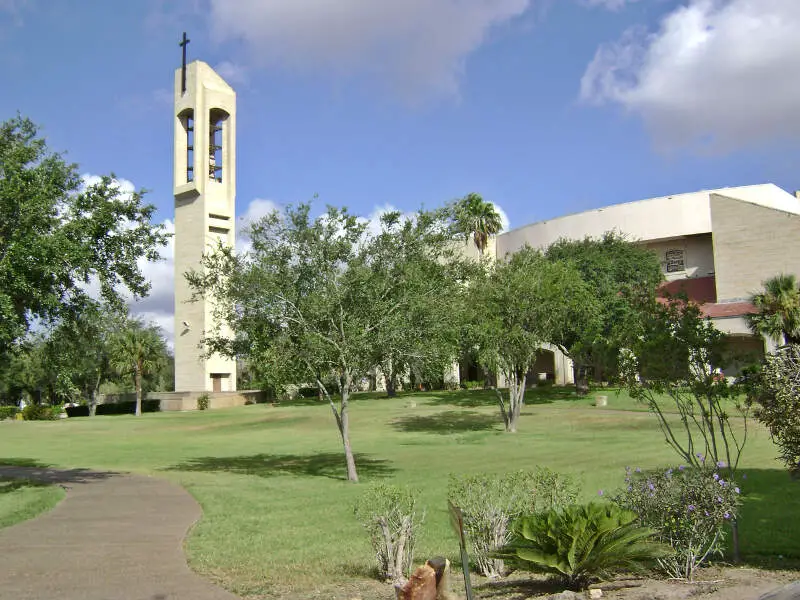

The current population in Hidalgo County is 873,167. The population has increased 1.2% from 2019.
| Year | Population | % Change |
|---|---|---|
| 2022 | 865,677 | 0.5% |
| 2021 | 861,137 | 0.7% |
| 2020 | 855,176 | - |
Hidalgo County is 50.6% female with 441,528 female residents.
Hidalgo County is 49.4% male with 431,639 male residents.
| Gender | Hidalgo County | TX | USA |
|---|---|---|---|
| Female | 50.6% | 50.0% | 50.4% |
| Male | 49.4% | 50.0% | 49.6% |
Hidalgo County is:
5.7% White with 49,568 White residents.
0.5% African American with 4,034 African American residents.
0.1% American Indian with 671 American Indian residents.
0.9% Asian with 8,036 Asian residents.
0.0% Hawaiian with 155 Hawaiian residents.
0.1% Other with 1,154 Other residents.
0.2% Two Or More with 1,834 Two Or More residents.
92.5% Hispanic with 807,715 Hispanic residents.
| Race | Hidalgo County | TX | USA |
|---|---|---|---|
| White | 5.7% | 40.1% | 58.9% |
| African American | 0.5% | 11.8% | 12.1% |
| American Indian | 0.1% | 0.2% | 0.6% |
| Asian | 0.9% | 5.1% | 5.7% |
| Hawaiian | 0.0% | 0.1% | 0.2% |
| Other | 0.1% | 0.3% | 0.4% |
| Two Or More | 0.2% | 2.6% | 3.5% |
| Hispanic | 92.5% | 39.9% | 18.7% |
8.4% of households in Hidalgo County earn Less than $10,000.
6.7% of households in Hidalgo County earn $10,000 to $14,999.
12.5% of households in Hidalgo County earn $15,000 to $24,999.
10.6% of households in Hidalgo County earn $25,000 to $34,999.
12.4% of households in Hidalgo County earn $35,000 to $49,999.
17.2% of households in Hidalgo County earn $50,000 to $74,999.
10.9% of households in Hidalgo County earn $75,000 to $99,999.
12.9% of households in Hidalgo County earn $100,000 to $149,999.
4.6% of households in Hidalgo County earn $150,000 to $199,999.
3.9% of households in Hidalgo County earn $200,000 or more.
| Income | Hidalgo County | TX | USA |
|---|---|---|---|
| Less than $10,000 | 8.4% | 5.1% | 4.9% |
| $10,000 to $14,999 | 6.7% | 3.6% | 3.8% |
| $15,000 to $24,999 | 12.5% | 7.0% | 7.0% |
| $25,000 to $34,999 | 10.6% | 7.7% | 7.4% |
| $35,000 to $49,999 | 12.4% | 11.1% | 10.7% |
| $50,000 to $74,999 | 17.2% | 16.7% | 16.1% |
| $75,000 to $99,999 | 10.9% | 12.7% | 12.8% |
| $100,000 to $149,999 | 12.9% | 16.9% | 17.1% |
| $150,000 to $199,999 | 4.6% | 8.7% | 8.8% |
| $200,000 or more | 3.9% | 10.6% | 11.4% |
18.0% of adults in Hidalgo County completed < 9th grade.
13.0% of adults in Hidalgo County completed 9-12th grade.
25.0% of adults in Hidalgo County completed high school / ged.
18.0% of adults in Hidalgo County completed some college.
5.0% of adults in Hidalgo County completed associate's degree.
14.0% of adults in Hidalgo County completed bachelor's degree.
5.0% of adults in Hidalgo County completed master's degree.
1.0% of adults in Hidalgo County completed professional degree.
1.0% of adults in Hidalgo County completed doctorate degree.
| Education | Hidalgo County | TX | USA |
|---|---|---|---|
| < 9th Grade | 18% | 8% | 3% |
| 9-12th Grade | 13% | 7% | 6% |
| High School / GED | 25% | 24% | 26% |
| Some College | 18% | 21% | 20% |
| Associate's Degree | 5% | 8% | 9% |
| Bachelor's Degree | 14% | 21% | 21% |
| Master's Degree | 5% | 8% | 10% |
| Professional Degree | 1% | 2% | 2% |
| Doctorate Degree | 1% | 1% | 2% |
HomeSnacks is based in Durham, NC.
We aim to deliver bite-sized pieces of infotainment about where you live.
We use data, analytics, and a sense of humor to determine quality of life for places across the nation.