
Racial diversity in Texas is a mixed bag.
There are parts of Texas where there’s a high level of diversity. But where will you find the most diverse places in Texas?
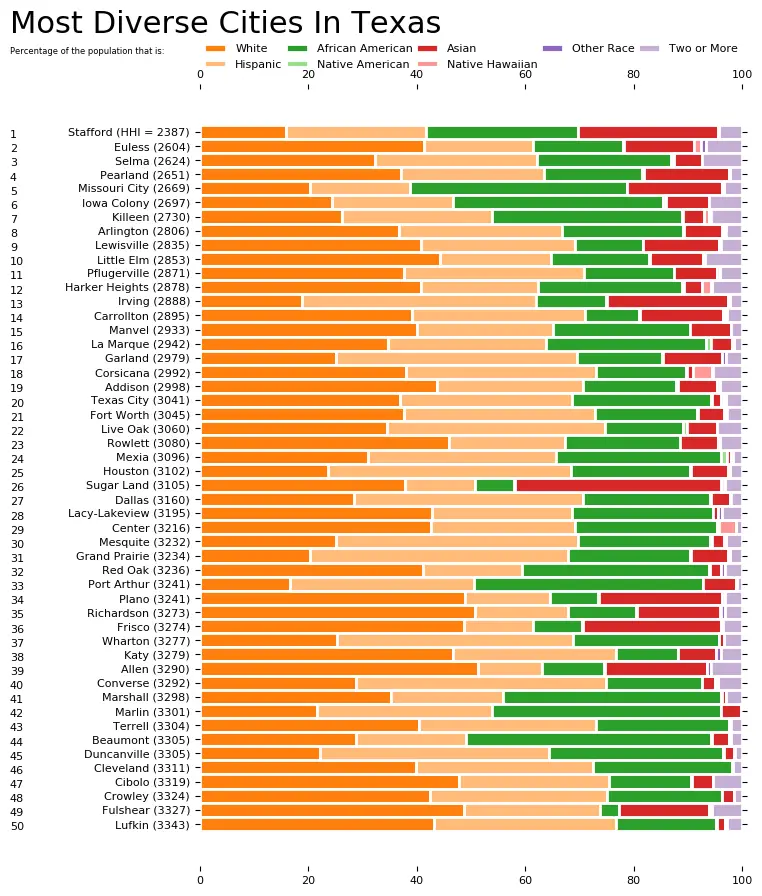
To answer that question, we went to the US Census data. Using Saturday Night Science, we measured the Gini coefficient for all 372 cities in Texas to rank them from most to least diverse.
Table Of Contents: Top Ten | Methodology | Summary | Table
Here are the 10 most diverse places in Texas for 2026:
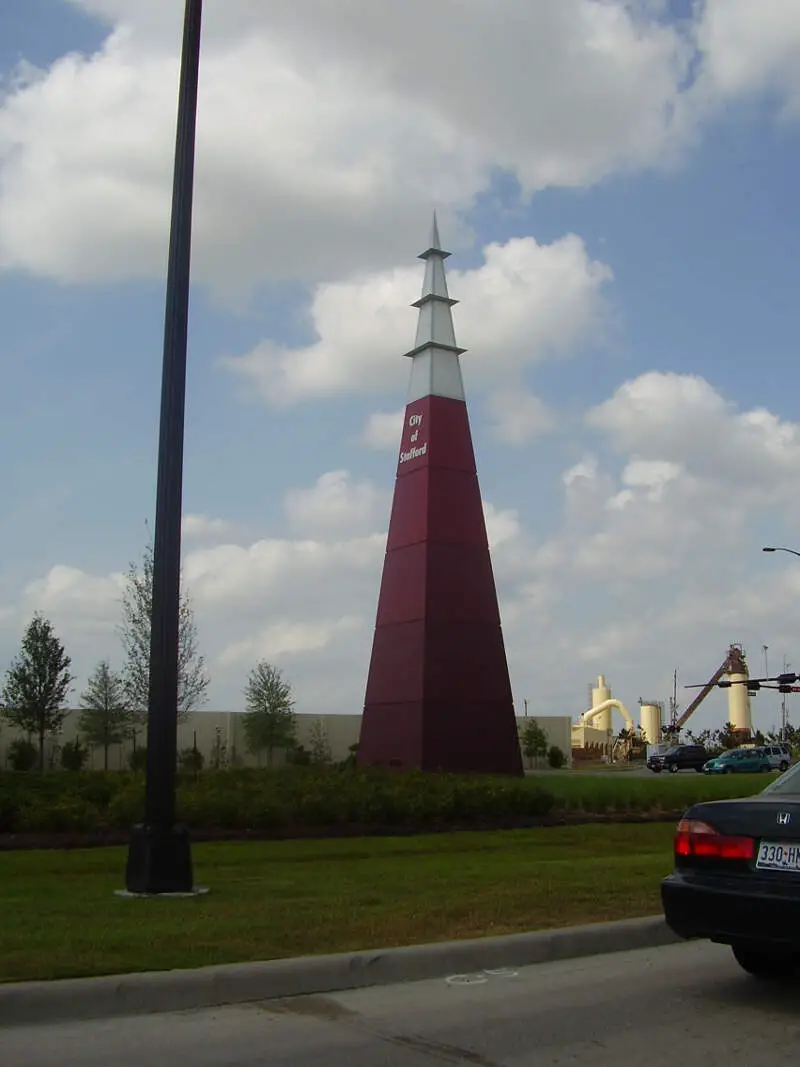
So what city is the most diverse in Texas? According to the most Census data, Stafford took the number one over all spot for diversity in Texas.
Read on below to see how we crunched the numbers and how your town ranked. To see where Texas ranked as a state, we have a ranking of the most diverse states in Ameria.
For more Texas reading:
The 10 Most Diverse Places In Texas For 2026

/10
Population: 17,401
HHI: 2,390
% White: 13.9%
% African American: 29.0%
% Hispanic: 27.2%
% Asian: 24.2%
More on Stafford: Data | Crime | Cost Of Living | Movers

/10
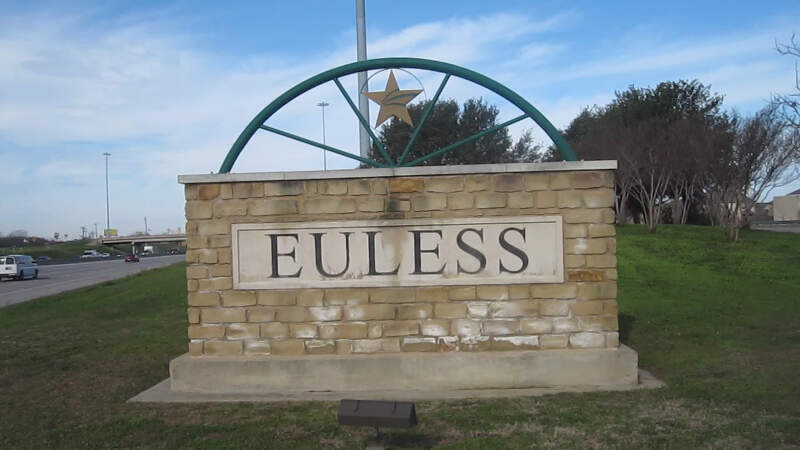
Population: 60,421
HHI: 2,424
% White: 37.3%
% African American: 17.2%
% Hispanic: 22.3%
% Asian: 13.3%
More on Euless: Data | Crime | Cost Of Living | Movers

/10
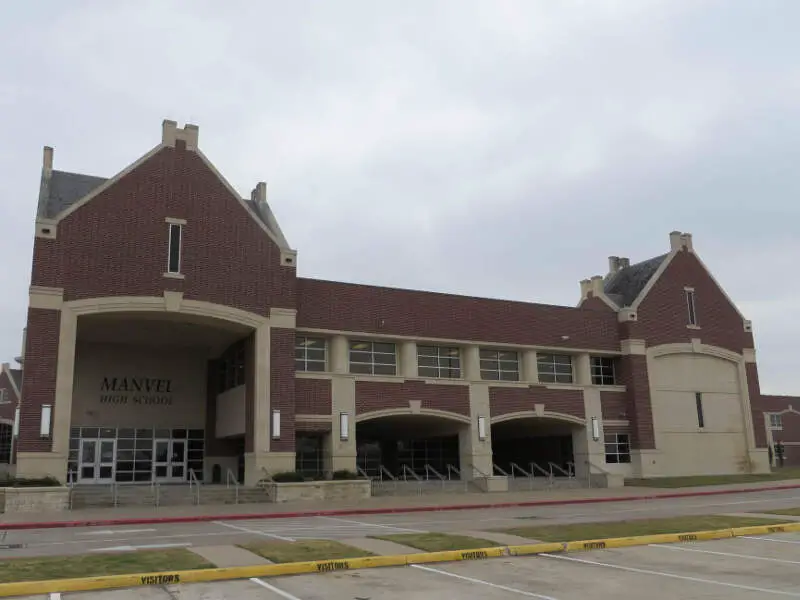
Population: 14,758
HHI: 2,533
% White: 33.2%
% African American: 28.8%
% Hispanic: 20.1%
% Asian: 13.4%
More on Manvel: Data | Crime | Cost Of Living | Movers

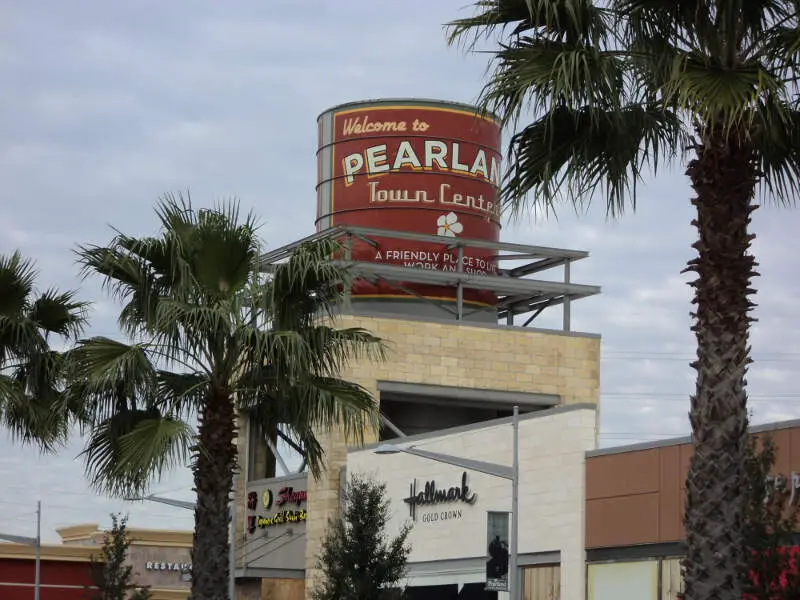
/10
Population: 127,514
HHI: 2,582
% White: 36.4%
% African American: 19.2%
% Hispanic: 25.4%
% Asian: 15.5%
More on Pearland: Data | Crime | Cost Of Living | Movers
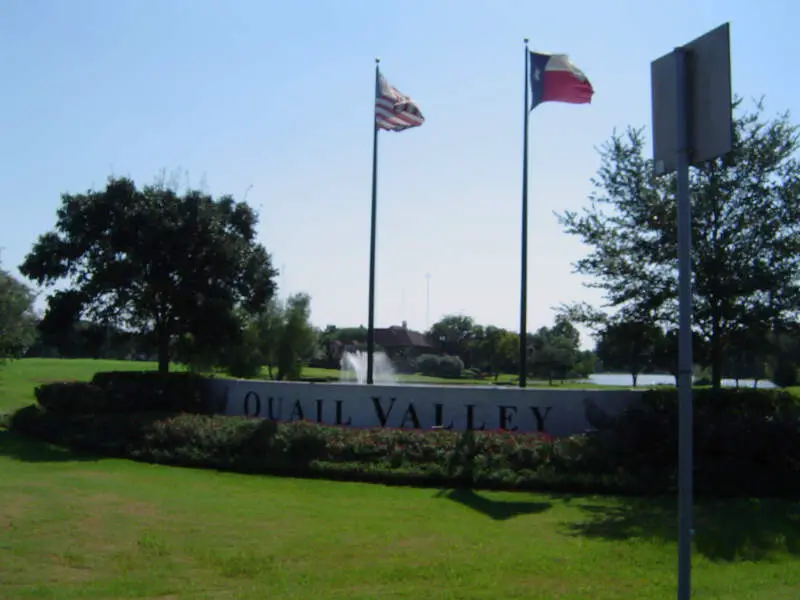
/10
Population: 76,558
HHI: 2,589
% White: 18.1%
% African American: 38.3%
% Hispanic: 20.8%
% Asian: 18.8%
More on Missouri City: Data | Crime | Cost Of Living | Movers

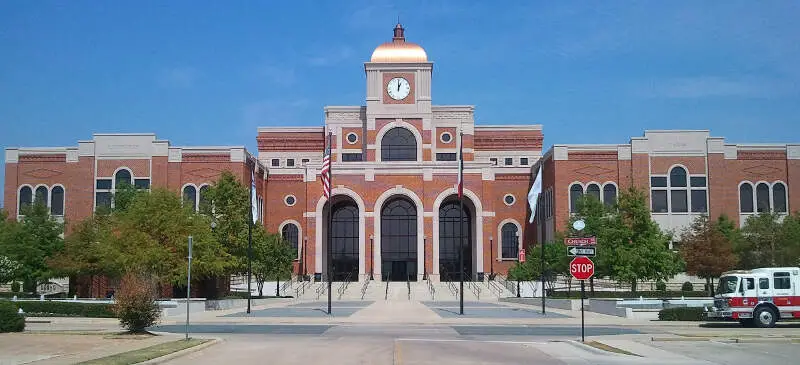
/10
Population: 131,080
HHI: 2,666
% White: 38.2%
% African American: 14.2%
% Hispanic: 27.5%
% Asian: 15.1%
More on Lewisville: Data | Crime | Cost Of Living | Movers

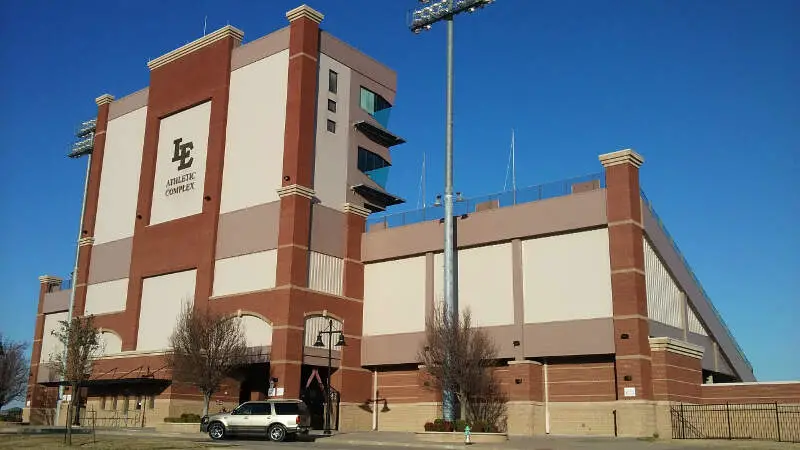
/10
Population: 54,820
HHI: 2,703
% White: 41.3%
% African American: 21.3%
% Hispanic: 19.8%
% Asian: 10.9%
More on Little Elm: Data | Crime | Cost Of Living | Movers

/10
Population: 158,159
HHI: 2,713
% White: 25.6%
% African American: 35.5%
% Hispanic: 27.2%
% Asian: 3.9%
More on Killeen: Data | Crime | Cost Of Living | Movers

/10
Population: 65,971
HHI: 2,725
% White: 34.5%
% African American: 17.5%
% Hispanic: 33.5%
% Asian: 9.3%
More on Pflugerville: Data | Crime | Cost Of Living | Movers

/10
Population: 34,128
HHI: 2,739
% White: 39.4%
% African American: 27.1%
% Hispanic: 19.5%
% Asian: 3.4%
More on Harker Heights: Data | Crime | Cost Of Living | Movers
Methodology: How we determined the most diverse cities in Texas for 2026
We still believe in the accuracy of data — especially from the Census — and Saturday Night Science. So that’s where we went to get the race breakdown across Texas.
That leads us to the Census’s most recently available data, the 2020-2024 American Community Survey data from the US Census.
Specifically, we looked at table B03002: HISPANIC OR LATINO ORIGIN BY RACE. Here are the category names as defined by the Census:
- White alone*
- Black or African American alone*
- American Indian and Alaska Native alone*
- Asian alone*
- Native Hawaiian and Other Pacific Islander alone*
- Some other race alone*
- Two or more races*
- Hispanic or Latino
We limited our analysis to non-CDPs with a population greater than 5,000 people. That left us with 372 cities.
We then calculated the HHI for each city by finding the racial breakdown of a city in percent terms, squaring them, and then adding the squares together. This left us with scores ranging from 2,390 (Stafford) to 9,747 (Hidalgo).
Finally, we ranked each city based on the HHI, with a lower score being more diverse than a high score. Stafford took the distinction of being the most diverse, while Hidalgo was the least diverse city.
We updated this article for 2026. This report is our eleventh time ranking the most diverse places in Texas.
Summary: Diversity Across Texas
If you’re looking for a scientific breakdown of diversity across Texas, this is an accurate list.
The most diverse cities in Texas are Stafford, Euless, Manvel, Pearland, Missouri City, Lewisville, Little Elm, Killeen, Pflugerville, and Harker Heights.
If you’re curious enough, here are the least diverse places in Texas:
- Hidalgo
- Elsa
- Penitas
For more Texas reading, check out:
- Best Places To Live In Texas
- Cheapest Places To Live In Texas
- Most Dangerous Places In Texas
- Best Places To Raise A Family In Texas
- Safest Places In Texas
- Worst Places To Live In Texas
Race By City In Texas For 2026
| Rank | City | Population | HHI | % White | % Black | % Hispanic | % Asian |
|---|---|---|---|---|---|---|---|
| 1 | Stafford, TX | 17,401 | 2,390 | 13.9% | 29.0% | 27.2% | 24.2% |
| 2 | Euless, TX | 60,421 | 2,424 | 37.3% | 17.2% | 22.3% | 13.3% |
| 3 | Manvel, TX | 14,758 | 2,533 | 33.2% | 28.8% | 20.1% | 13.4% |
| 4 | Pearland, TX | 127,514 | 2,582 | 36.4% | 19.2% | 25.4% | 15.5% |
| 5 | Missouri City, TX | 76,558 | 2,589 | 18.1% | 38.3% | 20.8% | 18.8% |
| 6 | Lewisville, TX | 131,080 | 2,666 | 38.2% | 14.2% | 27.5% | 15.1% |
| 7 | Little Elm, TX | 54,820 | 2,703 | 41.3% | 21.3% | 19.8% | 10.9% |
| 8 | Killeen, TX | 158,159 | 2,713 | 25.6% | 35.5% | 27.2% | 3.9% |
| 9 | Pflugerville, TX | 65,971 | 2,725 | 34.5% | 17.5% | 33.5% | 9.3% |
| 10 | Harker Heights, TX | 34,128 | 2,739 | 39.4% | 27.1% | 19.5% | 3.4% |
| 11 | Arlington, TX | 397,742 | 2,751 | 34.1% | 22.1% | 32.2% | 7.3% |
| 12 | Converse, TX | 29,607 | 2,845 | 26.5% | 24.9% | 38.4% | 3.4% |
| 13 | Carrollton, TX | 133,740 | 2,846 | 37.4% | 8.9% | 32.3% | 17.7% |
| 14 | Katy, TX | 25,184 | 2,896 | 41.5% | 11.2% | 29.8% | 11.6% |
| 15 | Irving, TX | 256,492 | 2,900 | 17.8% | 12.7% | 43.4% | 23.1% |
| 16 | Sachse, TX | 30,491 | 2,935 | 45.8% | 12.5% | 16.6% | 19.7% |
| 17 | Fort Worth, TX | 963,194 | 2,943 | 36.5% | 19.3% | 34.6% | 5.4% |
| 18 | La Marque, TX | 19,268 | 2,955 | 34.2% | 27.1% | 32.2% | 2.7% |
| 19 | Center, TX | 5,271 | 2,968 | 37.7% | 29.8% | 25.1% | 0.2% |
| 20 | Princeton, TX | 25,229 | 2,975 | 39.4% | 26.9% | 25.8% | 5.6% |
| 21 | Crowley, TX | 19,532 | 2,987 | 38.1% | 23.2% | 31.1% | 2.6% |
| 22 | Marlin, TX | 5,516 | 2,994 | 25.3% | 39.4% | 27.8% | 4.4% |
| 23 | Allen, TX | 110,265 | 3,030 | 47.4% | 12.1% | 12.6% | 21.0% |
| 24 | Addison, TX | 17,290 | 3,036 | 44.1% | 15.7% | 27.8% | 6.5% |
| 25 | Garland, TX | 246,844 | 3,040 | 24.2% | 15.1% | 45.7% | 11.3% |
| 26 | Houston, TX | 2,328,253 | 3,049 | 23.2% | 22.3% | 44.2% | 6.9% |
| 27 | Selma, TX | 11,503 | 3,058 | 35.7% | 22.3% | 35.6% | 2.2% |
| 28 | Sugar Land, TX | 110,016 | 3,061 | 36.5% | 7.3% | 13.3% | 38.5% |
| 29 | Sunnyvale, TX | 8,336 | 3,073 | 46.4% | 10.4% | 14.4% | 24.1% |
| 30 | Texas City, TX | 55,364 | 3,074 | 36.9% | 26.0% | 31.9% | 1.5% |
| 31 | Lacy-Lakeview, TX | 7,274 | 3,086 | 39.7% | 29.6% | 24.8% | 0.8% |
| 32 | Plano, TX | 290,594 | 3,099 | 46.6% | 8.7% | 16.7% | 23.6% |
| 33 | Red Oak, TX | 17,077 | 3,116 | 27.3% | 43.1% | 21.8% | 1.7% |
| 34 | Webster, TX | 12,366 | 3,117 | 44.9% | 16.9% | 27.4% | 7.1% |
| 35 | Dallas, TX | 1,307,930 | 3,120 | 27.6% | 22.9% | 42.6% | 3.8% |
| 36 | Live Oak, TX | 15,984 | 3,121 | 33.4% | 17.4% | 40.8% | 5.7% |
| 37 | Farmers Branch, TX | 36,645 | 3,124 | 35.6% | 8.8% | 40.6% | 11.1% |
| 38 | Iowa Colony, TX | 12,891 | 3,132 | 24.9% | 45.3% | 20.2% | 3.7% |
| 39 | Cibolo, TX | 35,109 | 3,137 | 44.3% | 13.3% | 30.3% | 2.5% |
| 40 | Wharton, TX | 8,724 | 3,138 | 26.2% | 22.0% | 44.0% | 1.3% |
| 41 | Frisco, TX | 219,304 | 3,138 | 45.8% | 9.0% | 12.7% | 28.1% |
| 42 | Richardson, TX | 118,731 | 3,166 | 49.2% | 11.6% | 18.3% | 16.1% |
| 43 | Rowlett, TX | 65,463 | 3,168 | 47.3% | 19.8% | 21.7% | 7.0% |
| 44 | Corsicana, TX | 25,511 | 3,169 | 40.1% | 13.0% | 36.6% | 1.7% |
| 45 | Mesquite, TX | 149,299 | 3,183 | 22.5% | 26.8% | 44.0% | 3.0% |
| 46 | Grand Prairie, TX | 201,883 | 3,189 | 18.7% | 24.8% | 46.6% | 6.9% |
| 47 | Round Rock, TX | 127,786 | 3,190 | 45.9% | 11.0% | 29.7% | 8.1% |
| 48 | Beaumont, TX | 113,279 | 3,197 | 26.3% | 45.2% | 20.8% | 3.8% |
| 49 | Terrell, TX | 20,366 | 3,209 | 37.0% | 23.9% | 35.5% | 0.2% |
| 50 | Coppell, TX | 42,154 | 3,215 | 45.3% | 5.6% | 15.3% | 29.8% |
| 51 | Marshall, TX | 23,825 | 3,240 | 33.8% | 39.7% | 22.5% | 0.3% |
| 52 | Hitchcock, TX | 7,563 | 3,240 | 43.1% | 21.2% | 30.3% | 0.5% |
| 53 | Mexia, TX | 6,859 | 3,268 | 31.4% | 27.7% | 38.9% | 0.6% |
| 54 | Cleveland, TX | 8,984 | 3,274 | 37.2% | 27.9% | 33.4% | 0.5% |
| 55 | Waco, TX | 143,570 | 3,275 | 44.2% | 19.3% | 30.6% | 2.1% |
| 56 | Wylie, TX | 60,334 | 3,290 | 51.1% | 14.5% | 17.7% | 11.3% |
| 57 | Navasota, TX | 8,542 | 3,294 | 36.4% | 24.3% | 37.1% | 0.0% |
| 58 | Lufkin, TX | 34,251 | 3,295 | 42.4% | 18.3% | 33.8% | 1.8% |
| 59 | Duncanville, TX | 39,683 | 3,317 | 22.1% | 29.3% | 44.3% | 1.3% |
| 60 | Mckinney, TX | 210,600 | 3,322 | 51.5% | 12.1% | 17.2% | 14.4% |
| 61 | Tyler, TX | 109,215 | 3,326 | 47.5% | 22.2% | 23.7% | 2.7% |
| 62 | Windcrest, TX | 5,820 | 3,343 | 41.9% | 8.7% | 38.1% | 7.1% |
| 63 | Schertz, TX | 44,050 | 3,347 | 44.6% | 11.9% | 34.5% | 2.1% |
| 64 | Mansfield, TX | 77,510 | 3,348 | 49.3% | 23.7% | 17.8% | 4.4% |
| 65 | Port Arthur, TX | 55,828 | 3,352 | 15.8% | 41.9% | 36.4% | 4.5% |
| 66 | Jacksonville, TX | 14,325 | 3,356 | 40.9% | 20.4% | 35.5% | 0.4% |
| 67 | Austin, TX | 979,539 | 3,379 | 47.0% | 7.3% | 31.9% | 9.0% |
| 68 | Copperas Cove, TX | 37,947 | 3,382 | 51.2% | 13.0% | 22.0% | 2.1% |
| 69 | Palestine, TX | 19,136 | 3,393 | 45.8% | 26.7% | 24.0% | 0.1% |
| 70 | Huntsville, TX | 47,864 | 3,399 | 48.1% | 22.5% | 23.7% | 1.5% |
| 71 | Brenham, TX | 18,641 | 3,401 | 49.1% | 19.8% | 24.0% | 2.1% |
| 72 | Bryan, TX | 87,939 | 3,406 | 38.3% | 15.7% | 41.0% | 1.5% |
| 73 | Celina, TX | 34,268 | 3,408 | 53.1% | 9.1% | 14.2% | 16.7% |
| 74 | Leander, TX | 74,067 | 3,409 | 50.6% | 6.2% | 24.0% | 14.8% |
| 75 | Kennedale, TX | 9,439 | 3,419 | 51.4% | 16.5% | 21.2% | 4.3% |
| 76 | Richmond, TX | 12,582 | 3,435 | 22.9% | 22.1% | 49.0% | 4.6% |
| 77 | Kilgore, TX | 13,470 | 3,438 | 49.5% | 14.0% | 26.9% | 0.8% |
| 78 | Fulshear, TX | 34,868 | 3,441 | 52.2% | 4.0% | 18.2% | 17.7% |
| 79 | Crockett, TX | 6,364 | 3,454 | 39.6% | 40.1% | 16.2% | 0.8% |
| 80 | Gatesville, TX | 16,228 | 3,465 | 49.9% | 15.6% | 26.4% | 1.3% |
| 81 | Jersey Village, TX | 7,817 | 3,474 | 51.7% | 14.9% | 22.9% | 7.1% |
| 82 | Rusk, TX | 5,477 | 3,475 | 48.5% | 28.6% | 17.1% | 0.8% |
| 83 | Hutto, TX | 35,483 | 3,485 | 48.0% | 10.7% | 32.1% | 2.4% |
| 84 | Nacogdoches, TX | 32,197 | 3,488 | 49.4% | 24.7% | 20.7% | 1.0% |
| 85 | Giddings, TX | 5,151 | 3,507 | 42.6% | 15.7% | 37.9% | 0.0% |
| 86 | Commerce, TX | 9,383 | 3,511 | 51.0% | 20.6% | 21.6% | 2.3% |
| 87 | Lavon, TX | 6,498 | 3,518 | 54.0% | 8.5% | 20.7% | 7.8% |
| 88 | The Colony, TX | 45,454 | 3,519 | 53.5% | 9.9% | 21.2% | 8.0% |
| 89 | Sealy, TX | 7,053 | 3,527 | 38.1% | 9.8% | 44.2% | 3.4% |
| 90 | Venus, TX | 6,745 | 3,528 | 46.0% | 16.6% | 33.6% | 0.4% |
| 91 | Athens, TX | 13,200 | 3,536 | 48.3% | 13.1% | 31.8% | 2.9% |
| 92 | Longview, TX | 82,923 | 3,545 | 51.4% | 20.1% | 21.8% | 1.6% |
| 93 | Haltom City, TX | 45,767 | 3,547 | 39.1% | 5.3% | 43.7% | 8.9% |
| 94 | Forney, TX | 31,532 | 3,565 | 51.7% | 19.3% | 22.4% | 2.9% |
| 95 | Elgin, TX | 11,563 | 3,565 | 33.0% | 16.5% | 46.9% | 0.3% |
| 96 | Galveston, TX | 53,424 | 3,573 | 49.8% | 15.0% | 29.3% | 2.8% |
| 97 | Seagoville, TX | 19,352 | 3,591 | 25.6% | 17.1% | 51.3% | 0.4% |
| 98 | Vernon, TX | 9,848 | 3,613 | 48.8% | 6.4% | 33.6% | 3.9% |
| 99 | Fate, TX | 22,884 | 3,619 | 49.5% | 11.0% | 32.0% | 3.1% |
| 100 | Saginaw, TX | 24,970 | 3,619 | 45.3% | 10.5% | 38.0% | 3.2% |