Plano, TX
Demographics And Statistics
Living In Plano, Texas Summary
Life in Plano research summary. HomeSnacks has been using Saturday Night Science to research the quality of life in Plano over the past nine years using Census, FBI, Zillow, and other primary data sources. Based on the most recently available data, we found the following about life in Plano:
The population in Plano is 287,339.
The median home value in Plano is $498,576.
The median income in Plano is $108,649.
The cost of living in Plano is 129 which is 1.3x higher than the national average.
The median rent in Plano is $1,792.
The unemployment rate in Plano is 4.1%.
The poverty rate in Plano is 7.1%.
The average high in Plano is 75.6° and the average low is 54.4°.
Plano SnackAbility
Overall SnackAbility
Plano, TX Crime Report
Crime in Plano summary. We use data from the FBI to determine the crime rates in Plano. Key points include:
There were 4,716 total crimes in Plano in the last reporting year.
The overall crime rate per 100,000 people in Plano is 1,618.0 / 100k people.
The violent crime rate per 100,000 people in Plano is 151.6 / 100k people.
The property crime rate per 100,000 people in Plano is 1,466.4 / 100k people.
Overall, crime in Plano is -23.65% below the national average.
Total Crimes
Below National Average
Crime In Plano Comparison Table
| Statistic | Count Raw |
Plano / 100k People |
Texas / 100k People |
National / 100k People |
|---|---|---|---|---|
| Total Crimes Per 100K | 4,716 | 1,618.0 | 2,429.9 | 2,119.2 |
| Violent Crime | 442 | 151.6 | 389.4 | 359.0 |
| Murder | 3 | 1.0 | 5.2 | 5.0 |
| Robbery | 78 | 26.8 | 63.5 | 61.0 |
| Aggravated Assault | 264 | 90.6 | 270.7 | 256.0 |
| Property Crime | 4,274 | 1,466.4 | 2,040.5 | 1,760.0 |
| Burglary | 468 | 160.6 | 284.3 | 229.0 |
| Larceny | 3,391 | 1,163.4 | 1,425.6 | 1,272.0 |
| Car Theft | 415 | 142.4 | 330.7 | 259.0 |
Plano, TX Cost Of Living
Cost of living in Plano summary. We use data on the cost of living to determine how expensive it is to live in Plano. Real estate prices drive most of the variance in cost of living around Texas. Key points include:
The cost of living in Plano is 129 with 100 being average.
The cost of living in Plano is 1.3x higher than the national average.
The median home value in Plano is $498,576.
The median income in Plano is $108,649.
Plano's Overall Cost Of Living
Higher Than The National Average
Cost Of Living In Plano Comparison Table
| Living Expense | Plano | Texas | National Average | |
|---|---|---|---|---|
| Overall | 129 | 92 | 100 | |
| Services | 121 | 97 | 100 | |
| Groceries | 97 | 97 | 100 | |
| Health | 108 | 93 | 100 | |
| Housing | 177 | 82 | 100 | |
| Transportation | 96 | 94 | 100 | |
| Utilities | 116 | 104 | 100 | |
Plano, TX Weather
The average high in Plano is 75.6° and the average low is 54.4°.
There are 56.7 days of precipitation each year.
Expect an average of 40.1 inches of precipitation each year with 1.6 inches of snow.
| Stat | Plano |
|---|---|
| Average Annual High | 75.6 |
| Average Annual Low | 54.4 |
| Annual Precipitation Days | 56.7 |
| Average Annual Precipitation | 40.1 |
| Average Annual Snowfall | 1.6 |
Average High
Days of Rain
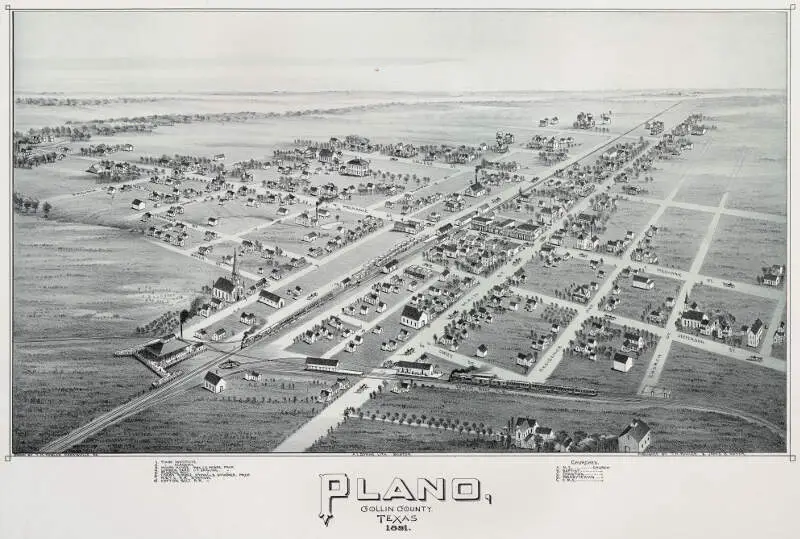
Plano, TX Photos


1 Reviews & Comments About Plano
/5

HomeSnacks User - 2018-09-10 13:24:07.891947
It was an awesome place to visit. I felt totally safe and the weather could not have been any better.
The food was outstanding. Getting around the city was easy and the roads were in perfect condition.
Plano Articles


Rankings for Plano in Texas

Locations Around Plano
Map Of Plano, TX
Best Places Around Plano
Murphy, TX
Population 21,001
Allen, TX
Population 107,684
Corinth, TX
Population 22,868
Frisco, TX
Population 210,238
University Park, TX
Population 25,104
Coppell, TX
Population 42,029
Carrollton, TX
Population 132,741
Richardson, TX
Population 118,269
McKinney, TX
Population 202,314
The Colony, TX
Population 44,916
Plano Demographics And Statistics
Population over time in Plano
The current population in Plano is 287,339. The population has increased 12.2% from 2010.
| Year | Population | % Change |
|---|---|---|
| 2023 | 287,339 | 0.8% |
| 2022 | 284,948 | 1.0% |
| 2021 | 282,181 | -2.3% |
| 2020 | 288,870 | 0.6% |
| 2019 | 287,064 | 0.9% |
| 2018 | 284,579 | 1.1% |
| 2017 | 281,566 | 0.9% |
| 2016 | 279,088 | 1.2% |
| 2015 | 275,645 | 1.7% |
| 2014 | 271,166 | 1.7% |
| 2013 | 266,740 | 1.4% |
| 2012 | 263,122 | 1.1% |
| 2011 | 260,197 | 1.6% |
| 2010 | 256,099 | - |
Race / Ethnicity in Plano
Plano is:
48.2% White with 138,393 White residents.
8.9% African American with 25,486 African American residents.
0.2% American Indian with 503 American Indian residents.
22.6% Asian with 64,798 Asian residents.
0.0% Hawaiian with 128 Hawaiian residents.
0.7% Other with 2,056 Other residents.
3.3% Two Or More with 9,403 Two Or More residents.
16.2% Hispanic with 46,572 Hispanic residents.
| Race | Plano | TX | USA |
|---|---|---|---|
| White | 48.2% | 39.9% | 58.2% |
| African American | 8.9% | 11.9% | 12.0% |
| American Indian | 0.2% | 0.2% | 0.5% |
| Asian | 22.6% | 5.3% | 5.7% |
| Hawaiian | 0.0% | 0.1% | 0.2% |
| Other | 0.7% | 0.4% | 0.5% |
| Two Or More | 3.3% | 2.9% | 3.9% |
| Hispanic | 16.2% | 39.5% | 19.0% |
Gender in Plano
Plano is 50.5% female with 145,185 female residents.
Plano is 49.5% male with 142,153 male residents.
| Gender | Plano | TX | USA |
|---|---|---|---|
| Female | 50.5% | 50.1% | 50.5% |
| Male | 49.5% | 49.9% | 49.5% |
Highest level of educational attainment in Plano for adults over 25
2.0% of adults in Plano completed < 9th grade.
3.0% of adults in Plano completed 9-12th grade.
13.0% of adults in Plano completed high school / ged.
16.0% of adults in Plano completed some college.
7.0% of adults in Plano completed associate's degree.
35.0% of adults in Plano completed bachelor's degree.
19.0% of adults in Plano completed master's degree.
3.0% of adults in Plano completed professional degree.
2.0% of adults in Plano completed doctorate degree.
| Education | Plano | TX | USA |
|---|---|---|---|
| < 9th Grade | 2.0% | 7.0% | 5.0% |
| 9-12th Grade | 3.0% | 7.0% | 6.0% |
| High School / GED | 13.0% | 24.0% | 26.0% |
| Some College | 16.0% | 21.0% | 19.0% |
| Associate's Degree | 7.0% | 8.0% | 9.0% |
| Bachelor's Degree | 35.0% | 21.0% | 21.0% |
| Master's Degree | 19.0% | 9.0% | 10.0% |
| Professional Degree | 3.0% | 2.0% | 2.0% |
| Doctorate Degree | 2.0% | 1.0% | 2.0% |
Household Income For Plano, Texas
3.2% of households in Plano earn Less than $10,000.
1.4% of households in Plano earn $10,000 to $14,999.
3.4% of households in Plano earn $15,000 to $24,999.
3.9% of households in Plano earn $25,000 to $34,999.
6.8% of households in Plano earn $35,000 to $49,999.
14.0% of households in Plano earn $50,000 to $74,999.
13.1% of households in Plano earn $75,000 to $99,999.
19.5% of households in Plano earn $100,000 to $149,999.
12.7% of households in Plano earn $150,000 to $199,999.
22.1% of households in Plano earn $200,000 or more.
| Income | Plano | TX | USA |
|---|---|---|---|
| Less than $10,000 | 3.2% | 5.0% | 4.9% |
| $10,000 to $14,999 | 1.4% | 3.4% | 3.6% |
| $15,000 to $24,999 | 3.4% | 6.5% | 6.6% |
| $25,000 to $34,999 | 3.9% | 7.0% | 6.8% |
| $35,000 to $49,999 | 6.8% | 10.9% | 10.4% |
| $50,000 to $74,999 | 14.0% | 16.4% | 15.7% |
| $75,000 to $99,999 | 13.1% | 12.8% | 12.7% |
| $100,000 to $149,999 | 19.5% | 17.2% | 17.4% |
| $150,000 to $199,999 | 12.7% | 9.1% | 9.3% |
| $200,000 or more | 22.1% | 11.7% | 12.6% |


