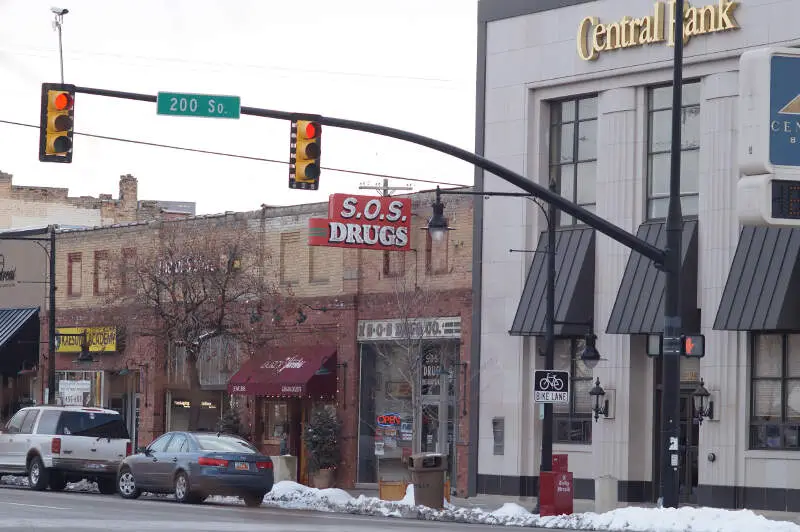
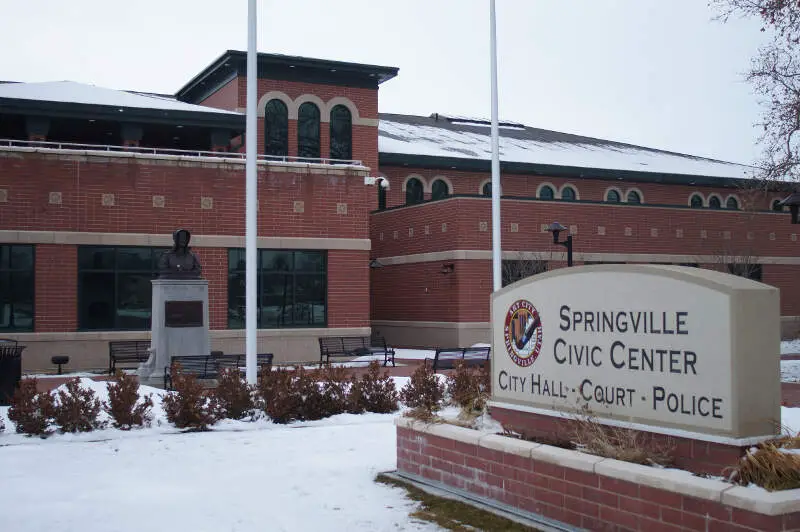
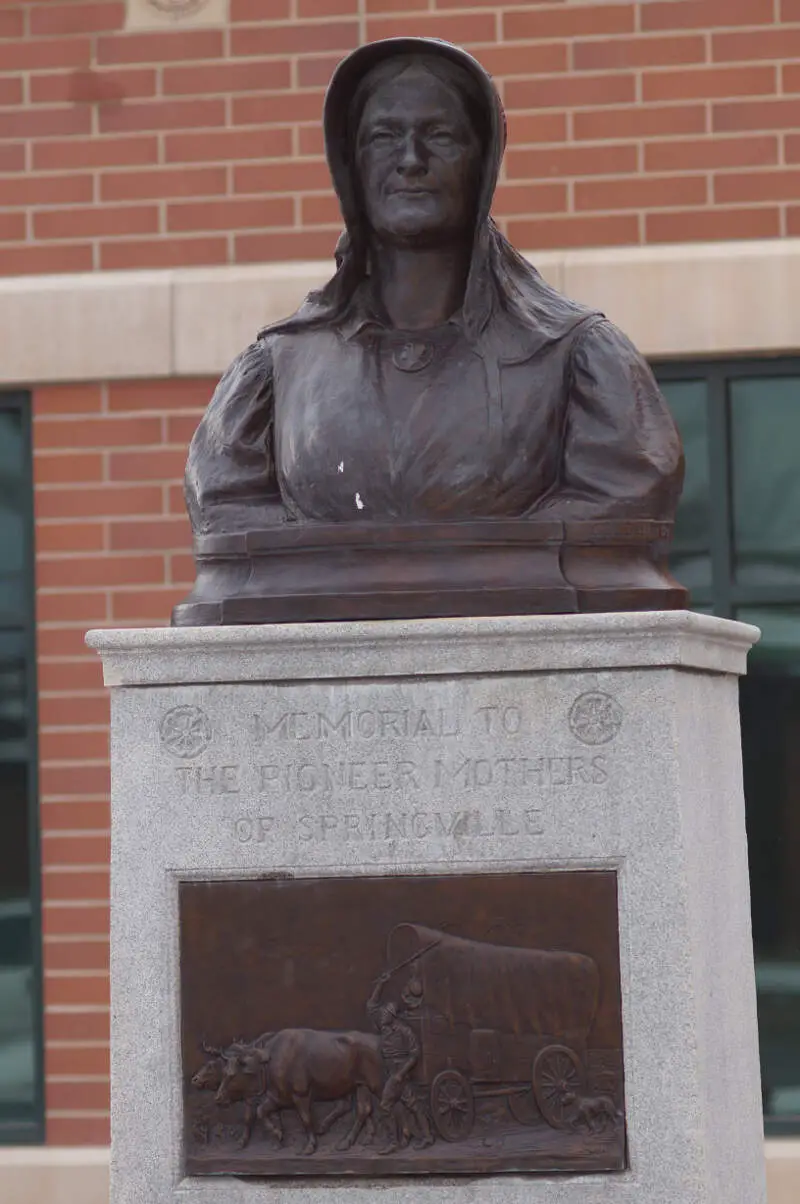
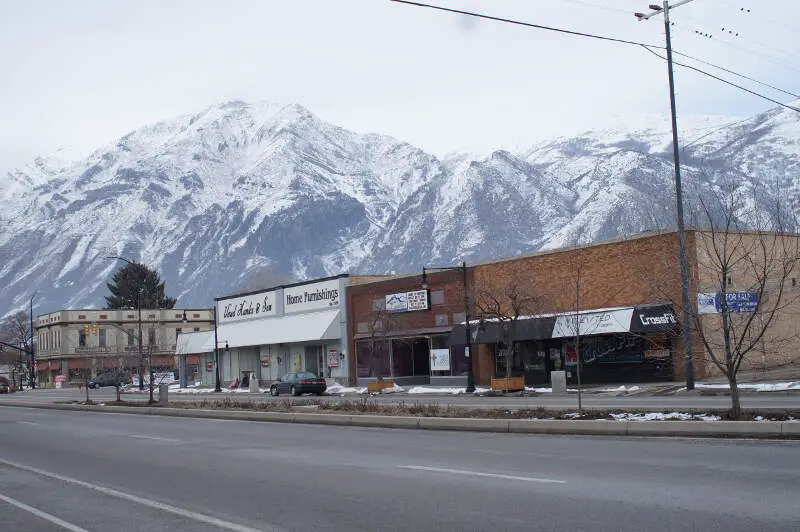
Springville, UT
Demographics And Statistics
Living In Springville, Utah Summary
Life in Springville research summary. HomeSnacks has been using Saturday Night Science to research the quality of life in Springville over the past nine years using Census, FBI, Zillow, and other primary data sources. Based on the most recently available data, we found the following about life in Springville:
The population in Springville is 35,474.
The median home value in Springville is $499,550.
The median income in Springville is $88,516.
The cost of living in Springville is 112 which is 1.1x higher than the national average.
The median rent in Springville is $1,472.
The unemployment rate in Springville is 2.5%.
The poverty rate in Springville is 7.5%.
The average high in Springville is 64.5° and the average low is 38.5°.
Springville SnackAbility
Overall SnackAbility
Springville, UT Crime Report
Crime in Springville summary. We use data from the FBI to determine the crime rates in Springville. Key points include:
There were 350 total crimes in Springville in the last reporting year.
The overall crime rate per 100,000 people in Springville is 985.3 / 100k people.
The violent crime rate per 100,000 people in Springville is 160.5 / 100k people.
The property crime rate per 100,000 people in Springville is 824.9 / 100k people.
Overall, crime in Springville is -53.51% below the national average.
Total Crimes
Below National Average
Crime In Springville Comparison Table
| Statistic | Count Raw |
Springville / 100k People |
Utah / 100k People |
National / 100k People |
|---|---|---|---|---|
| Total Crimes Per 100K | 350 | 985.3 | 1,638.5 | 2,119.2 |
| Violent Crime | 57 | 160.5 | 229.6 | 359.0 |
| Murder | 0 | 0.0 | 2.6 | 5.0 |
| Robbery | 7 | 19.7 | 27.3 | 61.0 |
| Aggravated Assault | 30 | 84.5 | 141.7 | 256.0 |
| Property Crime | 293 | 824.9 | 1,408.9 | 1,760.0 |
| Burglary | 20 | 56.3 | 146.6 | 229.0 |
| Larceny | 250 | 703.8 | 1,145.8 | 1,272.0 |
| Car Theft | 23 | 64.8 | 116.5 | 259.0 |
Springville, UT Cost Of Living
Cost of living in Springville summary. We use data on the cost of living to determine how expensive it is to live in Springville. Real estate prices drive most of the variance in cost of living around Utah. Key points include:
The cost of living in Springville is 112 with 100 being average.
The cost of living in Springville is 1.1x higher than the national average.
The median home value in Springville is $499,550.
The median income in Springville is $88,516.
Springville's Overall Cost Of Living
Higher Than The National Average
Cost Of Living In Springville Comparison Table
| Living Expense | Springville | Utah | National Average | |
|---|---|---|---|---|
| Overall | 112 | 104 | 100 | |
| Services | 103 | 101 | 100 | |
| Groceries | 99 | 98 | 100 | |
| Health | 94 | 90 | 100 | |
| Housing | 148 | 115 | 100 | |
| Transportation | 105 | 104 | 100 | |
| Utilities | 91 | 96 | 100 | |
Springville, UT Weather
The average high in Springville is 64.5° and the average low is 38.5°.
There are 56.7 days of precipitation each year.
Expect an average of 18.3 inches of precipitation each year with 55.2 inches of snow.
| Stat | Springville |
|---|---|
| Average Annual High | 64.5 |
| Average Annual Low | 38.5 |
| Annual Precipitation Days | 56.7 |
| Average Annual Precipitation | 18.3 |
| Average Annual Snowfall | 55.2 |
Average High
Days of Rain
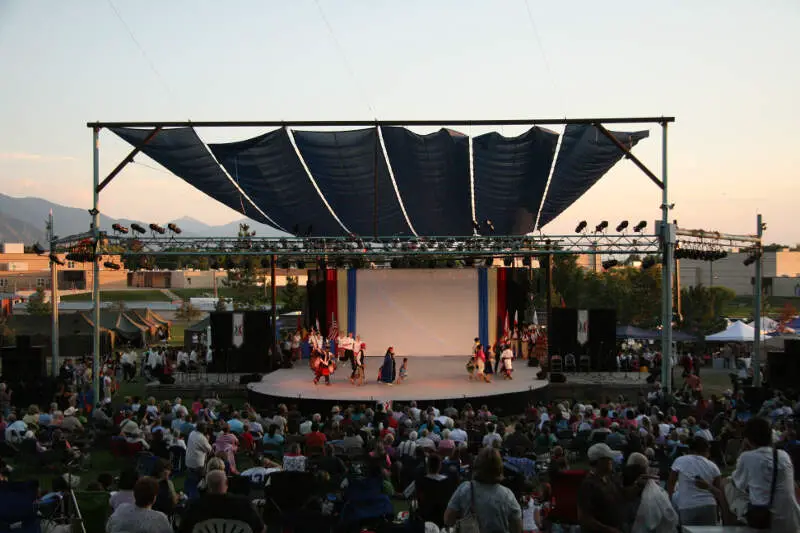
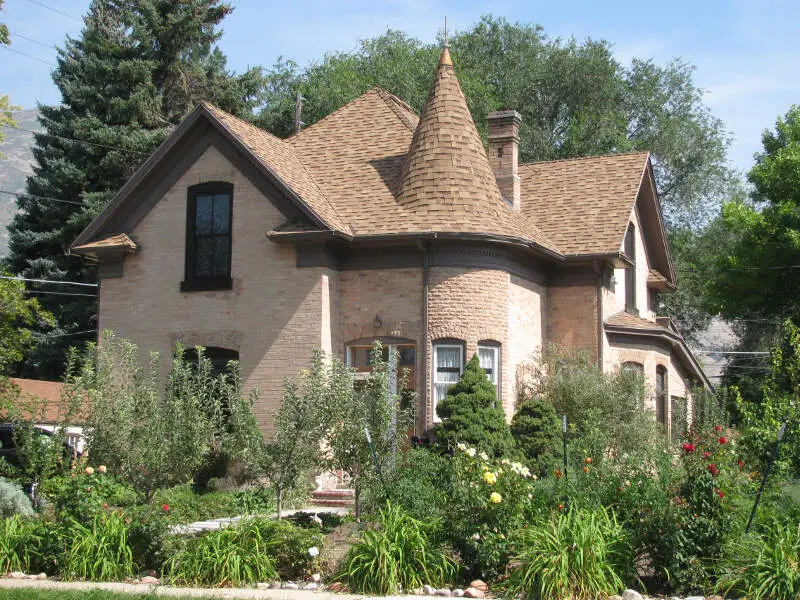
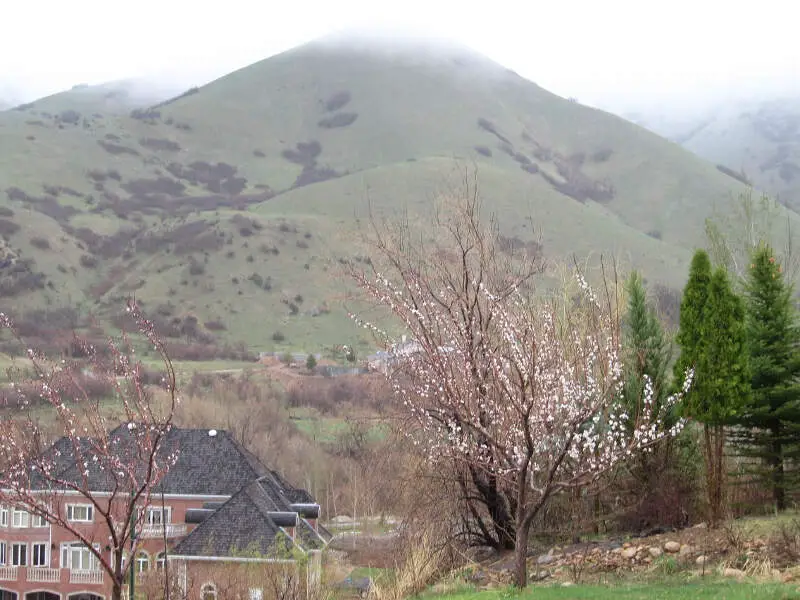
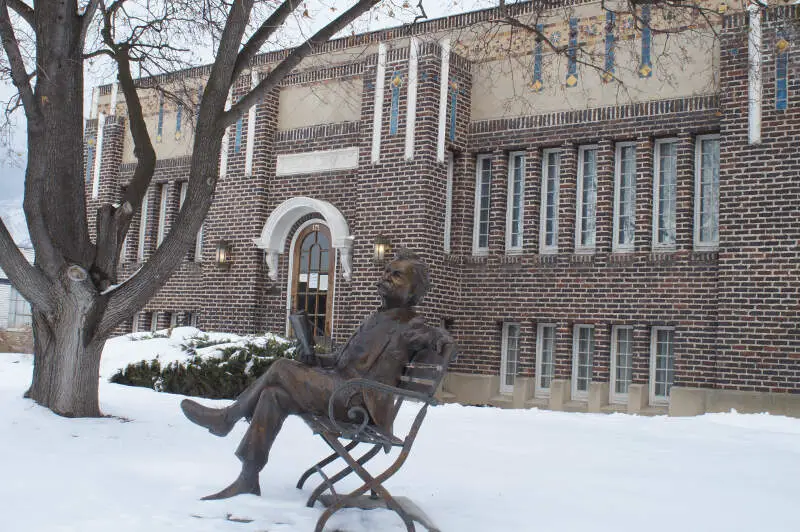
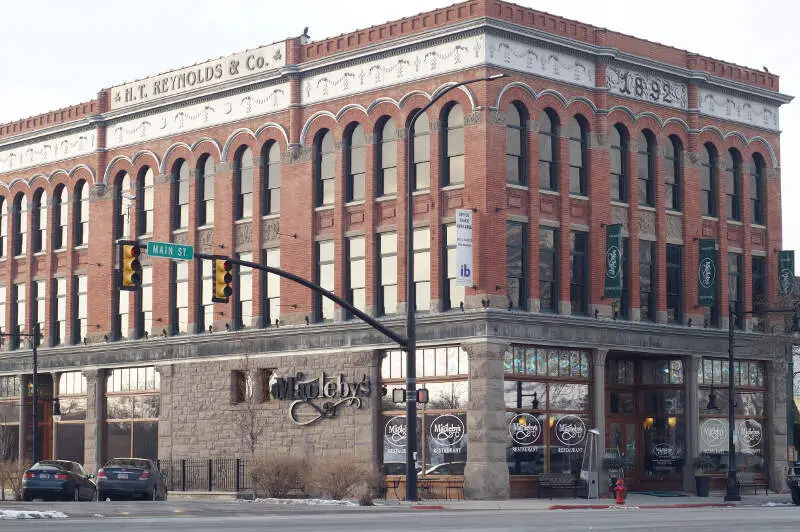
Springville, UT Photos
Rankings for Springville in Utah


Locations Around Springville
Map Of Springville, UT
Best Places Around Springville
Cedar Hills, UT
Population 9,945
Lindon, UT
Population 11,594
Pleasant Grove, UT
Population 37,544
Mapleton, UT
Population 12,340
Saratoga Springs, UT
Population 44,070
Orem, UT
Population 97,048
Salem, UT
Population 9,893
Spanish Fork, UT
Population 43,632
American Fork, UT
Population 35,312
Provo, UT
Population 114,303
Springville Demographics And Statistics
Population over time in Springville
The current population in Springville is 35,474. The population has increased 28.4% from 2010.
| Year | Population | % Change |
|---|---|---|
| 2023 | 35,474 | 0.8% |
| 2022 | 35,195 | 1.3% |
| 2021 | 34,750 | 4.5% |
| 2020 | 33,251 | 0.9% |
| 2019 | 32,952 | 1.1% |
| 2018 | 32,603 | 0.9% |
| 2017 | 32,319 | 1.6% |
| 2016 | 31,796 | 2.0% |
| 2015 | 31,178 | 1.7% |
| 2014 | 30,649 | 1.8% |
| 2013 | 30,113 | 2.4% |
| 2012 | 29,416 | 2.8% |
| 2011 | 28,626 | 3.6% |
| 2010 | 27,633 | - |
Race / Ethnicity in Springville
Springville is:
76.5% White with 27,153 White residents.
0.3% African American with 118 African American residents.
0.3% American Indian with 122 American Indian residents.
1.1% Asian with 397 Asian residents.
0.8% Hawaiian with 301 Hawaiian residents.
0.1% Other with 51 Other residents.
2.8% Two Or More with 979 Two Or More residents.
17.9% Hispanic with 6,353 Hispanic residents.
| Race | Springville | UT | USA |
|---|---|---|---|
| White | 76.5% | 75.7% | 58.2% |
| African American | 0.3% | 1.0% | 12.0% |
| American Indian | 0.3% | 0.7% | 0.5% |
| Asian | 1.1% | 2.3% | 5.7% |
| Hawaiian | 0.8% | 0.9% | 0.2% |
| Other | 0.1% | 0.4% | 0.5% |
| Two Or More | 2.8% | 3.6% | 3.9% |
| Hispanic | 17.9% | 15.4% | 19.0% |
Gender in Springville
Springville is 49.4% female with 17,512 female residents.
Springville is 50.6% male with 17,962 male residents.
| Gender | Springville | UT | USA |
|---|---|---|---|
| Female | 49.4% | 49.4% | 50.5% |
| Male | 50.6% | 50.6% | 49.5% |
Highest level of educational attainment in Springville for adults over 25
2.0% of adults in Springville completed < 9th grade.
3.0% of adults in Springville completed 9-12th grade.
22.0% of adults in Springville completed high school / ged.
25.0% of adults in Springville completed some college.
10.0% of adults in Springville completed associate's degree.
27.0% of adults in Springville completed bachelor's degree.
9.0% of adults in Springville completed master's degree.
1.0% of adults in Springville completed professional degree.
1.0% of adults in Springville completed doctorate degree.
| Education | Springville | UT | USA |
|---|---|---|---|
| < 9th Grade | 2.0% | 3.0% | 5.0% |
| 9-12th Grade | 3.0% | 4.0% | 6.0% |
| High School / GED | 22.0% | 22.0% | 26.0% |
| Some College | 25.0% | 24.0% | 19.0% |
| Associate's Degree | 10.0% | 10.0% | 9.0% |
| Bachelor's Degree | 27.0% | 24.0% | 21.0% |
| Master's Degree | 9.0% | 9.0% | 10.0% |
| Professional Degree | 1.0% | 2.0% | 2.0% |
| Doctorate Degree | 1.0% | 2.0% | 2.0% |
Household Income For Springville, Utah
2.3% of households in Springville earn Less than $10,000.
1.1% of households in Springville earn $10,000 to $14,999.
6.4% of households in Springville earn $15,000 to $24,999.
5.5% of households in Springville earn $25,000 to $34,999.
10.1% of households in Springville earn $35,000 to $49,999.
14.7% of households in Springville earn $50,000 to $74,999.
17.4% of households in Springville earn $75,000 to $99,999.
22.6% of households in Springville earn $100,000 to $149,999.
10.7% of households in Springville earn $150,000 to $199,999.
9.2% of households in Springville earn $200,000 or more.
| Income | Springville | UT | USA |
|---|---|---|---|
| Less than $10,000 | 2.3% | 3.1% | 4.9% |
| $10,000 to $14,999 | 1.1% | 2.1% | 3.6% |
| $15,000 to $24,999 | 6.4% | 4.3% | 6.6% |
| $25,000 to $34,999 | 5.5% | 5.3% | 6.8% |
| $35,000 to $49,999 | 10.1% | 9.2% | 10.4% |
| $50,000 to $74,999 | 14.7% | 15.9% | 15.7% |
| $75,000 to $99,999 | 17.4% | 14.6% | 12.7% |
| $100,000 to $149,999 | 22.6% | 21.6% | 17.4% |
| $150,000 to $199,999 | 10.7% | 11.3% | 9.3% |
| $200,000 or more | 9.2% | 12.6% | 12.6% |


