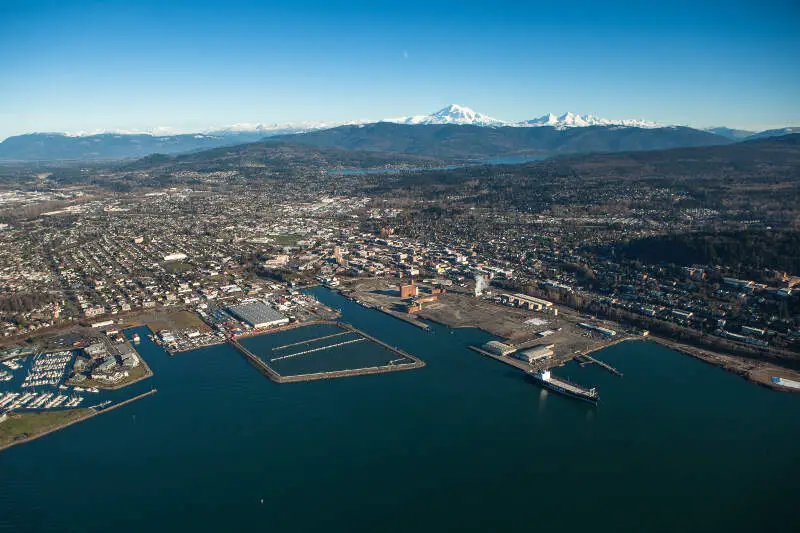
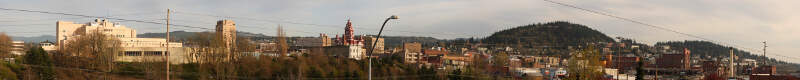
Bellingham, WA
Demographics And Statistics
Living In Bellingham, Washington Summary
Life in Bellingham research summary. HomeSnacks has been using Saturday Night Science to research the quality of life in Bellingham over the past nine years using Census, FBI, Zillow, and other primary data sources. Based on the most recently available data, we found the following about life in Bellingham:
The population in Bellingham is 92,367.
The median home value in Bellingham is $664,946.
The median income in Bellingham is $65,821.
The cost of living in Bellingham is 136 which is 1.4x higher than the national average.
The median rent in Bellingham is $1,478.
The unemployment rate in Bellingham is 5.6%.
The poverty rate in Bellingham is 18.3%.
The average high in Bellingham is 57.9° and the average low is 42.7°.
Bellingham SnackAbility
Overall SnackAbility
Bellingham, WA Crime Report
Crime in Bellingham summary. We use data from the FBI to determine the crime rates in Bellingham. Key points include:
There were 3,931 total crimes in Bellingham in the last reporting year.
The overall crime rate per 100,000 people in Bellingham is 4,106.9 / 100k people.
The violent crime rate per 100,000 people in Bellingham is 350.0 / 100k people.
The property crime rate per 100,000 people in Bellingham is 3,756.9 / 100k people.
Overall, crime in Bellingham is 93.79% above the national average.
Total Crimes
Above National Average
Crime In Bellingham Comparison Table
| Statistic | Count Raw |
Bellingham / 100k People |
Washington / 100k People |
National / 100k People |
|---|---|---|---|---|
| Total Crimes Per 100K | 3,931 | 4,106.9 | 2,792.6 | 2,119.2 |
| Violent Crime | 335 | 350.0 | 326.1 | 359.0 |
| Murder | 2 | 2.1 | 3.8 | 5.0 |
| Robbery | 74 | 77.3 | 67.5 | 61.0 |
| Aggravated Assault | 239 | 249.7 | 217.0 | 256.0 |
| Property Crime | 3,596 | 3,756.9 | 2,466.5 | 1,760.0 |
| Burglary | 470 | 491.0 | 398.8 | 229.0 |
| Larceny | 2,980 | 3,113.3 | 1,634.2 | 1,272.0 |
| Car Theft | 146 | 152.5 | 433.5 | 259.0 |
Bellingham, WA Cost Of Living
Cost of living in Bellingham summary. We use data on the cost of living to determine how expensive it is to live in Bellingham. Real estate prices drive most of the variance in cost of living around Washington. Key points include:
The cost of living in Bellingham is 136 with 100 being average.
The cost of living in Bellingham is 1.4x higher than the national average.
The median home value in Bellingham is $664,946.
The median income in Bellingham is $65,821.
Bellingham's Overall Cost Of Living
Higher Than The National Average
Cost Of Living In Bellingham Comparison Table
| Living Expense | Bellingham | Washington | National Average | |
|---|---|---|---|---|
| Overall | 136 | 118 | 100 | |
| Services | 123 | 111 | 100 | |
| Groceries | 110 | 112 | 100 | |
| Health | 118 | 122 | 100 | |
| Housing | 192 | 135 | 100 | |
| Transportation | 124 | 124 | 100 | |
| Utilities | 93 | 91 | 100 | |
Bellingham, WA Weather
The average high in Bellingham is 57.9° and the average low is 42.7°.
There are 95.5 days of precipitation each year.
Expect an average of 41.7 inches of precipitation each year with 6.5 inches of snow.
| Stat | Bellingham |
|---|---|
| Average Annual High | 57.9 |
| Average Annual Low | 42.7 |
| Annual Precipitation Days | 95.5 |
| Average Annual Precipitation | 41.7 |
| Average Annual Snowfall | 6.5 |
Average High
Days of Rain
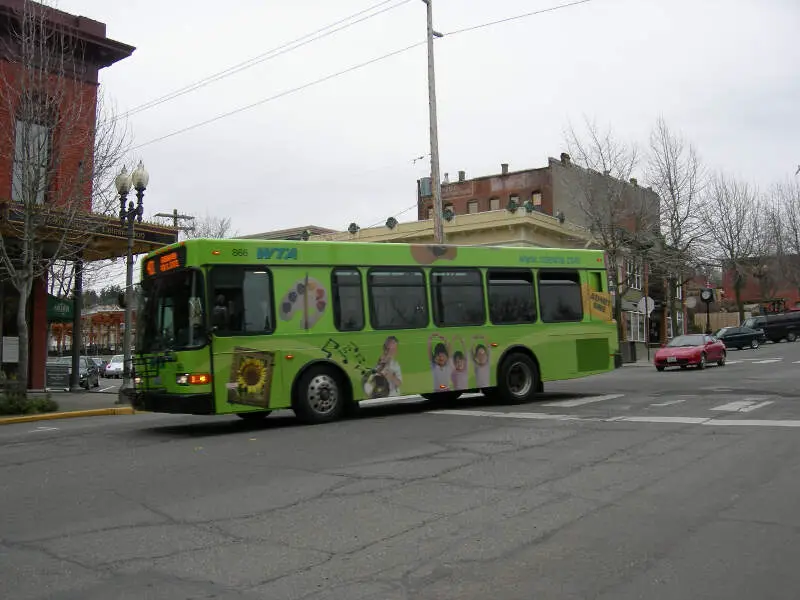
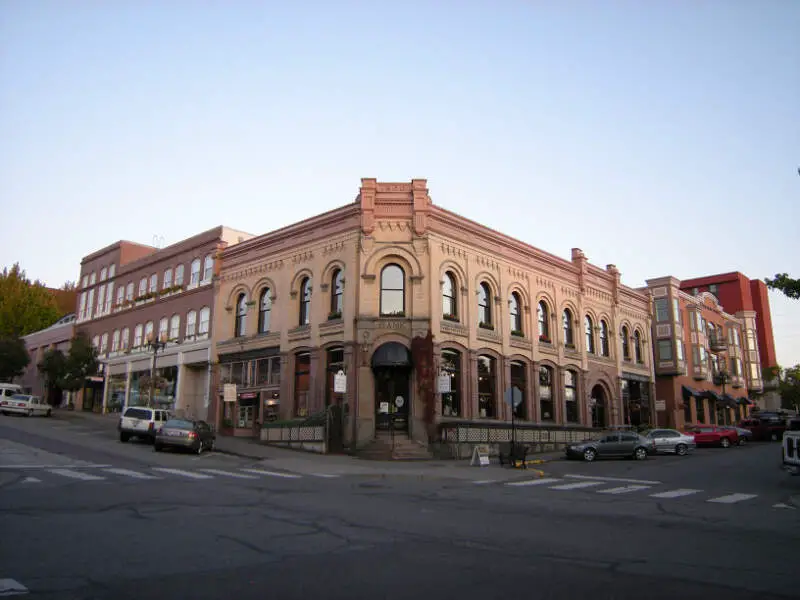
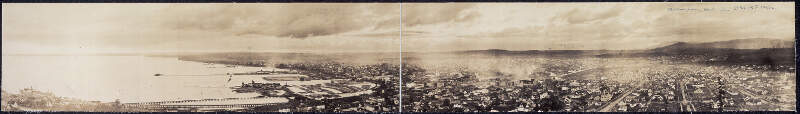
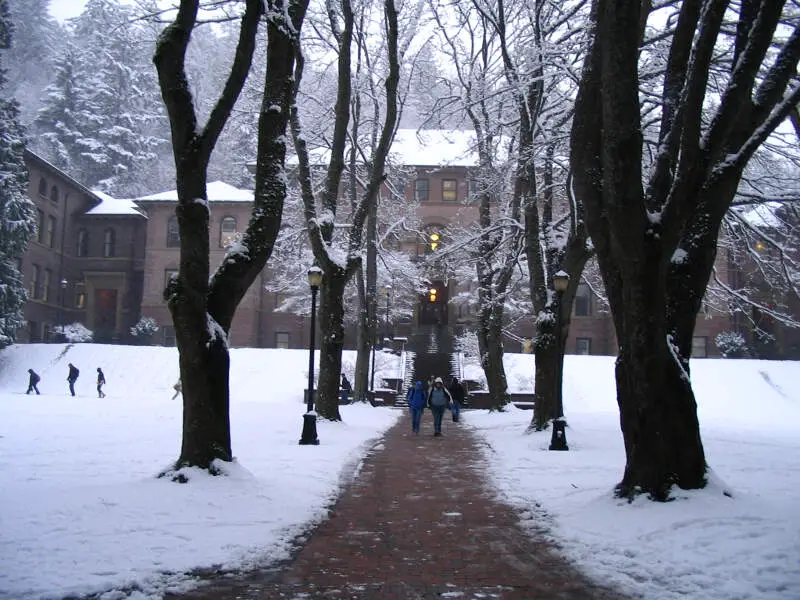
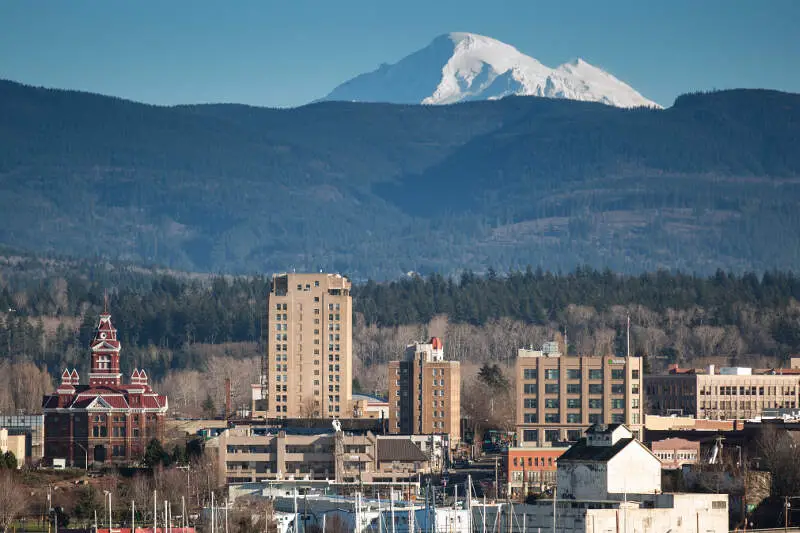
Bellingham, WA Photos


1 Reviews & Comments About Bellingham
/5

HomeSnacks User - 2018-09-06 00:48:49.606227
EVERYTHING IS PRETTY SAFE. ALMOST EVERYONE IS FRIENDLY, NOT ALL OF THEM THOUGH. THE TRAFFIC IS OK. THE WEATHER IS PRETTY COLD COMPARED TO OTHER PLACES. IT'S NICE AND COOL RIGHT NOW WHICH IS SUPER COMFORTABLE
IT DOESN'T HAVE THAT MUCH PLACE TO GO. IT'S KINDA BORING COMPARED TO BIG CITIES. I THINK THAT IS WHY IT'S PRETTY QUIET AND NICE AND SAFE. IT'S NOT COMPLICATED COMPARED TO BIG CITIES. THAT IS A REASON WHY I LOVE BELLINGHAM
Rankings for Bellingham in Washington


Locations Around Bellingham
Map Of Bellingham, WA
Best Places Around Bellingham
Anacortes, WA
Population 17,837
Birch Bay, WA
Population 11,103
Sedro-Woolley, WA
Population 12,633
Sudden Valley, WA
Population 6,963
Ferndale, WA
Population 15,447
Lynden, WA
Population 16,025
Bellingham Demographics And Statistics
Population over time in Bellingham
The current population in Bellingham is 92,367. The population has increased 16.9% from 2010.
| Year | Population | % Change |
|---|---|---|
| 2023 | 92,367 | 1.1% |
| 2022 | 91,353 | 0.9% |
| 2021 | 90,545 | -0.3% |
| 2020 | 90,821 | 2.3% |
| 2019 | 88,764 | 1.9% |
| 2018 | 87,071 | 2.0% |
| 2017 | 85,388 | 1.1% |
| 2016 | 84,462 | 1.8% |
| 2015 | 82,944 | 1.1% |
| 2014 | 82,080 | 0.6% |
| 2013 | 81,576 | 0.8% |
| 2012 | 80,930 | 1.0% |
| 2011 | 80,095 | 1.4% |
| 2010 | 78,989 | - |
Race / Ethnicity in Bellingham
Bellingham is:
76.3% White with 70,451 White residents.
1.2% African American with 1,128 African American residents.
0.7% American Indian with 681 American Indian residents.
5.4% Asian with 4,995 Asian residents.
0.2% Hawaiian with 142 Hawaiian residents.
0.2% Other with 229 Other residents.
6.0% Two Or More with 5,532 Two Or More residents.
10.0% Hispanic with 9,209 Hispanic residents.
| Race | Bellingham | WA | USA |
|---|---|---|---|
| White | 76.3% | 64.3% | 58.2% |
| African American | 1.2% | 3.8% | 12.0% |
| American Indian | 0.7% | 0.8% | 0.5% |
| Asian | 5.4% | 9.3% | 5.7% |
| Hawaiian | 0.2% | 0.7% | 0.2% |
| Other | 0.2% | 0.5% | 0.5% |
| Two Or More | 6.0% | 6.5% | 3.9% |
| Hispanic | 10.0% | 14.1% | 19.0% |
Gender in Bellingham
Bellingham is 51.4% female with 47,519 female residents.
Bellingham is 48.6% male with 44,848 male residents.
| Gender | Bellingham | WA | USA |
|---|---|---|---|
| Female | 51.4% | 49.6% | 50.5% |
| Male | 48.6% | 50.4% | 49.5% |
Highest level of educational attainment in Bellingham for adults over 25
1.0% of adults in Bellingham completed < 9th grade.
3.0% of adults in Bellingham completed 9-12th grade.
17.0% of adults in Bellingham completed high school / ged.
21.0% of adults in Bellingham completed some college.
11.0% of adults in Bellingham completed associate's degree.
27.0% of adults in Bellingham completed bachelor's degree.
13.0% of adults in Bellingham completed master's degree.
3.0% of adults in Bellingham completed professional degree.
4.0% of adults in Bellingham completed doctorate degree.
| Education | Bellingham | WA | USA |
|---|---|---|---|
| < 9th Grade | 1.0% | 3.0% | 5.0% |
| 9-12th Grade | 3.0% | 4.0% | 6.0% |
| High School / GED | 17.0% | 22.0% | 26.0% |
| Some College | 21.0% | 22.0% | 19.0% |
| Associate's Degree | 11.0% | 10.0% | 9.0% |
| Bachelor's Degree | 27.0% | 24.0% | 21.0% |
| Master's Degree | 13.0% | 11.0% | 10.0% |
| Professional Degree | 3.0% | 2.0% | 2.0% |
| Doctorate Degree | 4.0% | 2.0% | 2.0% |
Household Income For Bellingham, Washington
6.2% of households in Bellingham earn Less than $10,000.
4.8% of households in Bellingham earn $10,000 to $14,999.
7.7% of households in Bellingham earn $15,000 to $24,999.
6.4% of households in Bellingham earn $25,000 to $34,999.
12.3% of households in Bellingham earn $35,000 to $49,999.
18.7% of households in Bellingham earn $50,000 to $74,999.
10.8% of households in Bellingham earn $75,000 to $99,999.
16.4% of households in Bellingham earn $100,000 to $149,999.
7.3% of households in Bellingham earn $150,000 to $199,999.
9.4% of households in Bellingham earn $200,000 or more.
| Income | Bellingham | WA | USA |
|---|---|---|---|
| Less than $10,000 | 6.2% | 3.8% | 4.9% |
| $10,000 to $14,999 | 4.8% | 2.7% | 3.6% |
| $15,000 to $24,999 | 7.7% | 4.9% | 6.6% |
| $25,000 to $34,999 | 6.4% | 5.3% | 6.8% |
| $35,000 to $49,999 | 12.3% | 8.6% | 10.4% |
| $50,000 to $74,999 | 18.7% | 14.6% | 15.7% |
| $75,000 to $99,999 | 10.8% | 12.6% | 12.7% |
| $100,000 to $149,999 | 16.4% | 19.2% | 17.4% |
| $150,000 to $199,999 | 7.3% | 11.3% | 9.3% |
| $200,000 or more | 9.4% | 17.2% | 12.6% |


