Tacoma SnackAbility
Overall SnackAbility
Crime in Tacoma summary. We use data from the FBI to determine the crime rates in Tacoma. Key points include:
There were 14,932 total crimes in Tacoma in the last reporting year.
The overall crime rate per 100,000 people in Tacoma is 6,666.7 / 100k people.
The violent crime rate per 100,000 people in Tacoma is 1,063.0 / 100k people.
The property crime rate per 100,000 people in Tacoma is 5,603.6 / 100k people.
Overall, crime in Tacoma is 214.58% above the national average.
Total Crimes
Above National Average
Crime In Tacoma Comparison Table
| Statistic | Count Raw |
Tacoma / 100k People |
Washington / 100k People |
National / 100k People |
|---|---|---|---|---|
| Total Crimes Per 100K | 14,932 | 6,666.7 | 2,792.6 | 2,119.2 |
| Violent Crime | 2,381 | 1,063.0 | 326.1 | 359.0 |
| Murder | 22 | 9.8 | 3.8 | 5.0 |
| Robbery | 413 | 184.4 | 67.5 | 61.0 |
| Aggravated Assault | 1,794 | 801.0 | 217.0 | 256.0 |
| Property Crime | 12,551 | 5,603.6 | 2,466.5 | 1,760.0 |
| Burglary | 1,500 | 669.7 | 398.8 | 229.0 |
| Larceny | 7,887 | 3,521.3 | 1,634.2 | 1,272.0 |
| Car Theft | 3,164 | 1,412.6 | 433.5 | 259.0 |
Source: FBI Uniform Crime Reporting (2024)
Cost of living in Tacoma summary. We use data on the cost of living to determine how expensive it is to live in Tacoma. Real estate prices drive most of the variance in cost of living around Washington. Key points include:
The cost of living in Tacoma is 126 with 100 being average.
The cost of living in Tacoma is 1.3x higher than the national average.
The median home value in Tacoma is $493,839.
The median income in Tacoma is $85,884.
Tacoma's Overall Cost Of Living
Higher Than The National Average
Cost Of Living In Tacoma Comparison Table
| Living Expense | Tacoma | Washington | National Average |
|---|---|---|---|
| Overall | 126 | 120 | 100 |
| Services | 105 | 108 | 100 |
| Groceries | 109 | 108 | 100 |
| Health | 158 | 137 | 100 |
| Housing | 118 | 111 | 100 |
| Transportation | 111 | 111 | 100 |
| Utilities | 113 | 110 | 100 |
Source: Cost of living index, normalized to US average = 100
Tacoma, WA Weather
The average high in Tacoma is 60.0° and the average low is 43.1°.
There are 95.1 days of precipitation each year.
Expect an average of 40.3 inches of precipitation each year with 3.9 inches of snow.
| Stat | Tacoma |
|---|---|
| Average Annual High | 60.0 |
| Average Annual Low | 43.1 |
| Annual Precipitation Days | 95.1 |
| Average Annual Precipitation | 40.3 |
| Average Annual Snowfall | 3.9 |
Average High
Days of Rain
Source: NOAA climate normals (30-year)
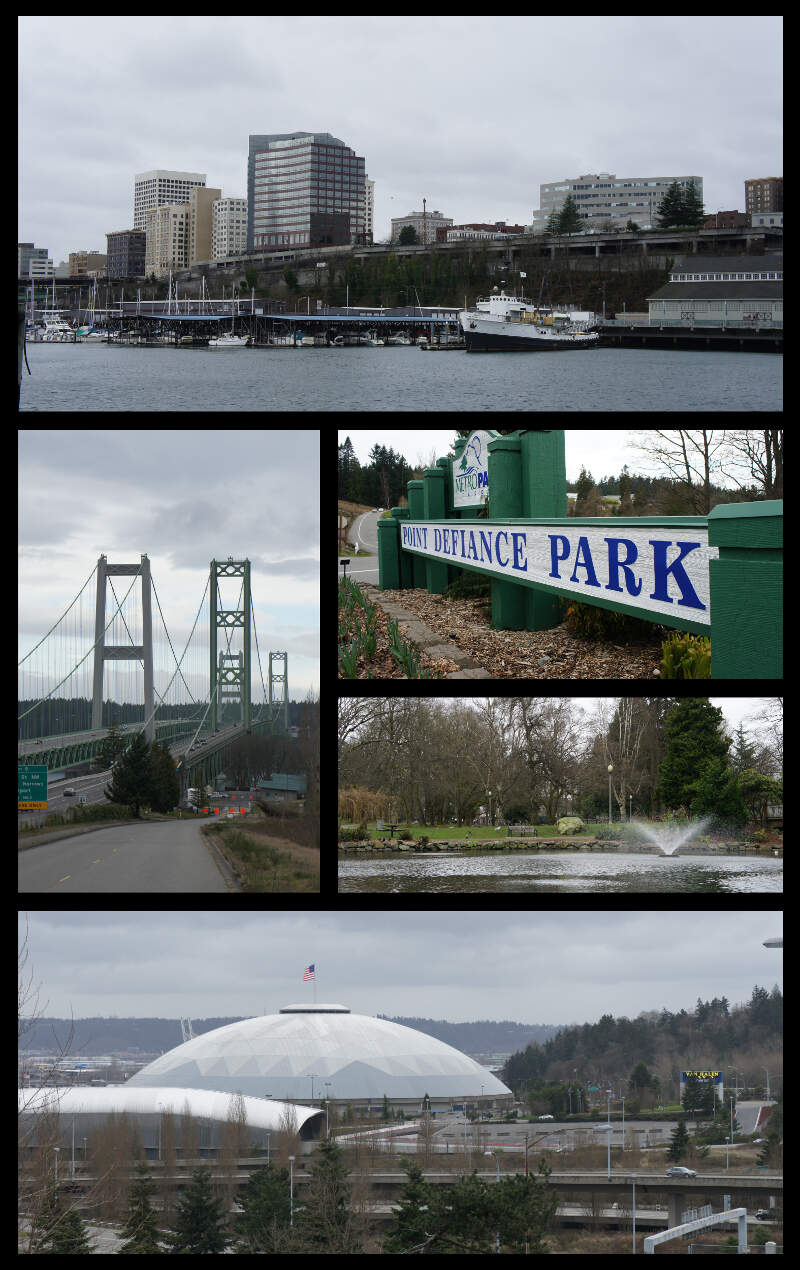
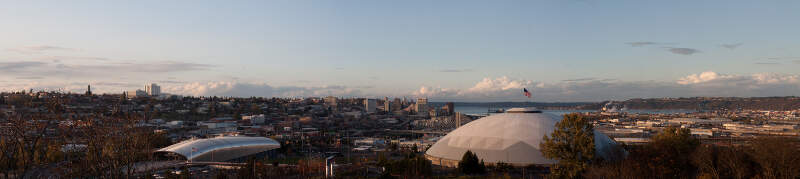
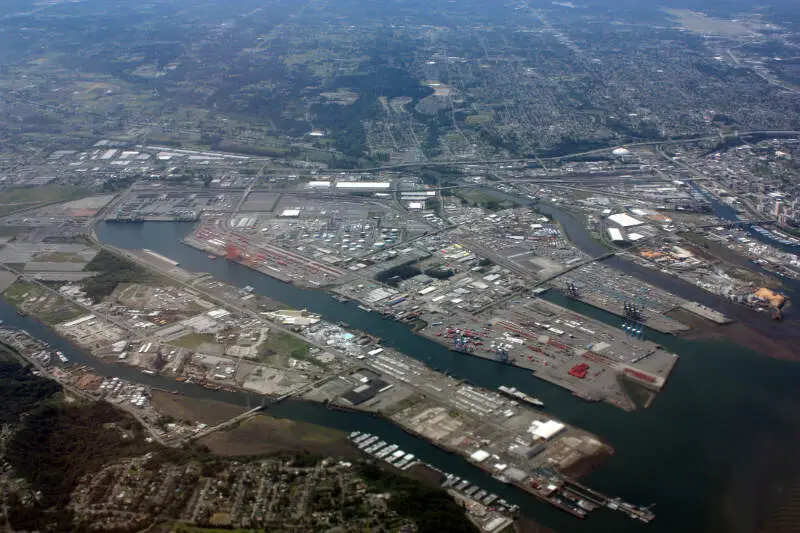
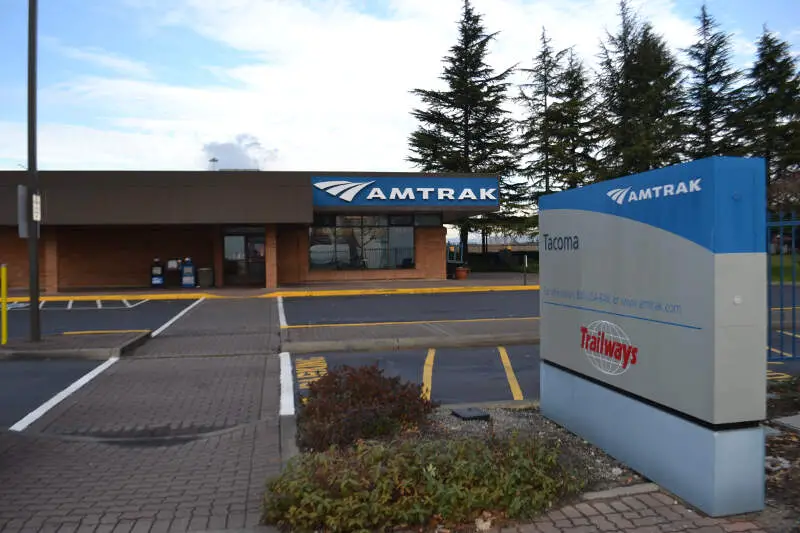
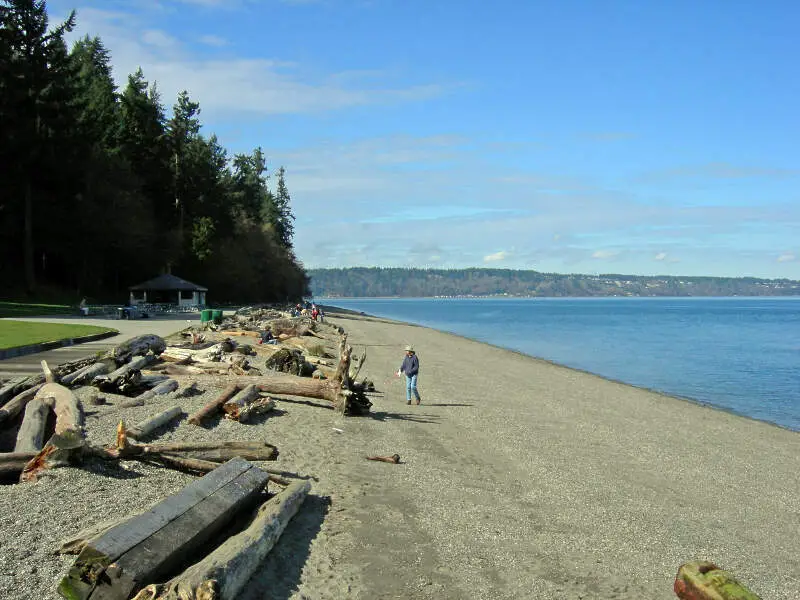
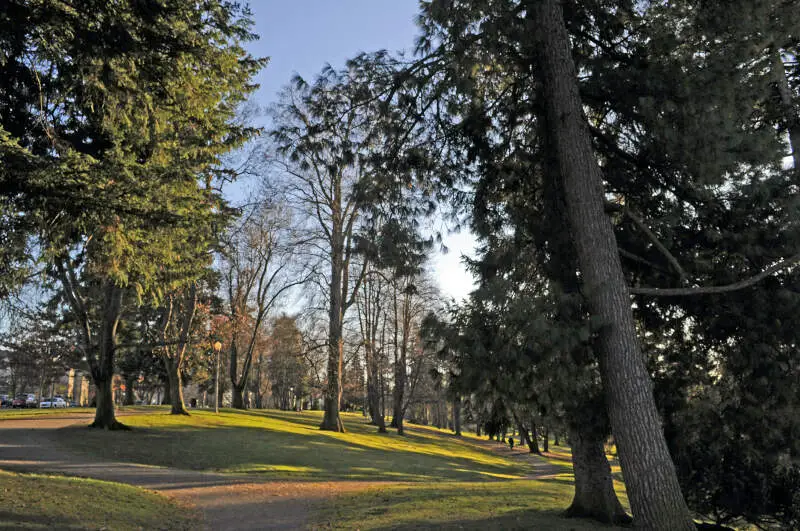
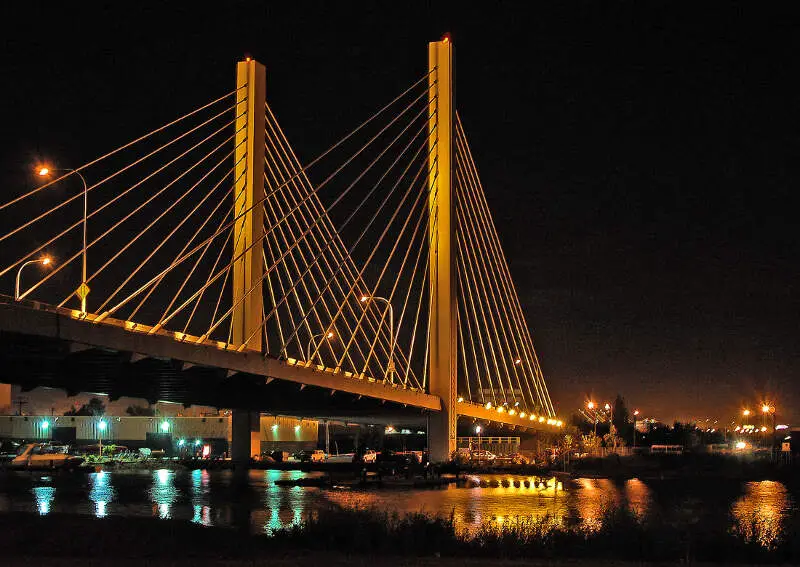
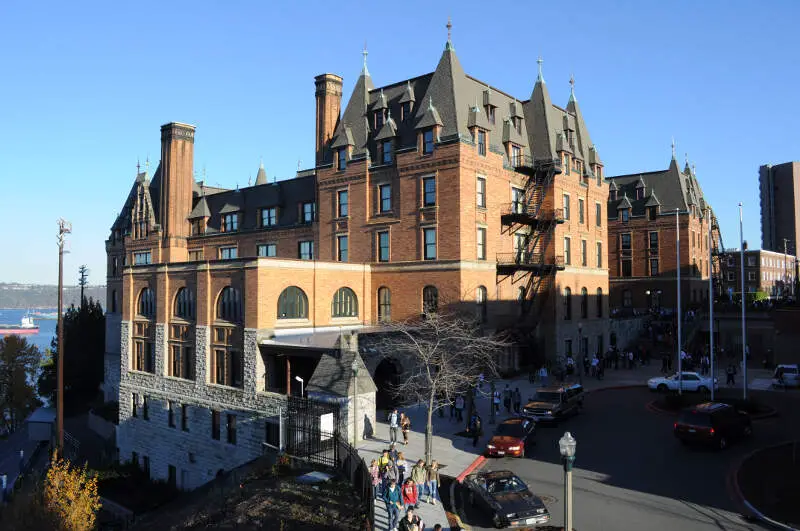
Tacoma, WA Photos

14 Reviews & Comments About Tacoma

Tacoma resident here! Lived here my whole life, and I had lived in the more poverty struck areas as a kid, I remember everyday on the way to elementary school I passed these s****y connected houses that had their front doors missing and spray paint anarchy symbols inside if you looked, sometimes I'd hear a drummer and a base playing inside one, some of them were boarded up, others were broken into and lived in by druggies and homeless people, The homeless people were nice to me, they said high everyday I passed and were genuinely very sweet people just on tough times.
The education is pretty awful, and the safety of ours schools too, Foss, when I was going, had 7 bomb threats, and 6 shooting threats, from a f*****g death cult trying to use us for some mass murder ritual, it was f*****g nuts and the school refused to say anything about it but a few teachers did. I remember in elementary school there was a big thing about a man who killed 5 cops was on the loose and the man ended up being chased near our elementary school and we had lock down and there was gun fire, but I'm pretty sure they ended up getting a hold of him and apprehending him.
DESPITE THAT and plenty more stories I have, it's really not that bad, things are starting to chill out in this city, and me and my family now live in a better area of Tacoma, and it's nice, I don't think I'd ever choose any other place over my hometown.
Most of Tacoma doesn't look like that. The areas that did are pretty much being razed and rebuilt. University of Washington Tacoma and several new apartment buildings sit on many of those spaces now.
I've lived many places in my life and always seem to keep coming back to Tacoma. My current stint in Tacoma has been for 32 years. What does Tacoma have- Decent schools, a preponderance of good usable public parks, easy access to public services, good public transportation system, walk-ability, trees everywhere including downtown, easy access to nature and outdoor activities, wonderful mountain views and an increasing amount of museums and public art... all at half the cost and hassle of our larger neighbor to the north.
I never cared for Tacoma. I was born there and would never live there. But I would never live in any city no matter there crime rate, Murder and Robberies they have. I can not stand the City and would never raise my children in the city. Love the foot hills of Mt Rainier. That is my kind of living. i think every city has its up and downs. Never had any problems in Chehalis. When I go to the city it is for a very fast pick up and I pack my Gun. I do not trust anyone. I trust my Coyotes more then the City people. So I say if you want to live a good life live in the Foot hills or the Olympic Mountains where you are safe.
You've clealry never been to most of these places. Port Orchard is nice and not heavy with crime. White Center is a shithole, Lakewood has very high end areas but also has s****y areas, Aberdeen is druggie central. And Tacoma is not the worst. White Center is farrrrr worse. I live in Tacoma. Unless you're on the eastside or parts of the Sputh you're fine. The West end of Tacoma is now University Place which is high end water views. The North end is the same with high end water views. Clearly you just looked up a bunch of statistics and try to make a video so you can get Revenue. Long story short, you don't know what you're talking about unless you've actually been and lived in these places.
Ay I live in Tacoma and I swear it's not that bad you won't get jumped for nothing but we have two different sides down town and New Tacoma ones good ones hella messed up
I live in University Place which is separate from Tacoma. I go to a Catholic school in Lakewood and every day there is a murder in the news and we had 6 lockdowns
I lived in tacoma till someone died at a 7 11 near i lived. 56th orchard
i live in Tacoma and i enjoy it here except the schools which are garbage and when i go to seattle there is so many homeless people so much loitering there.
I live in Tacoma I grew up in Tacoma.... And yes in my eyes it sure is making a turn around. I live in one of the worse parts of Tacoma.
Welp I live in Tacoma...Hilltop Tacoma so I have the worst city...
i live in Tacoma, and it really isn't that bad imo
Lots to do and tons of beautiful scenery. The city is generally pretty safe and people are very friendly.
There are lots of good restaurants that are fun to go and check out on weekends. Likewise, there are lots of small craft breweries. I don't really have much bad to say other than the fact that downtown all the stoplight are right at the top of the hills for some reason. It makes it very easy to accidentally roll backwards.
Tacoma has definitely gotten better since the 90's-early 2,000's. But living over here on the eastside, theres still alot of violence you see/hear everyday. including gunshots everynow and then. Its just not like it was growin up back then.
I love the Point Defiance park and everywhere else on the northend of Tacoma. Its beautiful and a great place to take my son. Owens beach is there also. Things to look out for- honestly nothin really anymore if your not associated with any gangs or crimes or walkin by yourself at 11oclock at night. Not sayin its always safe, but you really dont need to be lookin over your shoulder anymore
I have lived in Tacoma for over 25 years now. I moved from Michigan, where I was born and raised. I have never in my life seen or dealt with Rasicm until I moved here. Everything in this State is geared towards the Middle Class and Rich White People!! I only say that because of how high the cost of living has become in this State! Its ridiculous that in Seattle people are being put out of their homes if they don't make a certain amount of Money!! Forced to live on the Streets...and It will not get any better in the near future..not in the TrumpNation!! G*d help us ALL!! !!
Rankings & Articles For Tacoma


Locations Around Tacoma
Map Of Tacoma, WA
Best Places Around Tacoma
Gig Harbor, WA
Population 12,424
Summit View, WA
Population 8,480
Fife, WA
Population 10,949
Parkland, WA
Population 38,742
Midland, WA
Population 9,050
Lakewood, WA
Population 62,937
Sumner, WA
Population 10,733
Wollochet, WA
Population 6,689
Puyallup, WA
Population 42,746
Frederickson, WA
Population 25,383
Tacoma Demographics And Statistics
Population over time in Tacoma
The current population in Tacoma is 222,758. The population has increased 12.0% from 2010.
| Year | Population | % Change |
|---|---|---|
| 2024 | 222,758 | 1.0% |
| 2023 | 220,482 | 0.6% |
| 2022 | 219,234 | 0.9% |
| 2021 | 217,332 | 0.7% |
| 2020 | 215,766 | 1.4% |
| 2019 | 212,869 | 1.3% |
| 2018 | 210,103 | 1.4% |
| 2017 | 207,280 | 0.8% |
| 2016 | 205,602 | 1.0% |
| 2015 | 203,481 | 0.8% |
| 2014 | 201,794 | 0.4% |
| 2013 | 200,890 | 0.4% |
| 2012 | 200,013 | 0.3% |
| 2011 | 199,449 | 0.3% |
| 2010 | 198,819 | - |
Race / Ethnicity in Tacoma
See the full breakdown
Tacoma is:
55.6% White with 123,755 White residents.
9.3% African American with 20,698 African American residents.
0.8% American Indian with 1,789 American Indian residents.
9.4% Asian with 20,938 Asian residents.
0.9% Hawaiian with 2,007 Hawaiian residents.
0.6% Other with 1,280 Other residents.
9.6% Two Or More with 21,457 Two Or More residents.
13.8% Hispanic with 30,834 Hispanic residents.
| Race | Tacoma | WA | USA |
|---|---|---|---|
| White | 55.6% | 63.1% | 57.4% |
| African American | 9.3% | 3.8% | 11.9% |
| American Indian | 0.8% | 0.8% | 0.5% |
| Asian | 9.4% | 9.7% | 5.9% |
| Hawaiian | 0.9% | 0.7% | 0.2% |
| Other | 0.6% | 0.6% | 0.6% |
| Two Or More | 9.6% | 6.8% | 4.3% |
| Hispanic | 13.8% | 14.4% | 19.3% |
Gender in Tacoma
See the full breakdown
Tacoma is 50.5% female with 112,430 female residents.
Tacoma is 49.5% male with 110,328 male residents.
| Gender | Tacoma | WA | USA |
|---|---|---|---|
| Female | 50.5% | 49.6% | 50.5% |
| Male | 49.5% | 50.4% | 49.5% |
Highest level of educational attainment in Tacoma for adults over 25
See the full breakdown
4.0% of adults in Tacoma completed < 9th grade.
5.0% of adults in Tacoma completed 9-12th grade.
25.0% of adults in Tacoma completed high school / ged.
22.0% of adults in Tacoma completed some college.
10.0% of adults in Tacoma completed associate's degree.
21.0% of adults in Tacoma completed bachelor's degree.
9.0% of adults in Tacoma completed master's degree.
3.0% of adults in Tacoma completed professional degree.
1.0% of adults in Tacoma completed doctorate degree.
| Education | Tacoma | WA | USA |
|---|---|---|---|
| < 9th Grade | 4.0% | 4.0% | 4.0% |
| 9-12th Grade | 5.0% | 4.0% | 6.0% |
| High School / GED | 25.0% | 22.0% | 26.0% |
| Some College | 22.0% | 21.0% | 19.0% |
| Associate's Degree | 10.0% | 10.0% | 9.0% |
| Bachelor's Degree | 21.0% | 24.0% | 22.0% |
| Master's Degree | 9.0% | 11.0% | 10.0% |
| Professional Degree | 3.0% | 2.0% | 2.0% |
| Doctorate Degree | 1.0% | 2.0% | 2.0% |
Household Income For Tacoma, Washington
See the full breakdown
4.9% of households in Tacoma earn Less than $10,000.
3.3% of households in Tacoma earn $10,000 to $14,999.
5.7% of households in Tacoma earn $15,000 to $24,999.
4.7% of households in Tacoma earn $25,000 to $34,999.
9.1% of households in Tacoma earn $35,000 to $49,999.
16.1% of households in Tacoma earn $50,000 to $74,999.
13.3% of households in Tacoma earn $75,000 to $99,999.
19.6% of households in Tacoma earn $100,000 to $149,999.
11.5% of households in Tacoma earn $150,000 to $199,999.
11.6% of households in Tacoma earn $200,000 or more.
| Income | Tacoma | WA | USA |
|---|---|---|---|
| Less than $10,000 | 4.9% | 3.9% | 5.0% |
| $10,000 to $14,999 | 3.3% | 2.5% | 3.4% |
| $15,000 to $24,999 | 5.7% | 4.6% | 6.3% |
| $25,000 to $34,999 | 4.7% | 5.0% | 6.6% |
| $35,000 to $49,999 | 9.1% | 8.2% | 10.1% |
| $50,000 to $74,999 | 16.1% | 14.1% | 15.5% |
| $75,000 to $99,999 | 13.3% | 12.4% | 12.6% |
| $100,000 to $149,999 | 19.6% | 19.2% | 17.5% |
| $150,000 to $199,999 | 11.5% | 11.4% | 9.6% |
| $200,000 or more | 11.6% | 18.5% | 13.4% |
Source: U.S. Census ACS 5-year estimates (2024)


