Whitest cities in Connecticut research summary. We analyzed Connecticut’s most recent Census data to determine the whitest cities in Connecticut based on the percentage of White residents.
85.1% White · #1 whitest in Connecticut
Portland is a town in Middlesex County, Connecticut, United States. The population was 8,732 at the 2000 census. The town center is listed as a census-designated place. It is situated across the Connecticut River from Middletown. Brownstone quarried in Portland was used in the construction of Hartford’s Old State House in 1796. The vast majority of the brownstone buildings in Connecticut as well as the famous brownstones in New York City were built with brownstone from Portland’s quarries.
Data | Crime | Cost of living | Movers
83.9% White · #2 whitest in Connecticut
Data | Crime | Cost of living | Movers
83.9% White · #3 whitest in Connecticut
Data | Crime | Cost of living | Movers
83.6% White · #4 whitest in Connecticut
Data | Crime | Cost of living | Movers
83.4% White · #5 whitest in Connecticut
Data | Crime | Cost of living | Movers
83.2% White · #6 whitest in Connecticut
Data | Crime | Cost of living | Movers
82.7% White · #7 whitest in Connecticut
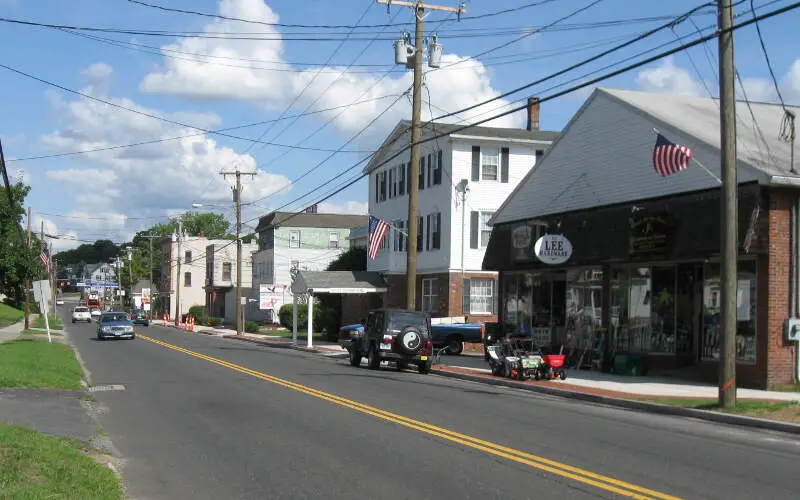
Putnam is a town in Windham County, Connecticut, United States. The population was 9,584 at the 2010 census. It is home to WINY, an AM radio station.
Data | Crime | Cost of living | Movers
82.1% White · #8 whitest in Connecticut
Winsted is a census-designated place and an incorporated city in Litchfield County, Connecticut, United States. It is part of the town of Winchester, Connecticut. The population was 7,321 at the 2000 census.
Data | Crime | Cost of living | Movers
81.9% White · #9 whitest in Connecticut
Data | Crime | Cost of living | Movers
81.4% White · #10 whitest in Connecticut
Data | Crime | Cost of living | Movers
The receipts
Compare the top ten
Pick a metric. The bars rescale. The red line is Connecticut’s statewide median.
On the map
Where Connecticut’s White population is concentrated
Saturday Night Science
Methodology: How we determined the whitest places in Connecticut for 2026
To rank the whitest places in Connecticut, we used Saturday Night Science to look at Census demographic data.
We had to look at the number of white people living in each city in Connecticut on a per capita basis. In other words, the percentage of white people living in each city in Connecticut.
We looked at table B03002: Hispanic OR LATINO ORIGIN BY RACE. Here are the category names as defined by the Census:
- Hispanic or Latino
- White alone*
- Black or African American alone*
- American Indian and Alaska Native alone*
- Asian alone*
- Native Hawaiian and Other Pacific Islander alone*
- Some other race alone*
- Two or more races*
Our particular column of interest here was the number of people who identified as White alone.
We limited our analysis to places with a population greater than 5,000 people. That left us with 55 cities.
We then calculated the percentage of residents that are White. The percentages ranked from 85.1% to 15.1%.
Finally, we ranked each city based on the percentage of the White population, with a higher percentage being more White. Portland took the distinction of being the most White, while Hartford was the least White city.
We updated this article for 2026. This report represents our eleventh time ranking the whitest cities in Connecticut.
The full plate
Cities In Connecticut By White Population
Click any column to sort. Search by city name.
| Rank | City | Population | White Population | % White |
|---|---|---|---|---|
| 1 | Portland | 5,944 | 5,057 | 85.1% |
| 2 | Simsbury Center | 6,198 | 5,202 | 83.9% |
| 3 | Southwood Acres | 8,115 | 6,805 | 83.9% |
| 4 | Terryville | 5,461 | 4,565 | 83.6% |
| 5 | Glastonbury Center | 7,266 | 6,059 | 83.4% |
| 6 | Branford Center | 6,305 | 5,243 | 83.2% |
| 7 | Putnam | 7,120 | 5,890 | 82.7% |
| 8 | Winsted | 6,977 | 5,729 | 82.1% |
| 9 | Pawcatuck | 5,577 | 4,566 | 81.9% |
| 10 | Kensington | 9,962 | 8,111 | 81.4% |
| 11 | Ridgefield | 6,970 | 5,668 | 81.3% |
| 12 | Oakville | 9,276 | 7,486 | 80.7% |
| 13 | Milford | 51,023 | 40,898 | 80.2% |
| 14 | Cheshire Village | 6,172 | 4,918 | 79.7% |
| 15 | Orange | 14,315 | 11,393 | 79.6% |
| 16 | Sherwood Manor | 5,706 | 4,448 | 78.0% |
| 17 | North Haven | 24,336 | 18,624 | 76.5% |
| 18 | Old Greenwich | 6,936 | 5,305 | 76.5% |
| 19 | Wethersfield | 27,250 | 20,385 | 74.8% |
| 20 | Newington | 30,896 | 22,221 | 71.9% |
| 21 | New Milford | 8,188 | 5,854 | 71.5% |
| 22 | Windsor Locks | 12,579 | 8,847 | 70.3% |
| 23 | Torrington | 35,547 | 24,822 | 69.8% |
| 24 | Wallingford Center | 18,208 | 12,601 | 69.2% |
| 25 | East Haven | 27,806 | 19,214 | 69.1% |
| 26 | Groton | 9,490 | 6,362 | 67.0% |
| 27 | West Hartford | 63,620 | 42,650 | 67.0% |
| 28 | Shelton | 41,889 | 27,919 | 66.6% |
| 29 | Cos Cob | 7,546 | 4,863 | 64.4% |
| 30 | Greenwich | 14,792 | 9,381 | 63.4% |
| 31 | Middletown | 47,958 | 30,069 | 62.7% |
| 32 | Riverside | 8,954 | 5,542 | 61.9% |
| 33 | Bristol | 61,462 | 38,005 | 61.8% |
| 34 | Thompsonville | 7,927 | 4,872 | 61.5% |
| 35 | Storrs | 15,207 | 9,327 | 61.3% |
| 36 | Rockville | 7,072 | 4,269 | 60.4% |
| 37 | Naugatuck | 31,800 | 19,149 | 60.2% |
| 38 | Bethel | 11,404 | 6,733 | 59.0% |
| 39 | Derby | 12,487 | 7,193 | 57.6% |
| 40 | Norwich | 39,973 | 22,000 | 55.0% |
| 41 | Ansonia | 19,033 | 10,009 | 52.6% |
| 42 | Manchester | 36,759 | 19,084 | 51.9% |
| 43 | Meriden | 60,545 | 28,845 | 47.6% |
| 44 | New London | 27,625 | 12,266 | 44.4% |
| 45 | West Haven | 55,351 | 24,086 | 43.5% |
| 46 | Stamford | 137,144 | 59,210 | 43.2% |
| 47 | Norwalk | 92,187 | 39,387 | 42.7% |
| 48 | Willimantic | 18,096 | 7,566 | 41.8% |
| 49 | New Britain | 74,223 | 29,922 | 40.3% |
| 50 | Danbury | 87,263 | 35,032 | 40.1% |
| 51 | New Haven | 134,349 | 40,362 | 30.0% |
| 52 | East Hartford | 50,918 | 15,049 | 29.6% |
| 53 | Waterbury | 114,869 | 33,693 | 29.3% |
| 54 | Bridgeport | 149,153 | 36,604 | 24.5% |
| 55 | Hartford | 121,127 | 18,272 | 15.1% |
Source: U.S. Census ACS 2020-2024. 55 cities with more than 5,000 residents.
Summary
Summary: White Populations Across Connecticut
We measured the locations with the highest percentage of white people in Connecticut. According to the most recent data, this list provides accurate information on the whitest places in Connecticut.
The most White cities in Connecticut are Portland, Simsbury Center, Southwood Acres, Terryville, Glastonbury Center, Branford Center, Putnam, Winsted, Pawcatuck, and Kensington. Not sold on Connecticut? Take the two-minute Find Your Place quiz and see which state actually fits you.


