Whitest cities in Minnesota research summary. We analyzed Minnesota’s most recent Census data to determine the whitest cities in Minnesota based on the percentage of White residents.
96.0% White · #1 whitest in Minnesota
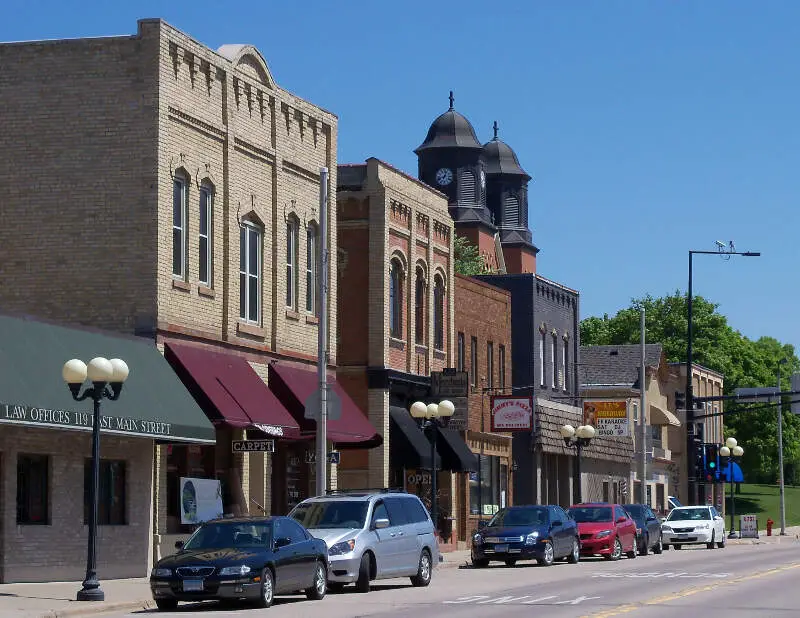
New Prague NEW PRAYG is a city in Scott and Le Sueur counties in the state of Minnesota. The population was 7,321 at the 2010 census.
Data | Crime | Cost of living | Movers
95.3% White · #2 whitest in Minnesota
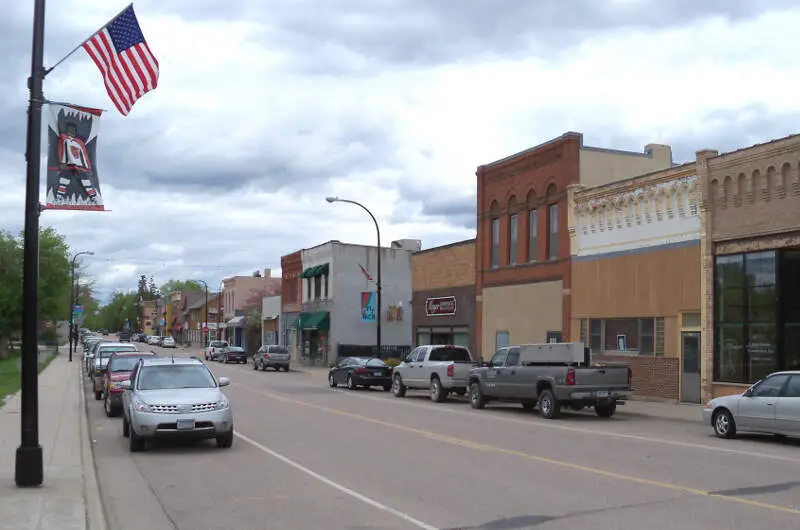
Delano is a city in Wright County, Minnesota, United States. The population was 5,464 at the 2010 census. It is part of the Twin Cities Metropolitan Statistical Area.
Data | Crime | Cost of living | Movers
94.9% White · #3 whitest in Minnesota
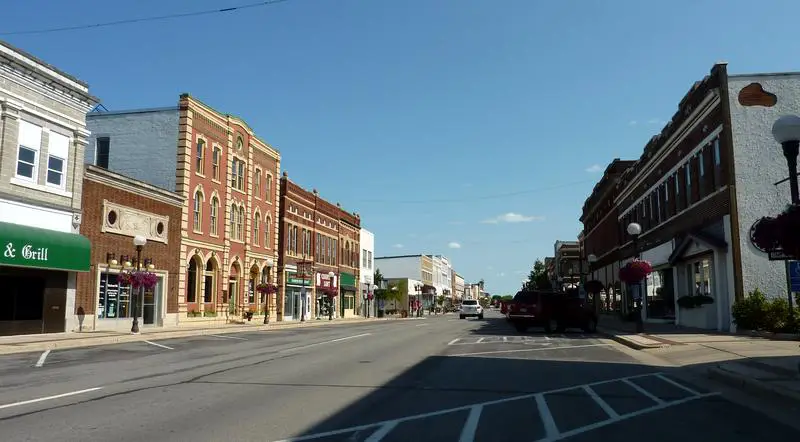
Baxter is a city in Crow Wing County, Minnesota, United States. The population was 7,610 at the 2010 census. It is part of the Brainerd Micropolitan Statistical Area.
Data | Crime | Cost of living | Movers
93.6% White · #4 whitest in Minnesota
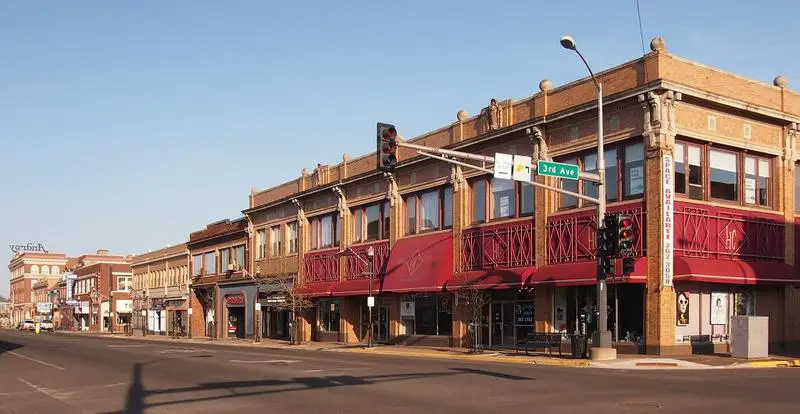
New Ulm is a city in Brown County, Minnesota, United States. The population was 13,522 at the 2010 census. It is the county seat of Brown County.
Data | Crime | Cost of living | Movers
93.3% White · #5 whitest in Minnesota
Hibbing is a city in Saint Louis County, Minnesota, United States. The population was 16,361 at the 2010 census. The city was built on the rich iron ore of the Mesabi Iron Range. At the edge of town is the largest open-pit iron mine in the world, the Hull-Rust-Mahoning Open Pit Iron Mine. U.S. Highway 169, State Highway 37, State Highway 73, Howard Street, and 1st Avenue are five of the main routes in Hibbing. The Range Regional Airport offers daily commercial flights between Hibbing and Minneapolis, as well as hosting many private pilots and the Minnesota Department of Natural Resources fire fighting aircraft.
Data | Crime | Cost of living | Movers
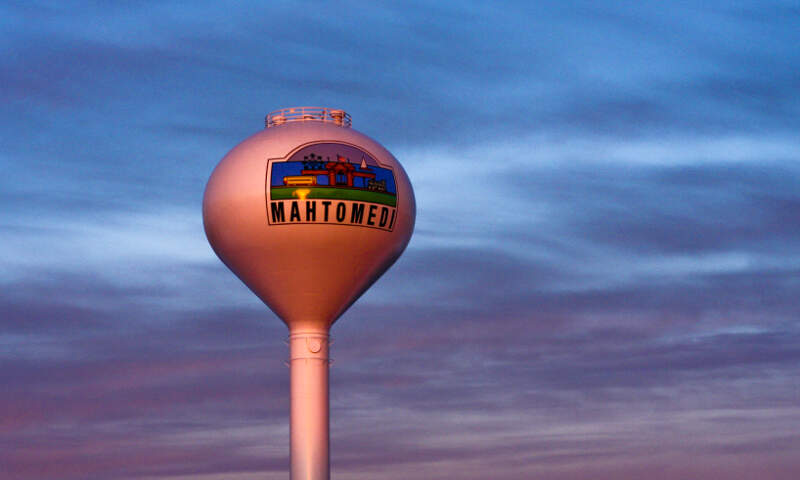
92.9% White · #6 whitest in Minnesota
Mahtomedi is a city in Washington County, Minnesota, United States. The population was 7,676 at the 2010 census. Mahtomedi is considered to be a suburb of St. Paul, and is located between St. Paul and Stillwater.
Data | Crime | Cost of living | Movers
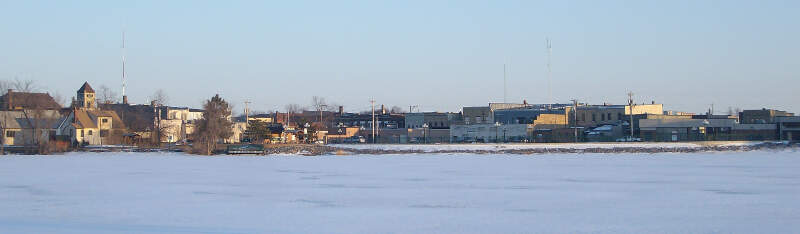
92.6% White · #7 whitest in Minnesota
Lake City is a city in Goodhue and Wabasha counties in the U.S. state of Minnesota. It lies along Lake Pepin, a wide portion of the Mississippi River. The population was 5,063 at the 2010 census. Most of Lake City is located within Wabasha County with only a small portion in Goodhue County.
Data | Crime | Cost of living | Movers
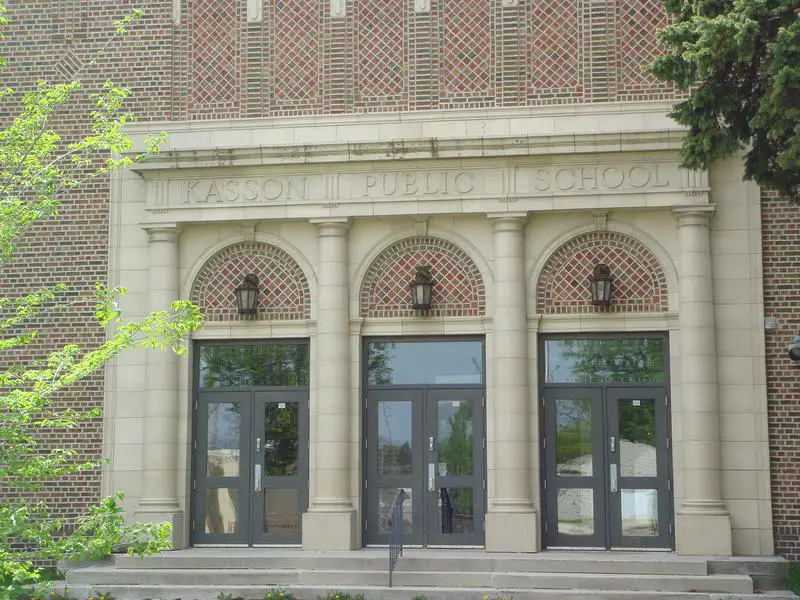
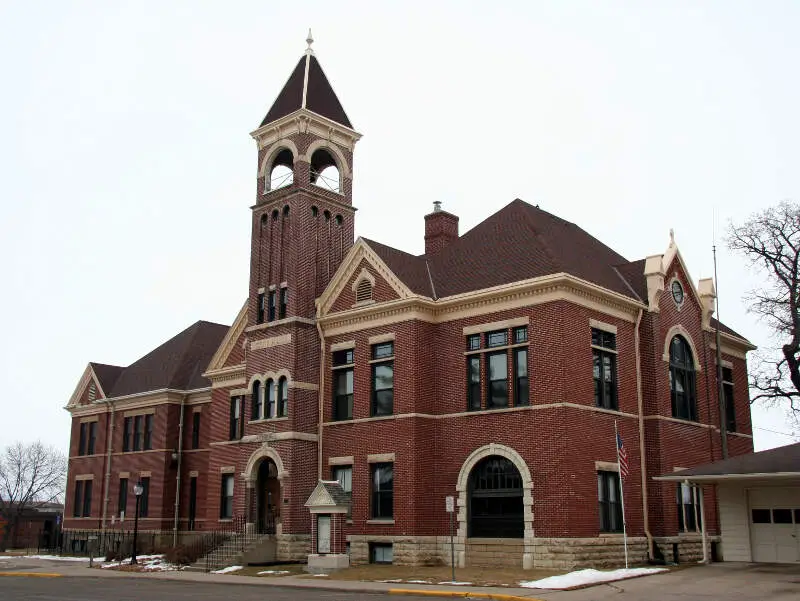
92.4% White · #8 whitest in Minnesota
Kasson is a city in Dodge County, Minnesota, United States. The population was 5,931 at the 2010 census. The city is located 13 miles west of Rochester, Minnesota along U.S. Highway 14 and is one of the endpoints of Minnesota State Highway 57. The Dakota, Minnesota and Eastern Railroad’s main freight rail line also runs through the city. Kasson shares a school system with nearby Mantorville, Minnesota. The K-M school system is a member of the Zumbro Education school district. Kasson is part of the Rochester, MN Metropolitan Statistical Area.
Data | Crime | Cost of living | Movers
92.2% White · #9 whitest in Minnesota
Data | Crime | Cost of living | Movers
92.0% White · #10 whitest in Minnesota
Data | Crime | Cost of living | Movers
The receipts
Compare the top ten
Pick a metric. The bars rescale. The red line is Minnesota’s statewide median.
On the map
Where Minnesota’s White population is concentrated
Saturday Night Science
Methodology: How we determined the whitest places in Minnesota for 2026
To rank the whitest places in Minnesota, we used Saturday Night Science to look at Census demographic data.
We had to look at the number of white people living in each city in Minnesota on a per capita basis. In other words, the percentage of white people living in each city in Minnesota.
We looked at table B03002: Hispanic OR LATINO ORIGIN BY RACE. Here are the category names as defined by the Census:
- Hispanic or Latino
- White alone*
- Black or African American alone*
- American Indian and Alaska Native alone*
- Asian alone*
- Native Hawaiian and Other Pacific Islander alone*
- Some other race alone*
- Two or more races*
Our particular column of interest here was the number of people who identified as White alone.
We limited our analysis to places with a population greater than 5,000 people. That left us with 139 cities.
We then calculated the percentage of residents that are White. The percentages ranked from 96.0% to 30.6%.
Finally, we ranked each city based on the percentage of the White population, with a higher percentage being more White. New Prague took the distinction of being the most White, while Brooklyn Center was the least White city.
We updated this article for 2026. This report represents our eleventh time ranking the whitest cities in Minnesota.
The full plate
Cities In Minnesota By White Population
Click any column to sort. Search by city name.
| Rank | City | Population | White Population | % White |
|---|---|---|---|---|
| 1 | New Prague | 8,237 | 7,907 | 96.0% |
| 2 | Delano | 6,942 | 6,613 | 95.3% |
| 3 | Baxter | 8,966 | 8,507 | 94.9% |
| 4 | New Ulm | 14,056 | 13,150 | 93.6% |
| 5 | Hibbing | 16,057 | 14,981 | 93.3% |
| 6 | Mahtomedi | 8,133 | 7,553 | 92.9% |
| 7 | Lake City | 5,034 | 4,659 | 92.6% |
| 8 | Kasson | 7,050 | 6,515 | 92.4% |
| 9 | Little Falls | 9,121 | 8,412 | 92.2% |
| 10 | Minnetrista | 8,708 | 8,014 | 92.0% |
| 11 | Buffalo | 16,499 | 15,130 | 91.7% |
| 12 | Brainerd | 14,468 | 13,236 | 91.5% |
| 13 | Wyoming | 8,087 | 7,395 | 91.4% |
| 14 | Stewartville | 6,807 | 6,162 | 90.5% |
| 15 | Fergus Falls | 14,181 | 12,837 | 90.5% |
| 16 | Waconia | 13,434 | 12,106 | 90.1% |
| 17 | North Branch | 11,565 | 10,417 | 90.1% |
| 18 | Hutchinson | 14,680 | 13,216 | 90.0% |
| 19 | Oak Grove | 9,130 | 8,217 | 90.0% |
| 20 | East Bethel | 12,115 | 10,884 | 89.8% |
| 21 | Alexandria | 14,735 | 13,203 | 89.6% |
| 22 | Ham Lake | 16,702 | 14,933 | 89.4% |
| 23 | International Falls | 5,642 | 5,023 | 89.0% |
| 24 | Grand Rapids | 11,207 | 9,961 | 88.9% |
| 25 | Virginia | 8,332 | 7,385 | 88.6% |
| 26 | Shorewood | 7,647 | 6,776 | 88.6% |
| 27 | Sauk Rapids | 13,852 | 12,249 | 88.4% |
| 28 | Hermantown | 10,218 | 9,012 | 88.2% |
| 29 | Detroit Lakes | 10,025 | 8,826 | 88.0% |
| 30 | Cambridge | 10,307 | 9,072 | 88.0% |
| 31 | Albertville | 8,207 | 7,196 | 87.7% |
| 32 | Victoria | 11,295 | 9,883 | 87.5% |
| 33 | Litchfield | 6,576 | 5,743 | 87.3% |
| 34 | St. Francis | 8,372 | 7,298 | 87.2% |
| 35 | Redwood Falls | 5,068 | 4,398 | 86.8% |
| 36 | Lake Elmo | 13,140 | 11,401 | 86.8% |
| 37 | Stillwater | 19,355 | 16,785 | 86.7% |
| 38 | Duluth | 87,093 | 75,451 | 86.6% |
| 39 | Winona | 26,009 | 22,498 | 86.5% |
| 40 | Jordan | 6,771 | 5,851 | 86.4% |
| 41 | Belle Plaine | 7,423 | 6,413 | 86.4% |
| 42 | Hugo | 16,340 | 14,058 | 86.0% |
| 43 | Forest Lake | 20,729 | 17,820 | 86.0% |
| 44 | Fairmont | 10,296 | 8,830 | 85.8% |
| 45 | Andover | 33,035 | 28,303 | 85.7% |
| 46 | Mound | 9,107 | 7,802 | 85.7% |
| 47 | St. Michael | 20,010 | 17,109 | 85.5% |
| 48 | Thief River Falls | 8,823 | 7,505 | 85.1% |
| 49 | Sartell | 19,758 | 16,806 | 85.1% |
| 50 | North Mankato | 14,211 | 12,065 | 84.9% |
| 51 | Hastings | 22,117 | 18,758 | 84.8% |
| 52 | Lino Lakes | 22,113 | 18,727 | 84.7% |
| 53 | Waseca | 9,164 | 7,746 | 84.5% |
| 54 | Rogers | 13,685 | 11,552 | 84.4% |
| 55 | Cloquet | 12,537 | 10,572 | 84.3% |
| 56 | Red Wing | 16,758 | 14,035 | 83.8% |
| 57 | Orono | 8,195 | 6,861 | 83.7% |
| 58 | Chanhassen | 26,006 | 21,758 | 83.7% |
| 59 | Elk River | 26,793 | 22,412 | 83.6% |
| 60 | Monticello | 14,858 | 12,403 | 83.5% |
| 61 | Big Lake | 12,367 | 10,323 | 83.5% |
| 62 | Rosemount | 27,562 | 22,655 | 82.2% |
| 63 | Owatonna | 26,498 | 21,749 | 82.1% |
| 64 | Ramsey | 28,421 | 23,257 | 81.8% |
| 65 | Arden Hills | 9,658 | 7,846 | 81.2% |
| 66 | White Bear Lake | 23,908 | 19,413 | 81.2% |
| 67 | Farmington | 23,902 | 19,408 | 81.2% |
| 68 | Mankato | 45,473 | 36,842 | 81.0% |
| 69 | Minnetonka | 53,064 | 42,932 | 80.9% |
| 70 | Crookston | 7,344 | 5,937 | 80.8% |
| 71 | Moorhead | 45,036 | 36,221 | 80.4% |
| 72 | Otsego | 22,245 | 17,887 | 80.4% |
| 73 | Edina | 53,262 | 42,658 | 80.1% |
| 74 | Montevideo | 5,315 | 4,251 | 80.0% |
| 75 | St. Peter | 12,185 | 9,685 | 79.5% |
| 76 | Prior Lake | 28,016 | 22,180 | 79.2% |
| 77 | Mendota Heights | 11,612 | 9,173 | 79.0% |
| 78 | Chaska | 28,706 | 22,546 | 78.5% |
| 79 | Marshall | 13,896 | 10,871 | 78.2% |
| 80 | St. Louis Park | 49,594 | 38,615 | 77.9% |
| 81 | Glencoe | 5,695 | 4,420 | 77.6% |
| 82 | Corcoran | 7,302 | 5,653 | 77.4% |
| 83 | East Grand Forks | 9,028 | 6,942 | 76.9% |
| 84 | St. Joseph | 7,021 | 5,396 | 76.9% |
| 85 | Golden Valley | 21,725 | 16,668 | 76.7% |
| 86 | Maple Grove | 71,173 | 54,575 | 76.7% |
| 87 | Northfield | 20,742 | 15,890 | 76.6% |
| 88 | St. Anthony | 9,671 | 7,371 | 76.2% |
| 89 | Lakeville | 74,354 | 56,663 | 76.2% |
| 90 | Albert Lea | 18,330 | 13,940 | 76.1% |
| 91 | Shoreview | 26,714 | 20,286 | 75.9% |
| 92 | Morris | 5,128 | 3,888 | 75.8% |
| 93 | Champlin | 23,294 | 17,495 | 75.1% |
| 94 | Anoka | 17,970 | 13,468 | 74.9% |
| 95 | Cottage Grove | 40,992 | 30,150 | 73.6% |
| 96 | Inver Grove Heights | 35,906 | 26,404 | 73.5% |
| 97 | Plymouth | 79,220 | 57,940 | 73.1% |
| 98 | Savage | 32,889 | 23,745 | 72.2% |
| 99 | St. Paul Park | 5,457 | 3,891 | 71.3% |
| 100 | Falcon Heights | 5,085 | 3,616 | 71.1% |
Source: U.S. Census ACS 2020-2024. 139 cities with more than 5,000 residents.
Summary
Summary: White Populations Across Minnesota
We measured the locations with the highest percentage of white people in Minnesota. According to the most recent data, this list provides accurate information on the whitest places in Minnesota.
The most White cities in Minnesota are New Prague, Delano, Baxter, New Ulm, Hibbing, Mahtomedi, Lake City, Kasson, Little Falls, and Minnetrista. Not sold on Minnesota? Take the two-minute Find Your Place quiz and see which state actually fits you.


