Whitest cities in Ohio research summary. We analyzed Ohio’s most recent Census data to determine the whitest cities in Ohio based on the percentage of White residents.
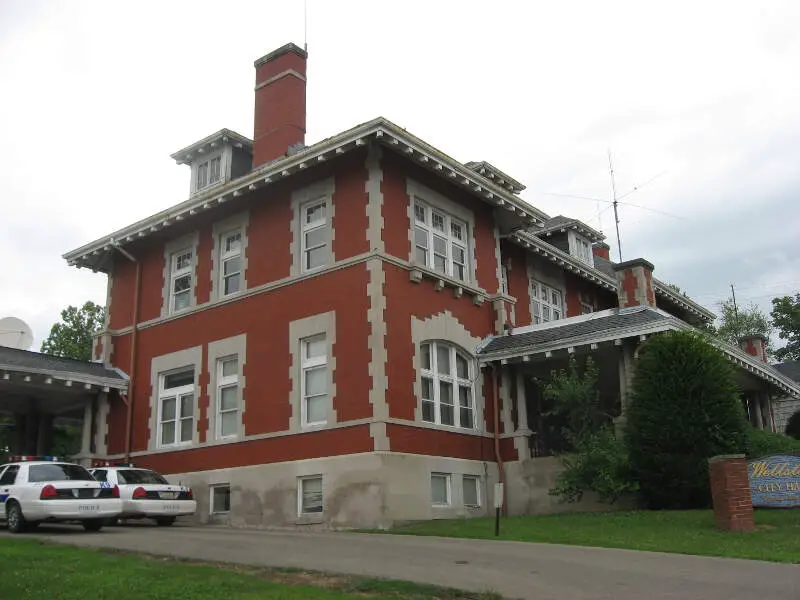
97.7% White · #1 whitest in Ohio
Wellston is a city in Jackson County, Ohio, United States, in the southeastern part of the state. The population was 5,663 at the 2010 census.
Data | Crime | Cost of living | Movers
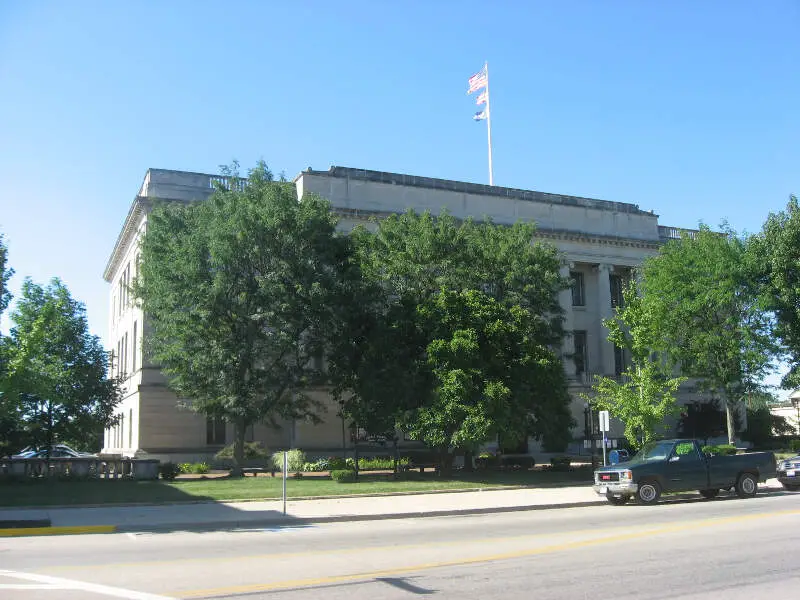
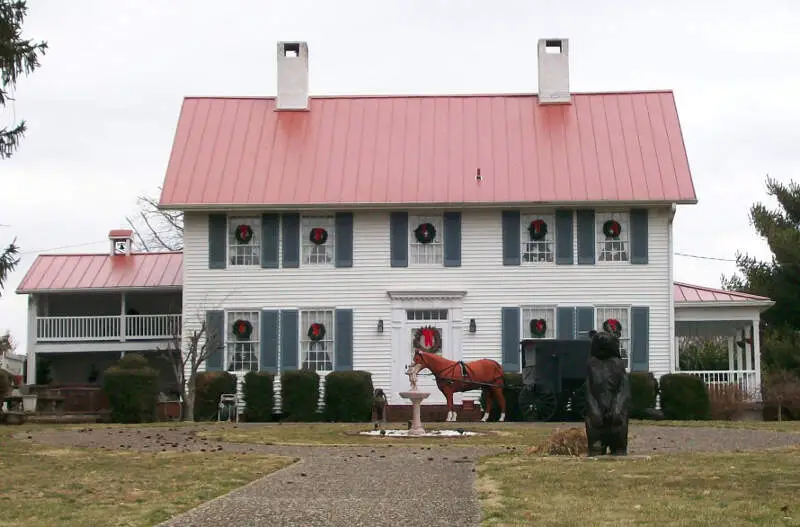
96.2% White · #2 whitest in Ohio
Eaton is a city in and the county seat of Preble County, Ohio, United States. The population was 8,407 at the 2010 census. Eaton’s sister city is Rdental bei Coburg.
Data | Crime | Cost of living | Movers
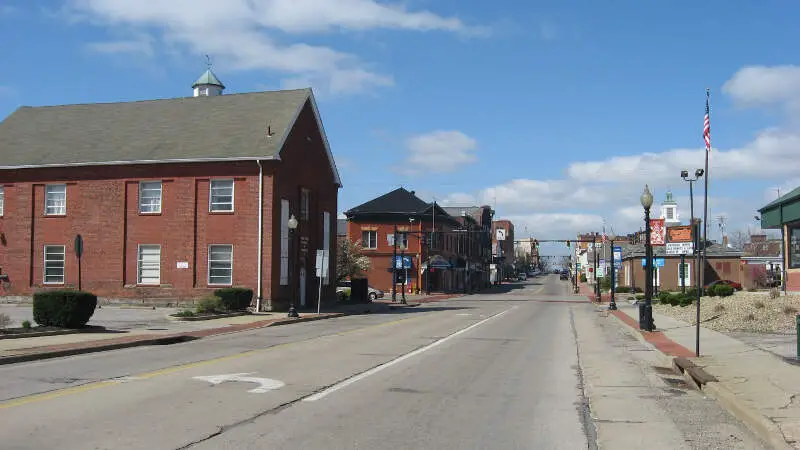
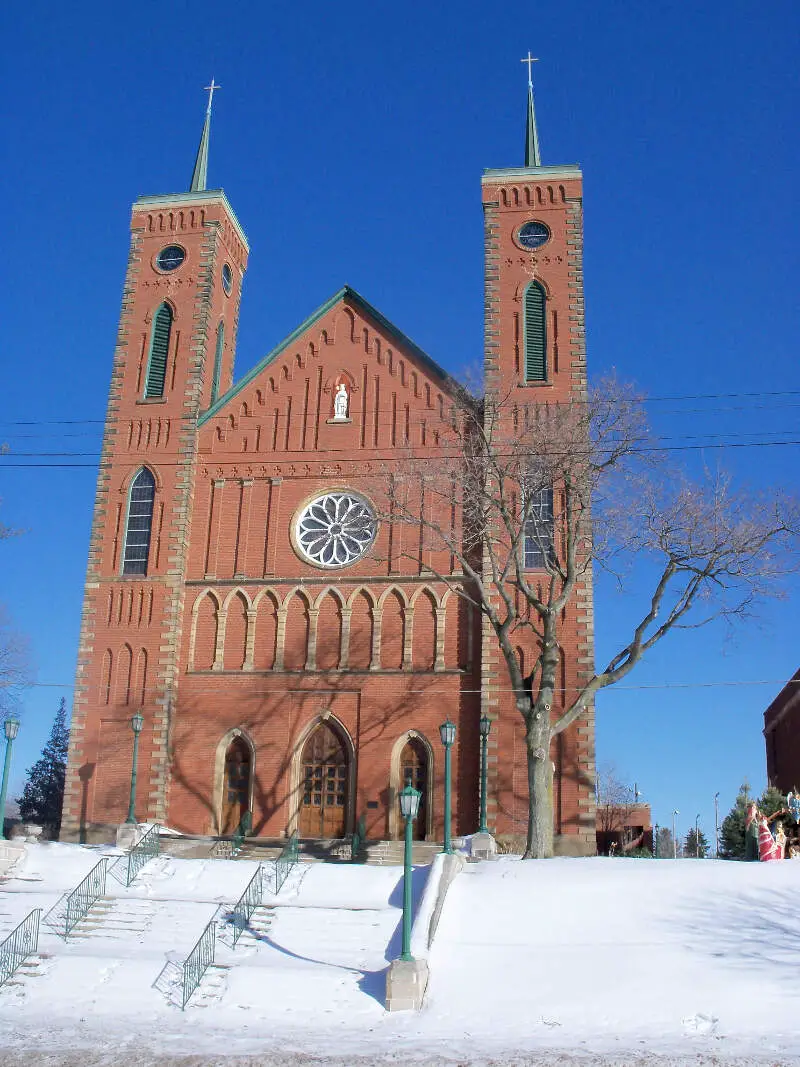
95.9% White · #3 whitest in Ohio
Salem is a city in northern Columbiana County and southern Mahoning County, Ohio, United States. At the 2010 census, the city’s population was 12,303. Salem is the principal city of the Salem, OH Micropolitan Statistical Area, while the small portion of the city that extends into Mahoning County is considered part of the Youngstown-Warren-Boardman, OH-PA Metropolitan Statistical Area.
Data | Crime | Cost of living | Movers
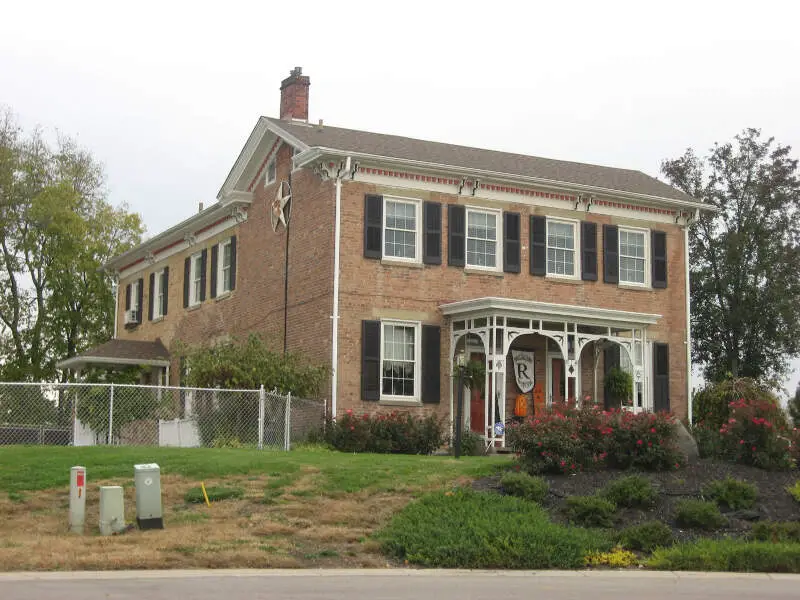
95.4% White · #4 whitest in Ohio
Trenton is a city in northeastern Butler County, Ohio, United States, west of Middletown. Originally in Madison Township, it later annexed land in Wayne Township. The population was 11,869 at the 2010 census.
Data | Crime | Cost of living | Movers
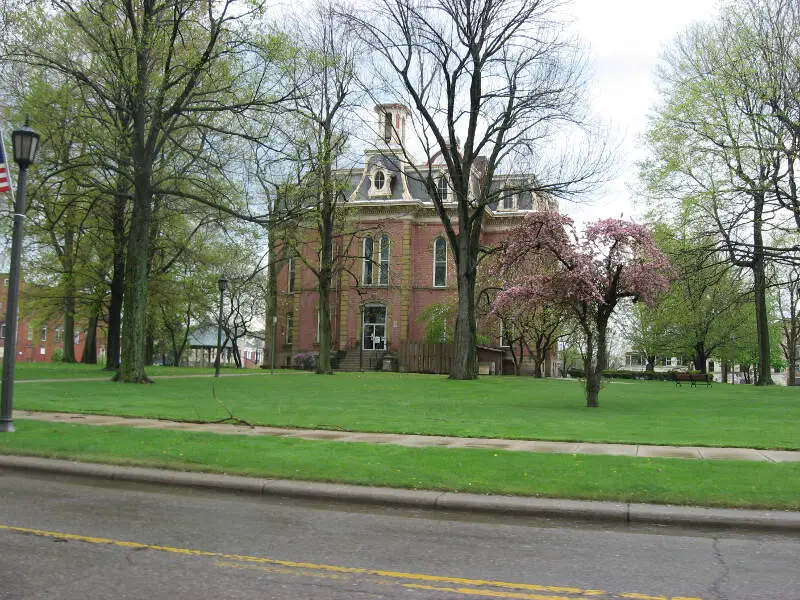
95.4% White · #5 whitest in Ohio
Chardon is a city in and the county seat of Geauga County, Ohio, United States. The population was 5,148 at the 2010 census. It is the only incorporated city in Geauga County, and includes land that was once part of Chardon, Hambden and Munson townships. It is located about 10 miles south of Lake Erie and within the “snow belt” of the Great Lakes.
Data | Crime | Cost of living | Movers
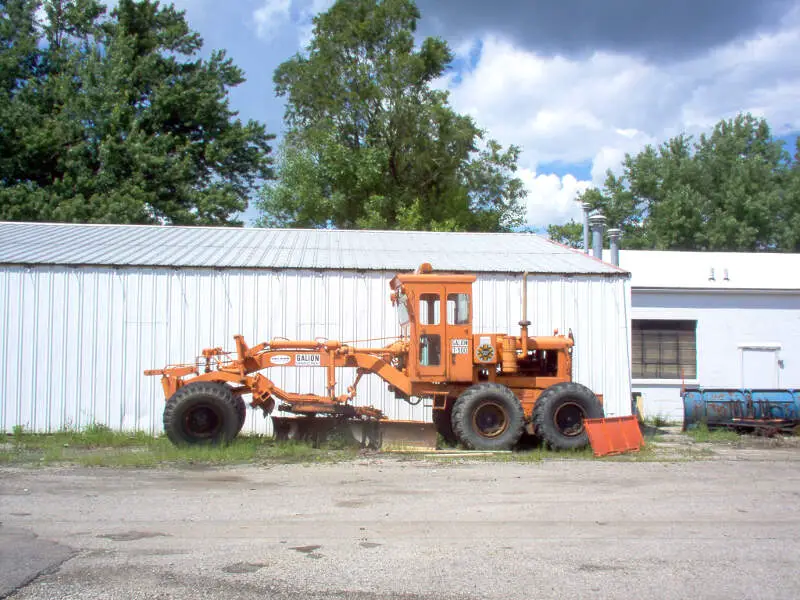
95.1% White · #6 whitest in Ohio
Galion is a city in Crawford, Morrow, and Richland counties in the U.S. state of Ohio. The population was 10,512 at the 2010 census. Galion is the second-largest city in Crawford County after Bucyrus.
Data | Crime | Cost of living | Movers
94.7% White · #7 whitest in Ohio
Belpre is a city in Washington County, Ohio, United States, along the Ohio River. The name Belpre is derived from a contraction of “Belle Prairie”, which is the original name given to the valley by French trappers prior to more permanent settlement by European Americans.
Data | Crime | Cost of living | Movers
94.6% White · #8 whitest in Ohio
Coshocton is a city in and the county seat of Coshocton County, Ohio, United States. The population was 11,216 at the 2010 census. The Walhonding River and the Tuscarawas River meet in Coshocton to form the Muskingum River.
Data | Crime | Cost of living | Movers
94.5% White · #9 whitest in Ohio
Louisville is a city in Stark County in the U.S. state of Ohio. The population was 9,186 at the 2010 census. It is part of the Canton-Massillon, OH Metropolitan Statistical Area.
Data | Crime | Cost of living | Movers

94.5% White · #10 whitest in Ohio
Data | Crime | Cost of living | Movers
The receipts
Compare the top ten
Pick a metric. The bars rescale. The red line is Ohio’s statewide median.
On the map
Where Ohio’s White population is concentrated
Saturday Night Science
Methodology: How we determined the whitest places in Ohio for 2026
To rank the whitest places in Ohio, we used Saturday Night Science to look at Census demographic data.
We had to look at the number of white people living in each city in Ohio on a per capita basis. In other words, the percentage of white people living in each city in Ohio.
We looked at table B03002: Hispanic OR LATINO ORIGIN BY RACE. Here are the category names as defined by the Census:
- Hispanic or Latino
- White alone*
- Black or African American alone*
- American Indian and Alaska Native alone*
- Asian alone*
- Native Hawaiian and Other Pacific Islander alone*
- Some other race alone*
- Two or more races*
Our particular column of interest here was the number of people who identified as White alone.
We limited our analysis to places with a population greater than 5,000 people. That left us with 243 cities.
We then calculated the percentage of residents that are White. The percentages ranked from 97.7% to 3.8%.
Finally, we ranked each city based on the percentage of the White population, with a higher percentage being more White. Wellston took the distinction of being the most White, while Warrensville Heights was the least White city.
We updated this article for 2026. This report represents our eleventh time ranking the whitest cities in Ohio.
The full plate
Cities In Ohio By White Population
Click any column to sort. Search by city name.
| Rank | City | Population | White Population | % White |
|---|---|---|---|---|
| 1 | Wellston | 5,452 | 5,328 | 97.7% |
| 2 | Eaton | 8,339 | 8,023 | 96.2% |
| 3 | Salem | 11,758 | 11,272 | 95.9% |
| 4 | Trenton | 13,583 | 12,955 | 95.4% |
| 5 | Chardon | 5,249 | 5,006 | 95.4% |
| 6 | Galion | 10,339 | 9,837 | 95.1% |
| 7 | Belpre | 6,654 | 6,301 | 94.7% |
| 8 | Coshocton | 11,068 | 10,472 | 94.6% |
| 9 | Louisville | 9,602 | 9,077 | 94.5% |
| 10 | Shelby | 8,865 | 8,377 | 94.5% |
| 11 | Greenville | 12,741 | 11,997 | 94.2% |
| 12 | Rittman | 6,044 | 5,690 | 94.1% |
| 13 | Clyde | 6,331 | 5,958 | 94.1% |
| 14 | Wadsworth | 24,492 | 23,016 | 94.0% |
| 15 | Kirtland | 6,911 | 6,475 | 93.7% |
| 16 | New Franklin | 13,843 | 12,951 | 93.6% |
| 17 | Deer Park | 5,384 | 5,030 | 93.4% |
| 18 | Kenton | 7,663 | 7,152 | 93.3% |
| 19 | Cortland | 7,080 | 6,603 | 93.3% |
| 20 | Uhrichsville | 5,189 | 4,829 | 93.1% |
| 21 | Harrison | 13,084 | 12,158 | 92.9% |
| 22 | Vermilion | 10,343 | 9,594 | 92.8% |
| 23 | Marietta | 13,203 | 12,246 | 92.8% |
| 24 | Toronto | 5,293 | 4,907 | 92.7% |
| 25 | Heath | 10,644 | 9,866 | 92.7% |
| 26 | Wapakoneta | 9,894 | 9,170 | 92.7% |
| 27 | Tipp City | 10,439 | 9,665 | 92.6% |
| 28 | Milford | 6,497 | 6,011 | 92.5% |
| 29 | Independence | 7,534 | 6,958 | 92.4% |
| 30 | Jackson | 6,231 | 5,751 | 92.3% |
| 31 | Bucyrus | 11,594 | 10,683 | 92.1% |
| 32 | Ironton | 10,768 | 9,910 | 92.0% |
| 33 | Oakwood | 9,458 | 8,702 | 92.0% |
| 34 | Bay Village | 15,984 | 14,690 | 91.9% |
| 35 | Bryan | 8,631 | 7,928 | 91.9% |
| 36 | North Canton | 17,727 | 16,276 | 91.8% |
| 37 | Ashland | 18,911 | 17,277 | 91.4% |
| 38 | Lancaster | 41,249 | 37,655 | 91.3% |
| 39 | Logan | 6,993 | 6,383 | 91.3% |
| 40 | Hubbard | 7,598 | 6,923 | 91.1% |
| 41 | Rossford | 6,323 | 5,761 | 91.1% |
| 42 | Avon Lake | 25,752 | 23,456 | 91.1% |
| 43 | Green | 27,393 | 24,950 | 91.1% |
| 44 | Canal Fulton | 5,337 | 4,852 | 90.9% |
| 45 | Upper Sandusky | 6,558 | 5,960 | 90.9% |
| 46 | St. Marys | 8,301 | 7,542 | 90.9% |
| 47 | Circleville | 14,142 | 12,777 | 90.3% |
| 48 | Hillsboro | 6,527 | 5,889 | 90.2% |
| 49 | Norton | 11,524 | 10,392 | 90.2% |
| 50 | Piqua | 20,646 | 18,598 | 90.1% |
| 51 | Brookville | 5,779 | 5,205 | 90.1% |
| 52 | Lebanon | 21,501 | 19,291 | 89.7% |
| 53 | London | 10,484 | 9,397 | 89.6% |
| 54 | Washington Court House | 14,439 | 12,925 | 89.5% |
| 55 | Mount Vernon | 17,052 | 15,247 | 89.4% |
| 56 | Dover | 13,053 | 11,661 | 89.3% |
| 57 | Celina | 10,903 | 9,726 | 89.2% |
| 58 | Napoleon | 8,802 | 7,847 | 89.2% |
| 59 | Rocky River | 21,490 | 19,154 | 89.1% |
| 60 | Columbiana | 6,903 | 6,129 | 88.8% |
| 61 | Canfield | 7,649 | 6,790 | 88.8% |
| 62 | Bellbrook | 7,394 | 6,553 | 88.6% |
| 63 | Van Wert | 10,790 | 9,562 | 88.6% |
| 64 | Mentor | 47,171 | 41,739 | 88.5% |
| 65 | Olmsted Falls | 8,639 | 7,642 | 88.5% |
| 66 | Brunswick | 35,246 | 31,178 | 88.5% |
| 67 | Delphos | 7,143 | 6,318 | 88.5% |
| 68 | Medina | 25,950 | 22,916 | 88.3% |
| 69 | Cambridge | 10,060 | 8,864 | 88.1% |
| 70 | Mentor-on-the-Lake | 7,111 | 6,240 | 87.8% |
| 71 | Hudson | 23,039 | 20,210 | 87.7% |
| 72 | Vandalia | 15,053 | 13,181 | 87.6% |
| 73 | Girard | 9,505 | 8,318 | 87.5% |
| 74 | Fairview Park | 17,018 | 14,888 | 87.5% |
| 75 | Worthington | 14,938 | 13,045 | 87.3% |
| 76 | Urbana | 11,204 | 9,779 | 87.3% |
| 77 | Eastlake | 17,493 | 15,259 | 87.2% |
| 78 | Broadview Heights | 19,771 | 17,225 | 87.1% |
| 79 | North Ridgeville | 36,627 | 31,886 | 87.1% |
| 80 | Wooster | 26,971 | 23,478 | 87.0% |
| 81 | Brecksville | 13,692 | 11,902 | 86.9% |
| 82 | North Royalton | 30,972 | 26,910 | 86.9% |
| 83 | Port Clinton | 5,970 | 5,182 | 86.8% |
| 84 | Tiffin | 17,818 | 15,458 | 86.8% |
| 85 | Grove City | 42,517 | 36,881 | 86.7% |
| 86 | Newark | 50,783 | 43,999 | 86.6% |
| 87 | Miamisburg | 19,948 | 17,261 | 86.5% |
| 88 | Bellevue | 8,187 | 7,084 | 86.5% |
| 89 | Niles | 18,287 | 15,798 | 86.4% |
| 90 | Huron | 6,757 | 5,833 | 86.3% |
| 91 | Maumee | 13,715 | 11,817 | 86.2% |
| 92 | Seven Hills | 11,603 | 9,993 | 86.1% |
| 93 | Amherst | 12,906 | 11,108 | 86.1% |
| 94 | Willoughby | 24,046 | 20,686 | 86.0% |
| 95 | Sidney | 20,501 | 17,626 | 86.0% |
| 96 | New Philadelphia | 17,520 | 15,037 | 85.8% |
| 97 | Avon | 25,317 | 21,699 | 85.7% |
| 98 | Wilmington | 12,620 | 10,811 | 85.7% |
| 99 | Massillon | 32,338 | 27,693 | 85.6% |
| 100 | Aurora | 17,581 | 15,046 | 85.6% |
Source: U.S. Census ACS 2020-2024. 243 cities with more than 5,000 residents.
Summary
Summary: White Populations Across Ohio
We measured the locations with the highest percentage of white people in Ohio. According to the most recent data, this list provides accurate information on the whitest places in Ohio.
The most White cities in Ohio are Wellston, Eaton, Salem, Trenton, Chardon, Galion, Belpre, Coshocton, Louisville, and Shelby. Not sold on Ohio? Take the two-minute Find Your Place quiz and see which state actually fits you.


