Mayville, WI
Demographics And Statistics
Living In Mayville, Wisconsin Summary
Life in Mayville research summary. HomeSnacks has been using Saturday Night Science to research the quality of life in Mayville over the past nine years using Census, FBI, Zillow, and other primary data sources. Based on the most recently available data, we found the following about life in Mayville:
The population in Mayville is 5,169.
The median home value in Mayville is $264,493.
The median income in Mayville is $66,453.
The median rent in Mayville is $853.
The unemployment rate in Mayville is 4.3%.
The poverty rate in Mayville is 6.9%.
The average high in Mayville is 55.6° and the average low is 36.4°.
Table Of Contents
Mayville SnackAbility
Overall SnackAbility
Mayville, WI Crime Report
Crime in Mayville summary. We use data from the FBI to determine the crime rates in Mayville. Key points include:
There were 23 total crimes in Mayville in the last reporting year.
The overall crime rate per 100,000 people in Mayville is 449.1 / 100k people.
The violent crime rate per 100,000 people in Mayville is 58.6 / 100k people.
The property crime rate per 100,000 people in Mayville is 390.5 / 100k people.
Overall, crime in Mayville is -78.81% below the national average.
Total Crimes
Below National Average
Crime In Mayville Comparison Table
| Statistic | Count Raw |
Mayville / 100k People |
Wisconsin / 100k People |
National / 100k People |
|---|---|---|---|---|
| Total Crimes Per 100K | 23 | 449.1 | 1,432.6 | 2,119.2 |
| Violent Crime | 3 | 58.6 | 278.5 | 359.0 |
| Murder | 0 | 0.0 | 4.2 | 5.0 |
| Robbery | 0 | 0.0 | 39.4 | 61.0 |
| Aggravated Assault | 3 | 58.6 | 200.1 | 256.0 |
| Property Crime | 20 | 390.5 | 1,154.1 | 1,760.0 |
| Burglary | 4 | 78.1 | 117.2 | 229.0 |
| Larceny | 14 | 273.4 | 875.6 | 1,272.0 |
| Car Theft | 2 | 39.1 | 161.3 | 259.0 |
Mayville, WI Weather
The average high in Mayville is 55.6° and the average low is 36.4°.
There are 66.9 days of precipitation each year.
Expect an average of 33.0 inches of precipitation each year with 38.3 inches of snow.
| Stat | Mayville |
|---|---|
| Average Annual High | 55.6 |
| Average Annual Low | 36.4 |
| Annual Precipitation Days | 66.9 |
| Average Annual Precipitation | 33.0 |
| Average Annual Snowfall | 38.3 |
Average High
Days of Rain
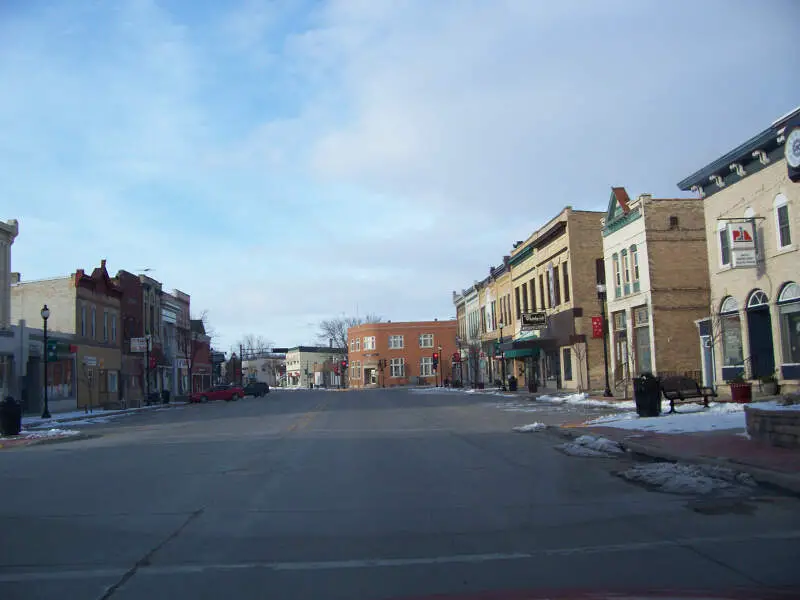
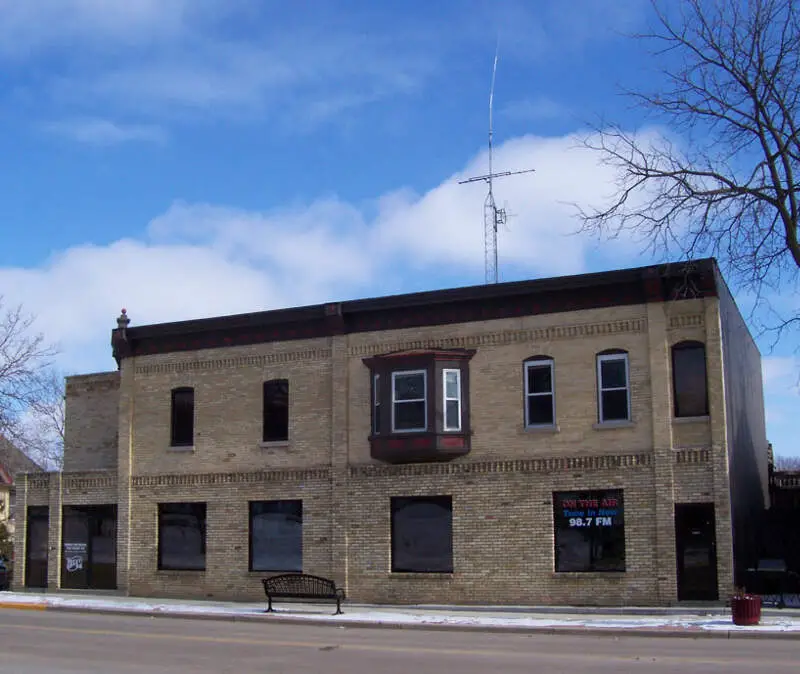
Mayville, WI Photos


Rankings for Mayville in Wisconsin


Locations Around Mayville
Map Of Mayville, WI
Best Places Around Mayville
Hartford, WI
Population 15,761
Slinger, WI
Population 6,173
Beaver Dam, WI
Population 16,629
Waupun, WI
Population 11,244
West Bend, WI
Population 31,722
Fond du Lac, WI
Population 44,491
Mayville Demographics And Statistics
Population over time in Mayville
The current population in Mayville is 5,169. The population has increased 0.8% from 2010.
| Year | Population | % Change |
|---|---|---|
| 2023 | 5,169 | -0.1% |
| 2022 | 5,176 | 0.2% |
| 2021 | 5,165 | 5.9% |
| 2020 | 4,875 | -0.4% |
| 2019 | 4,895 | -0.5% |
| 2018 | 4,921 | -0.5% |
| 2017 | 4,945 | -1.4% |
| 2016 | 5,016 | -0.9% |
| 2015 | 5,060 | -0.5% |
| 2014 | 5,086 | -0.6% |
| 2013 | 5,117 | -0.2% |
| 2012 | 5,128 | -0.3% |
| 2011 | 5,141 | 0.3% |
| 2010 | 5,127 | - |
Race / Ethnicity in Mayville
Mayville is:
97.4% White with 5,034 White residents.
0.2% African American with 11 African American residents.
0.2% American Indian with 8 American Indian residents.
0.0% Asian with 0 Asian residents.
0.0% Hawaiian with 0 Hawaiian residents.
0.0% Other with 0 Other residents.
2.0% Two Or More with 104 Two Or More residents.
0.2% Hispanic with 12 Hispanic residents.
| Race | Mayville | WI | USA |
|---|---|---|---|
| White | 97.4% | 79.2% | 58.2% |
| African American | 0.2% | 6.0% | 12.0% |
| American Indian | 0.2% | 0.6% | 0.5% |
| Asian | 0.0% | 2.9% | 5.7% |
| Hawaiian | 0.0% | 0.0% | 0.2% |
| Other | 0.0% | 0.3% | 0.5% |
| Two Or More | 2.0% | 3.3% | 3.9% |
| Hispanic | 0.2% | 7.8% | 19.0% |
Gender in Mayville
Mayville is 51.1% female with 2,639 female residents.
Mayville is 48.9% male with 2,529 male residents.
| Gender | Mayville | WI | USA |
|---|---|---|---|
| Female | 51.1% | 49.9% | 50.5% |
| Male | 48.9% | 50.1% | 49.5% |
Highest level of educational attainment in Mayville for adults over 25
3.0% of adults in Mayville completed < 9th grade.
7.0% of adults in Mayville completed 9-12th grade.
41.0% of adults in Mayville completed high school / ged.
20.0% of adults in Mayville completed some college.
14.0% of adults in Mayville completed associate's degree.
9.0% of adults in Mayville completed bachelor's degree.
6.0% of adults in Mayville completed master's degree.
0.0% of adults in Mayville completed professional degree.
0.0% of adults in Mayville completed doctorate degree.
| Education | Mayville | WI | USA |
|---|---|---|---|
| < 9th Grade | 3.0% | 2.0% | 5.0% |
| 9-12th Grade | 7.0% | 4.0% | 6.0% |
| High School / GED | 41.0% | 30.0% | 26.0% |
| Some College | 20.0% | 20.0% | 19.0% |
| Associate's Degree | 14.0% | 11.0% | 9.0% |
| Bachelor's Degree | 9.0% | 22.0% | 21.0% |
| Master's Degree | 6.0% | 8.0% | 10.0% |
| Professional Degree | 0.0% | 2.0% | 2.0% |
| Doctorate Degree | 0.0% | 1.0% | 2.0% |
Household Income For Mayville, Wisconsin
4.5% of households in Mayville earn Less than $10,000.
0.7% of households in Mayville earn $10,000 to $14,999.
4.6% of households in Mayville earn $15,000 to $24,999.
8.0% of households in Mayville earn $25,000 to $34,999.
16.1% of households in Mayville earn $35,000 to $49,999.
26.3% of households in Mayville earn $50,000 to $74,999.
9.4% of households in Mayville earn $75,000 to $99,999.
20.0% of households in Mayville earn $100,000 to $149,999.
7.9% of households in Mayville earn $150,000 to $199,999.
2.6% of households in Mayville earn $200,000 or more.
| Income | Mayville | WI | USA |
|---|---|---|---|
| Less than $10,000 | 4.5% | 4.0% | 4.9% |
| $10,000 to $14,999 | 0.7% | 3.2% | 3.6% |
| $15,000 to $24,999 | 4.6% | 6.2% | 6.6% |
| $25,000 to $34,999 | 8.0% | 7.4% | 6.8% |
| $35,000 to $49,999 | 16.1% | 10.9% | 10.4% |
| $50,000 to $74,999 | 26.3% | 17.8% | 15.7% |
| $75,000 to $99,999 | 9.4% | 14.0% | 12.7% |
| $100,000 to $149,999 | 20.0% | 18.9% | 17.4% |
| $150,000 to $199,999 | 7.9% | 8.9% | 9.3% |
| $200,000 or more | 2.6% | 8.6% | 12.6% |


