River Falls, WI
Demographics And Statistics
Living In River Falls, Wisconsin Summary
Life in River Falls research summary. HomeSnacks has been using Saturday Night Science to research the quality of life in River Falls over the past nine years using Census, FBI, Zillow, and other primary data sources. Based on the most recently available data, we found the following about life in River Falls:
The population in River Falls is 16,349.
The median home value in River Falls is $405,192.
The median income in River Falls is $78,078.
The cost of living in River Falls is 102 which is 1.0x higher than the national average.
The median rent in River Falls is $1,050.
The unemployment rate in River Falls is 3.4%.
The poverty rate in River Falls is 17.3%.
The average high in River Falls is 55.0° and the average low is 35.2°.
River Falls SnackAbility
Overall SnackAbility
River Falls, WI Crime Report
Crime in River Falls summary. We use data from the FBI to determine the crime rates in River Falls. Key points include:
There were 251 total crimes in River Falls in the last reporting year.
The overall crime rate per 100,000 people in River Falls is 1,555.0 / 100k people.
The violent crime rate per 100,000 people in River Falls is 80.5 / 100k people.
The property crime rate per 100,000 people in River Falls is 1,474.5 / 100k people.
Overall, crime in River Falls is -26.62% below the national average.
Total Crimes
Below National Average
Crime In River Falls Comparison Table
| Statistic | Count Raw |
River Falls / 100k People |
Wisconsin / 100k People |
National / 100k People |
|---|---|---|---|---|
| Total Crimes Per 100K | 251 | 1,555.0 | 1,432.6 | 2,119.2 |
| Violent Crime | 13 | 80.5 | 278.5 | 359.0 |
| Murder | 0 | 0.0 | 4.2 | 5.0 |
| Robbery | 0 | 0.0 | 39.4 | 61.0 |
| Aggravated Assault | 11 | 68.1 | 200.1 | 256.0 |
| Property Crime | 238 | 1,474.5 | 1,154.1 | 1,760.0 |
| Burglary | 22 | 136.3 | 117.2 | 229.0 |
| Larceny | 200 | 1,239.1 | 875.6 | 1,272.0 |
| Car Theft | 16 | 99.1 | 161.3 | 259.0 |
River Falls, WI Cost Of Living
Cost of living in River Falls summary. We use data on the cost of living to determine how expensive it is to live in River Falls. Real estate prices drive most of the variance in cost of living around Wisconsin. Key points include:
The cost of living in River Falls is 102 with 100 being average.
The cost of living in River Falls is 1.0x higher than the national average.
The median home value in River Falls is $405,192.
The median income in River Falls is $78,078.
River Falls's Overall Cost Of Living
Higher Than The National Average
Cost Of Living In River Falls Comparison Table
| Living Expense | River Falls | Wisconsin | National Average | |
|---|---|---|---|---|
| Overall | 102 | 95 | 100 | |
| Services | 95 | 98 | 100 | |
| Groceries | 100 | 100 | 100 | |
| Health | 102 | 111 | 100 | |
| Housing | 115 | 88 | 100 | |
| Transportation | 99 | 100 | 100 | |
| Utilities | 95 | 102 | 100 | |
River Falls, WI Weather
The average high in River Falls is 55.0° and the average low is 35.2°.
There are 61.9 days of precipitation each year.
Expect an average of 31.9 inches of precipitation each year with 45.2 inches of snow.
| Stat | River Falls |
|---|---|
| Average Annual High | 55.0 |
| Average Annual Low | 35.2 |
| Annual Precipitation Days | 61.9 |
| Average Annual Precipitation | 31.9 |
| Average Annual Snowfall | 45.2 |
Average High
Days of Rain
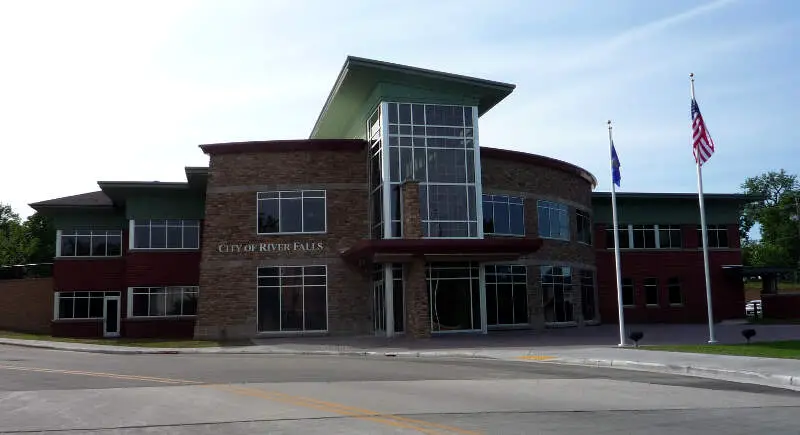
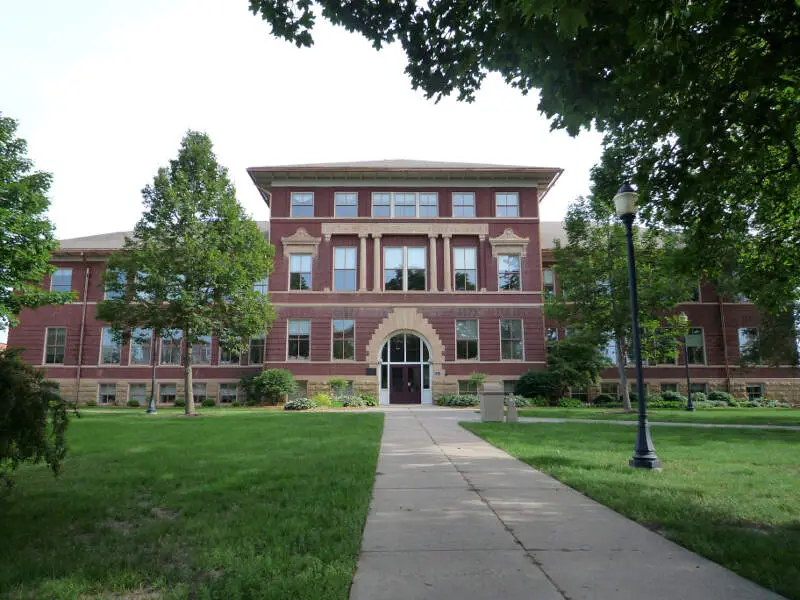
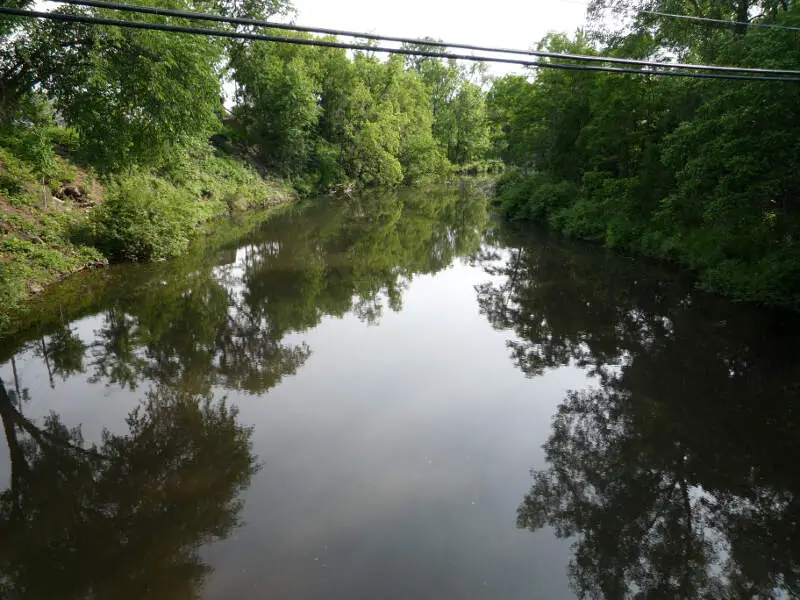
River Falls, WI Photos
Rankings for River Falls in Wisconsin


Locations Around River Falls
Map Of River Falls, WI
Best Places Around River Falls
Woodbury, MN
Population 76,945
Lake Elmo, MN
Population 12,504
Cottage Grove, MN
Population 40,124
Hudson, WI
Population 15,004
Stillwater, MN
Population 19,323
New Richmond, WI
Population 10,334
St. Paul Park, MN
Population 5,464
Hastings, MN
Population 22,050
Oakdale, MN
Population 28,109
Red Wing, MN
Population 16,660
River Falls Demographics And Statistics
Population over time in River Falls
The current population in River Falls is 16,349. The population has increased 11.2% from 2010.
| Year | Population | % Change |
|---|---|---|
| 2023 | 16,349 | 1.1% |
| 2022 | 16,165 | 0.7% |
| 2021 | 16,058 | 1.2% |
| 2020 | 15,870 | 1.5% |
| 2019 | 15,638 | 1.1% |
| 2018 | 15,467 | 1.4% |
| 2017 | 15,256 | 0.7% |
| 2016 | 15,152 | 0.3% |
| 2015 | 15,103 | 0.4% |
| 2014 | 15,050 | -0.0% |
| 2013 | 15,052 | 0.4% |
| 2012 | 14,986 | 1.2% |
| 2011 | 14,814 | 0.8% |
| 2010 | 14,696 | - |
Race / Ethnicity in River Falls
River Falls is:
91.6% White with 14,973 White residents.
0.6% African American with 96 African American residents.
0.3% American Indian with 41 American Indian residents.
1.6% Asian with 254 Asian residents.
0.1% Hawaiian with 23 Hawaiian residents.
0.2% Other with 29 Other residents.
3.4% Two Or More with 554 Two Or More residents.
2.3% Hispanic with 379 Hispanic residents.
| Race | River Falls | WI | USA |
|---|---|---|---|
| White | 91.6% | 79.2% | 58.2% |
| African American | 0.6% | 6.0% | 12.0% |
| American Indian | 0.3% | 0.6% | 0.5% |
| Asian | 1.6% | 2.9% | 5.7% |
| Hawaiian | 0.1% | 0.0% | 0.2% |
| Other | 0.2% | 0.3% | 0.5% |
| Two Or More | 3.4% | 3.3% | 3.9% |
| Hispanic | 2.3% | 7.8% | 19.0% |
Gender in River Falls
River Falls is 52.7% female with 8,620 female residents.
River Falls is 47.3% male with 7,729 male residents.
| Gender | River Falls | WI | USA |
|---|---|---|---|
| Female | 52.7% | 49.9% | 50.5% |
| Male | 47.3% | 50.1% | 49.5% |
Highest level of educational attainment in River Falls for adults over 25
-1.0% of adults in River Falls completed < 9th grade.
2.0% of adults in River Falls completed 9-12th grade.
21.0% of adults in River Falls completed high school / ged.
19.0% of adults in River Falls completed some college.
14.0% of adults in River Falls completed associate's degree.
29.0% of adults in River Falls completed bachelor's degree.
11.0% of adults in River Falls completed master's degree.
3.0% of adults in River Falls completed professional degree.
2.0% of adults in River Falls completed doctorate degree.
| Education | River Falls | WI | USA |
|---|---|---|---|
| < 9th Grade | -1.0% | 2.0% | 5.0% |
| 9-12th Grade | 2.0% | 4.0% | 6.0% |
| High School / GED | 21.0% | 30.0% | 26.0% |
| Some College | 19.0% | 20.0% | 19.0% |
| Associate's Degree | 14.0% | 11.0% | 9.0% |
| Bachelor's Degree | 29.0% | 22.0% | 21.0% |
| Master's Degree | 11.0% | 8.0% | 10.0% |
| Professional Degree | 3.0% | 2.0% | 2.0% |
| Doctorate Degree | 2.0% | 1.0% | 2.0% |
Household Income For River Falls, Wisconsin
3.4% of households in River Falls earn Less than $10,000.
2.2% of households in River Falls earn $10,000 to $14,999.
6.1% of households in River Falls earn $15,000 to $24,999.
7.3% of households in River Falls earn $25,000 to $34,999.
13.5% of households in River Falls earn $35,000 to $49,999.
16.3% of households in River Falls earn $50,000 to $74,999.
14.5% of households in River Falls earn $75,000 to $99,999.
21.7% of households in River Falls earn $100,000 to $149,999.
9.6% of households in River Falls earn $150,000 to $199,999.
5.3% of households in River Falls earn $200,000 or more.
| Income | River Falls | WI | USA |
|---|---|---|---|
| Less than $10,000 | 3.4% | 4.0% | 4.9% |
| $10,000 to $14,999 | 2.2% | 3.2% | 3.6% |
| $15,000 to $24,999 | 6.1% | 6.2% | 6.6% |
| $25,000 to $34,999 | 7.3% | 7.4% | 6.8% |
| $35,000 to $49,999 | 13.5% | 10.9% | 10.4% |
| $50,000 to $74,999 | 16.3% | 17.8% | 15.7% |
| $75,000 to $99,999 | 14.5% | 14.0% | 12.7% |
| $100,000 to $149,999 | 21.7% | 18.9% | 17.4% |
| $150,000 to $199,999 | 9.6% | 8.9% | 9.3% |
| $200,000 or more | 5.3% | 8.6% | 12.6% |


