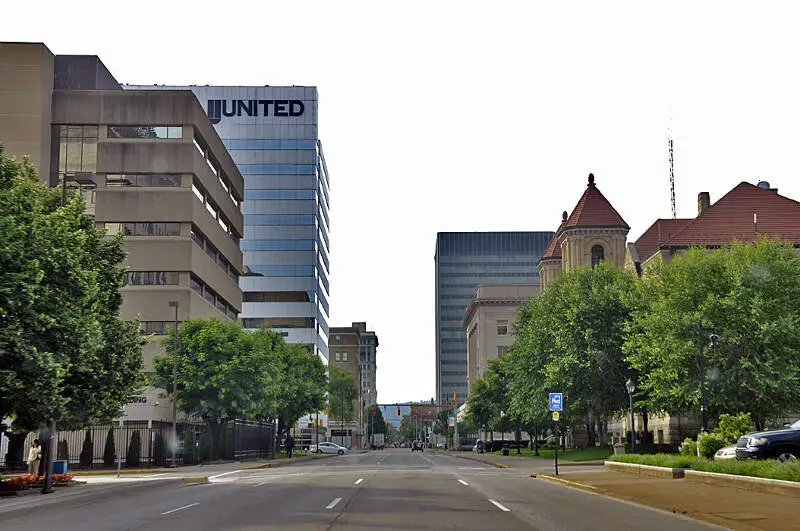
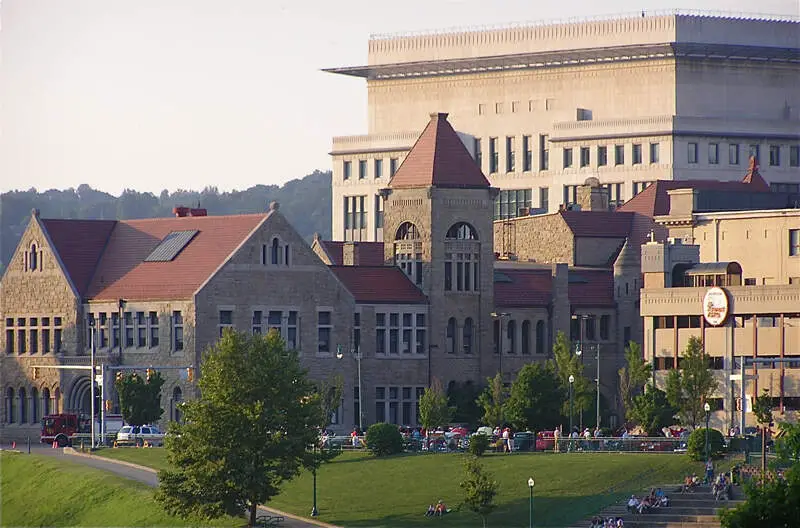
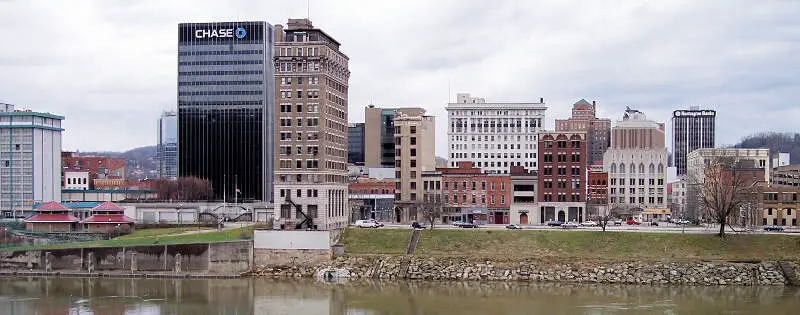
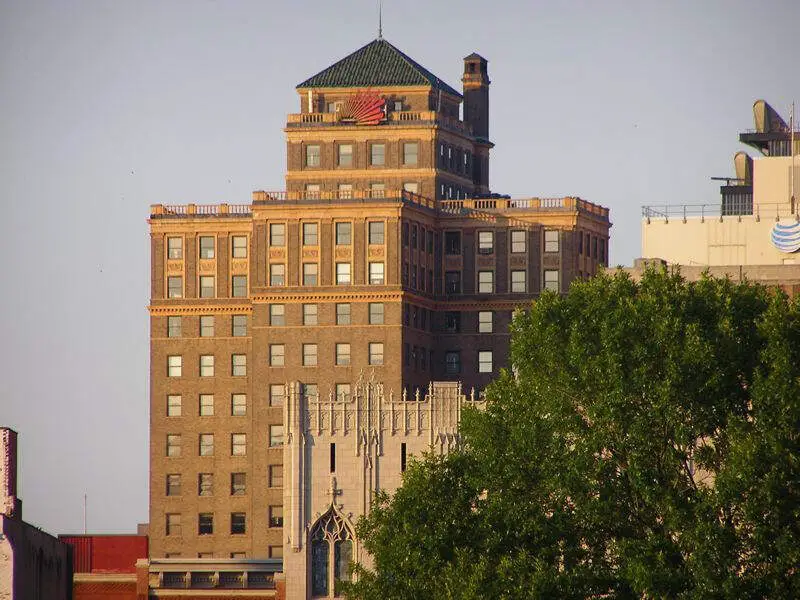
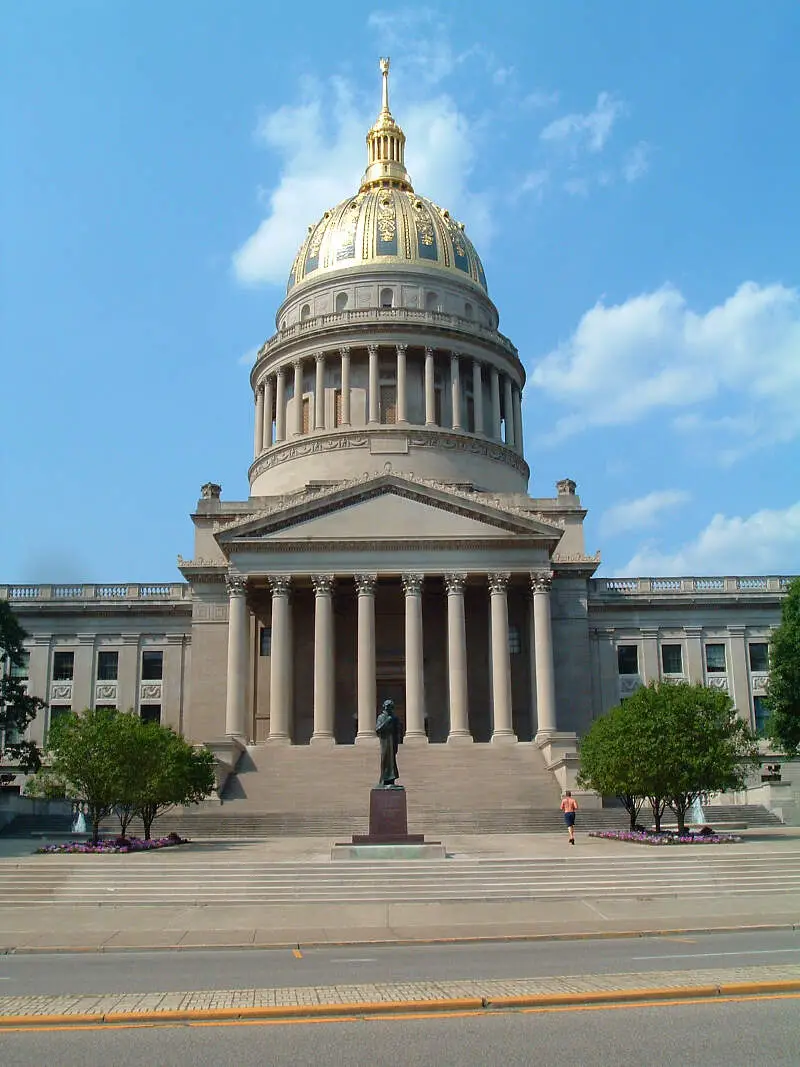
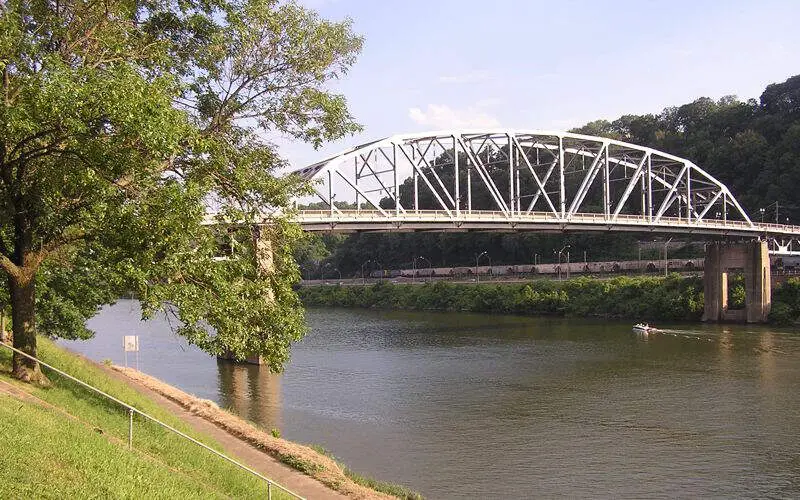
Charleston, WV
Demographics And Statistics
Living In Charleston, West Virginia Summary
Life in Charleston research summary. HomeSnacks has been using Saturday Night Science to research the quality of life in Charleston over the past nine years using Census, FBI, Zillow, and other primary data sources. Based on the most recently available data, we found the following about life in Charleston:
The population in Charleston is 47,918.
The median home value in Charleston is $159,921.
The median income in Charleston is $64,512.
The cost of living in Charleston is 92 which is 0.9x lower than the national average.
The median rent in Charleston is $898.
The unemployment rate in Charleston is 6.3%.
The poverty rate in Charleston is 16.5%.
The average high in Charleston is 66.2° and the average low is 43.5°.
Charleston SnackAbility
Overall SnackAbility
Charleston, WV Crime Report
Crime in Charleston summary. We use data from the FBI to determine the crime rates in Charleston. Key points include:
There were 1,694 total crimes in Charleston in the last reporting year.
The overall crime rate per 100,000 people in Charleston is 3,662.5 / 100k people.
The violent crime rate per 100,000 people in Charleston is 542.7 / 100k people.
The property crime rate per 100,000 people in Charleston is 3,119.9 / 100k people.
Overall, crime in Charleston is 72.82% above the national average.
Total Crimes
Above National Average
Crime In Charleston Comparison Table
| Statistic | Count Raw |
Charleston / 100k People |
West Virginia / 100k People |
National / 100k People |
|---|---|---|---|---|
| Total Crimes Per 100K | 1,694 | 3,662.5 | 1,410.8 | 2,119.2 |
| Violent Crime | 251 | 542.7 | 248.8 | 359.0 |
| Murder | 6 | 13.0 | 5.3 | 5.0 |
| Robbery | 25 | 54.1 | 9.7 | 61.0 |
| Aggravated Assault | 193 | 417.3 | 185.8 | 256.0 |
| Property Crime | 1,443 | 3,119.9 | 1,161.9 | 1,760.0 |
| Burglary | 303 | 655.1 | 178.3 | 229.0 |
| Larceny | 1,055 | 2,281.0 | 905.1 | 1,272.0 |
| Car Theft | 85 | 183.8 | 78.5 | 259.0 |
Charleston, WV Cost Of Living
Cost of living in Charleston summary. We use data on the cost of living to determine how expensive it is to live in Charleston. Real estate prices drive most of the variance in cost of living around West Virginia. Key points include:
The cost of living in Charleston is 92 with 100 being average.
The cost of living in Charleston is 0.9x lower than the national average.
The median home value in Charleston is $159,921.
The median income in Charleston is $64,512.
Charleston's Overall Cost Of Living
Lower Than The National Average
Cost Of Living In Charleston Comparison Table
| Living Expense | Charleston | West Virginia | National Average | |
|---|---|---|---|---|
| Overall | 92 | 87 | 100 | |
| Services | 95 | 95 | 100 | |
| Groceries | 99 | 99 | 100 | |
| Health | 103 | 96 | 100 | |
| Housing | 84 | 62 | 100 | |
| Transportation | 93 | 93 | 100 | |
| Utilities | 99 | 95 | 100 | |
Charleston, WV Weather
The average high in Charleston is 66.2° and the average low is 43.5°.
There are 90.9 days of precipitation each year.
Expect an average of 43.9 inches of precipitation each year with 31.5 inches of snow.
| Stat | Charleston |
|---|---|
| Average Annual High | 66.2 |
| Average Annual Low | 43.5 |
| Annual Precipitation Days | 90.9 |
| Average Annual Precipitation | 43.9 |
| Average Annual Snowfall | 31.5 |
Average High
Days of Rain
Charleston, WV Photos
2 Reviews & Comments About Charleston
/5

HomeSnacks User - 2018-08-27 19:20:21.630455
There are positives and negatives about the city. It can be beautiful in the good places, and it is exceptional in uniqueness and even the dining options.
The city is home to the cultural shenanigans of the state.
HomeSnacks User - 2018-09-10 16:59:33.464678
This place is absolutely beautiful in autumn The mountains are all full o colorful trees. The people are down to earth, friendly and helpful. Great places to eat. Very cool weather that time of year makes it relaxing.
The scenery is breath taking. See the mountains and colors
Rankings for Charleston in West Virginia


Locations Around Charleston
Map Of Charleston, WV
Best Places Around Charleston
St. Albans, WV
Population 10,637
Teays Valley, WV
Population 13,961
Dunbar, WV
Population 7,340
South Charleston, WV
Population 13,594
Nitro, WV
Population 6,941
Cross Lanes, WV
Population 10,172
Charleston Demographics And Statistics
Population over time in Charleston
The current population in Charleston is 47,918. The population has decreased -6.8% from 2010.
| Year | Population | % Change |
|---|---|---|
| 2023 | 47,918 | -1.0% |
| 2022 | 48,415 | -1.3% |
| 2021 | 49,055 | 3.8% |
| 2020 | 47,273 | -1.5% |
| 2019 | 48,006 | -1.5% |
| 2018 | 48,734 | -1.3% |
| 2017 | 49,384 | -1.6% |
| 2016 | 50,210 | -0.7% |
| 2015 | 50,566 | -0.7% |
| 2014 | 50,911 | -0.4% |
| 2013 | 51,135 | -0.2% |
| 2012 | 51,224 | -0.3% |
| 2011 | 51,360 | -0.1% |
| 2010 | 51,432 | - |
Race / Ethnicity in Charleston
Charleston is:
75.9% White with 36,392 White residents.
11.8% African American with 5,640 African American residents.
0.1% American Indian with 27 American Indian residents.
2.7% Asian with 1,282 Asian residents.
0.1% Hawaiian with 34 Hawaiian residents.
0.1% Other with 48 Other residents.
7.5% Two Or More with 3,570 Two Or More residents.
1.9% Hispanic with 925 Hispanic residents.
| Race | Charleston | WV | USA |
|---|---|---|---|
| White | 75.9% | 90.2% | 58.2% |
| African American | 11.8% | 3.2% | 12.0% |
| American Indian | 0.1% | 0.1% | 0.5% |
| Asian | 2.7% | 0.7% | 5.7% |
| Hawaiian | 0.1% | 0.0% | 0.2% |
| Other | 0.1% | 0.3% | 0.5% |
| Two Or More | 7.5% | 3.4% | 3.9% |
| Hispanic | 1.9% | 2.0% | 19.0% |
Gender in Charleston
Charleston is 50.8% female with 24,353 female residents.
Charleston is 49.2% male with 23,565 male residents.
| Gender | Charleston | WV | USA |
|---|---|---|---|
| Female | 50.8% | 50.1% | 50.5% |
| Male | 49.2% | 49.9% | 49.5% |
Highest level of educational attainment in Charleston for adults over 25
3.0% of adults in Charleston completed < 9th grade.
5.0% of adults in Charleston completed 9-12th grade.
23.0% of adults in Charleston completed high school / ged.
19.0% of adults in Charleston completed some college.
7.0% of adults in Charleston completed associate's degree.
22.0% of adults in Charleston completed bachelor's degree.
11.0% of adults in Charleston completed master's degree.
8.0% of adults in Charleston completed professional degree.
2.0% of adults in Charleston completed doctorate degree.
| Education | Charleston | WV | USA |
|---|---|---|---|
| < 9th Grade | 3.0% | 4.0% | 5.0% |
| 9-12th Grade | 5.0% | 8.0% | 6.0% |
| High School / GED | 23.0% | 39.0% | 26.0% |
| Some College | 19.0% | 18.0% | 19.0% |
| Associate's Degree | 7.0% | 8.0% | 9.0% |
| Bachelor's Degree | 22.0% | 14.0% | 21.0% |
| Master's Degree | 11.0% | 7.0% | 10.0% |
| Professional Degree | 8.0% | 1.0% | 2.0% |
| Doctorate Degree | 2.0% | 1.0% | 2.0% |
Household Income For Charleston, West Virginia
6.7% of households in Charleston earn Less than $10,000.
7.4% of households in Charleston earn $10,000 to $14,999.
8.1% of households in Charleston earn $15,000 to $24,999.
6.7% of households in Charleston earn $25,000 to $34,999.
11.6% of households in Charleston earn $35,000 to $49,999.
16.3% of households in Charleston earn $50,000 to $74,999.
12.0% of households in Charleston earn $75,000 to $99,999.
14.3% of households in Charleston earn $100,000 to $149,999.
5.5% of households in Charleston earn $150,000 to $199,999.
11.3% of households in Charleston earn $200,000 or more.
| Income | Charleston | WV | USA |
|---|---|---|---|
| Less than $10,000 | 6.7% | 6.2% | 4.9% |
| $10,000 to $14,999 | 7.4% | 5.8% | 3.6% |
| $15,000 to $24,999 | 8.1% | 9.9% | 6.6% |
| $25,000 to $34,999 | 6.7% | 9.2% | 6.8% |
| $35,000 to $49,999 | 11.6% | 12.9% | 10.4% |
| $50,000 to $74,999 | 16.3% | 17.3% | 15.7% |
| $75,000 to $99,999 | 12.0% | 12.6% | 12.7% |
| $100,000 to $149,999 | 14.3% | 14.6% | 17.4% |
| $150,000 to $199,999 | 5.5% | 6.1% | 9.3% |
| $200,000 or more | 11.3% | 5.4% | 12.6% |


