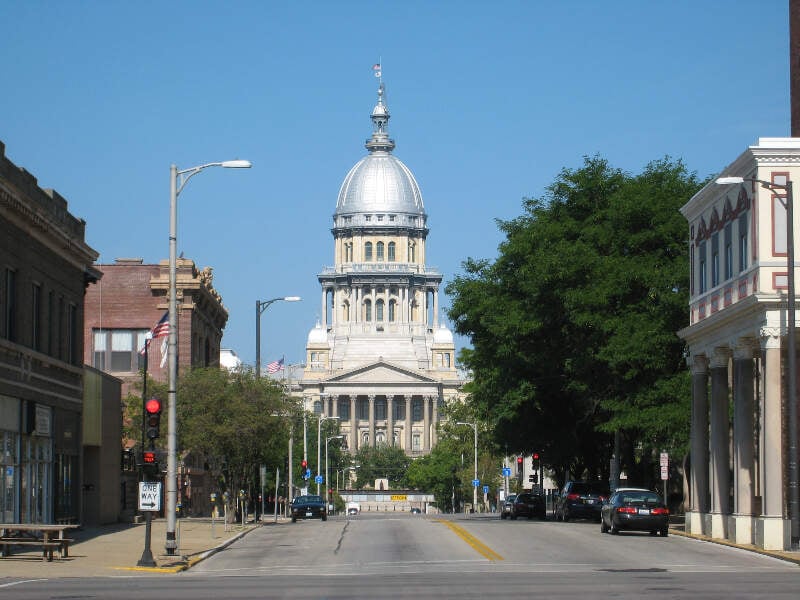
Springfield, IL
Demographics And Statistics
Living In Springfield, Illinois Summary
Life in Springfield research summary. HomeSnacks has been using Saturday Night Science to research the quality of life in Springfield over the past nine years using Census, FBI, Zillow, and other primary data sources. Based on the most recently available data, we found the following about life in Springfield:
The population in Springfield is 114,214.
The median home value in Springfield is $147,947.
The median income in Springfield is $62,419.
The cost of living in Springfield is 87 which is 0.9x lower than the national average.
The median rent in Springfield is $913.
The unemployment rate in Springfield is 6.6%.
The poverty rate in Springfield is 16.7%.
The average high in Springfield is 63.0° and the average low is 42.6°.
Springfield SnackAbility
Overall SnackAbility
Springfield, IL Crime Report
Crime in Springfield summary. We use data from the FBI to determine the crime rates in Springfield. Key points include:
There were 5,644 total crimes in Springfield in the last reporting year.
The overall crime rate per 100,000 people in Springfield is 5,014.7 / 100k people.
The violent crime rate per 100,000 people in Springfield is 770.3 / 100k people.
The property crime rate per 100,000 people in Springfield is 4,244.4 / 100k people.
Overall, crime in Springfield is 115.76% above the national average.
Total Crimes
Above National Average
Crime In Springfield Comparison Table
| Statistic | Count Raw |
Springfield / 100k People |
Illinois / 100k People |
National / 100k People |
|---|---|---|---|---|
| Total Crimes Per 100K | 5,644 | 5,014.7 | 1,985.3 | 2,324.2 |
| Violent Crime | 867 | 770.3 | 425.9 | 369.8 |
| Murder | 7 | 6.2 | 9.1 | 6.3 |
| Robbery | 147 | 130.6 | 97.4 | 66.1 |
| Aggravated Assault | 617 | 548.2 | 278.9 | 268.2 |
| Property Crime | 4,777 | 4,244.4 | 1,559.4 | 1,954.4 |
| Burglary | 909 | 807.6 | 246.4 | 269.8 |
| Larceny | 3,361 | 2,986.3 | 1,143.5 | 1,401.9 |
| Car Theft | 507 | 450.5 | 169.5 | 282.7 |
Springfield, IL Cost Of Living
Cost of living in Springfield summary. We use data on the cost of living to determine how expensive it is to live in Springfield. Real estate prices drive most of the variance in cost of living around Illinois. Key points include:
The cost of living in Springfield is 87 with 100 being average.
The cost of living in Springfield is 0.9x lower than the national average.
The median home value in Springfield is $147,947.
The median income in Springfield is $62,419.
Springfield's Overall Cost Of Living
Lower Than The National Average
Cost Of Living In Springfield Comparison Table
| Living Expense | Springfield | Illinois | National Average | |
|---|---|---|---|---|
| Overall | 87 | 92 | 100 | |
| Services | 89 | 95 | 100 | |
| Groceries | 99 | 98 | 100 | |
| Health | 99 | 96 | 100 | |
| Housing | 68 | 81 | 100 | |
| Transportation | 106 | 105 | 100 | |
| Utilities | 100 | 90 | 100 | |
Springfield, IL Weather
The average high in Springfield is 63.0° and the average low is 42.6°.
There are 68.3 days of precipitation each year.
Expect an average of 36.9 inches of precipitation each year with 19.1 inches of snow.
| Stat | Springfield |
|---|---|
| Average Annual High | 63.0 |
| Average Annual Low | 42.6 |
| Annual Precipitation Days | 68.3 |
| Average Annual Precipitation | 36.9 |
| Average Annual Snowfall | 19.1 |
Average High
Days of Rain
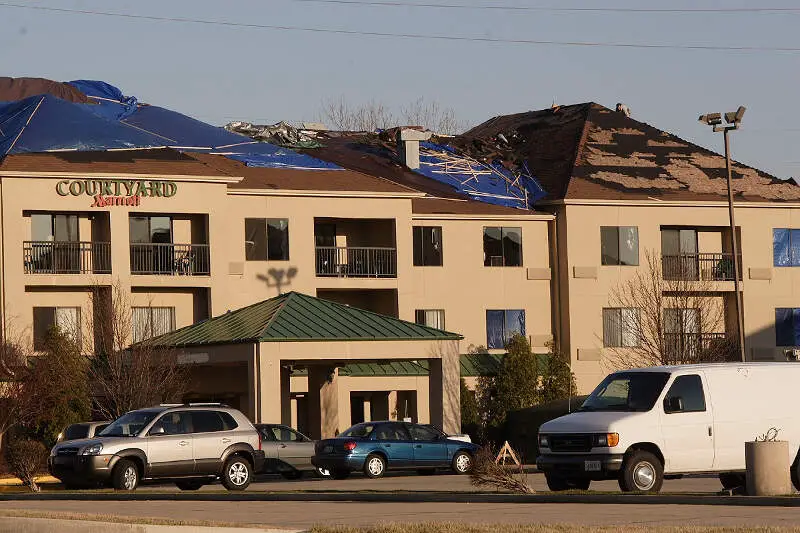
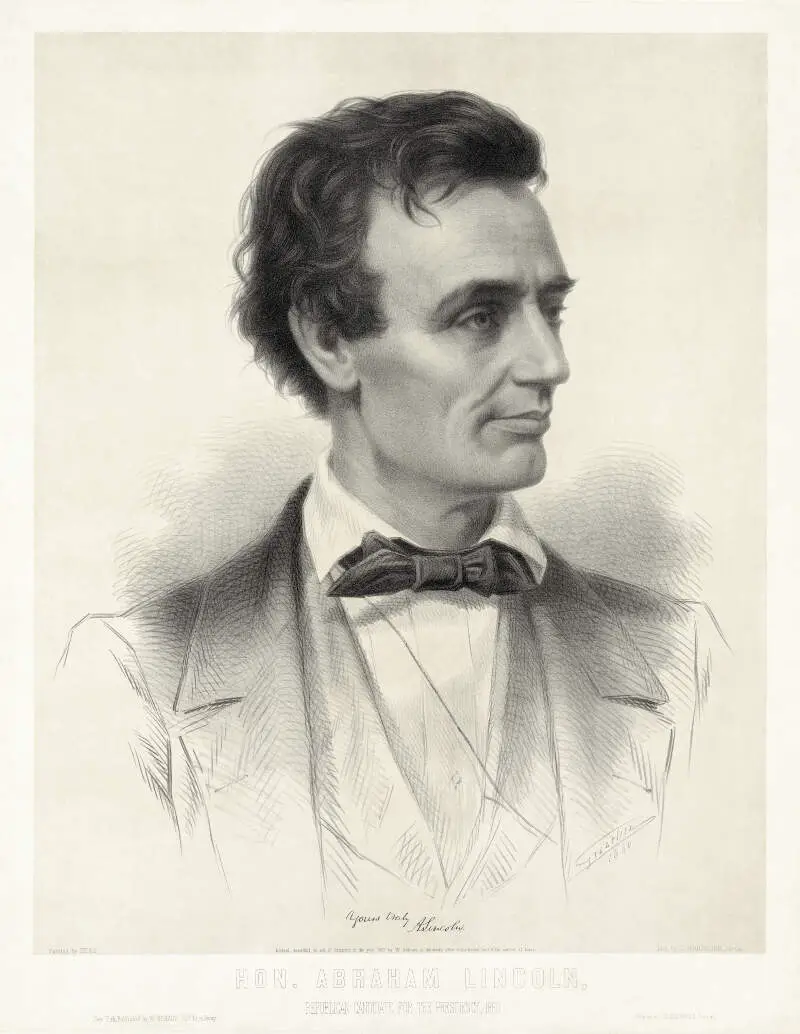
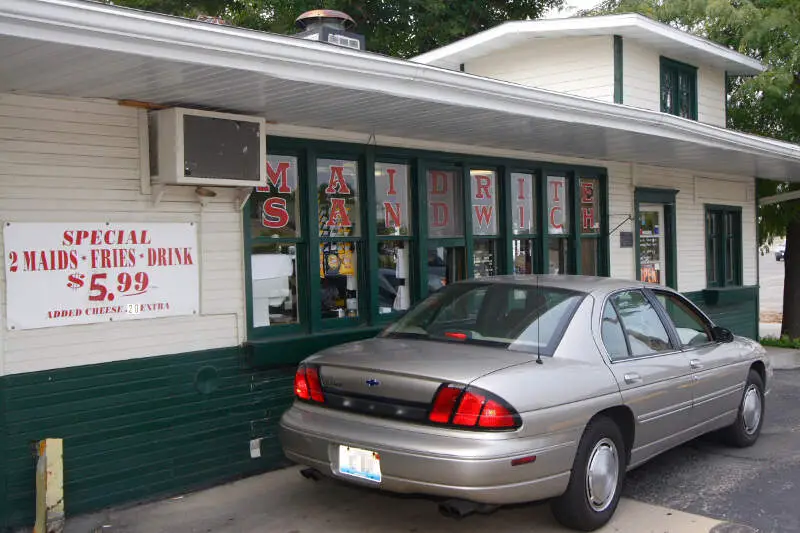
Springfield, IL Photos


Rankings for Springfield in Illinois


Locations Around Springfield
Map Of Springfield, IL
Best Places Around Springfield
Chatham, IL
Population 14,437
Mount Zion, IL
Population 6,255
Wilmington, IL
Population 124
Lincoln, IL
Population 13,371
Jacksonville, IL
Population 17,639
Clinton, IL
Population 6,889
Carlinville, IL
Population 5,724
Middletown, KY
Population 9,594
Pana, IL
Population 5,167
Beardstown, IL
Population 5,884
Springfield Demographics And Statistics
Population over time in Springfield
The current population in Springfield is 114,214. The population has decreased -0.8% from 2010.
| Year | Population | % Change |
|---|---|---|
| 2022 | 114,214 | -1.9% |
| 2021 | 116,459 | 0.1% |
| 2020 | 116,313 | -0.4% |
| 2019 | 116,745 | -0.3% |
| 2018 | 117,061 | 0.2% |
| 2017 | 116,815 | 0.3% |
| 2016 | 116,495 | 0.4% |
| 2015 | 115,982 | 0.3% |
| 2014 | 115,658 | 0.5% |
| 2013 | 115,121 | - |
Race / Ethnicity in Springfield
Springfield is:
69.7% White with 79,579 White residents.
20.1% African American with 22,961 African American residents.
0.1% American Indian with 125 American Indian residents.
3.0% Asian with 3,475 Asian residents.
0.0% Hawaiian with 0 Hawaiian residents.
0.3% Other with 289 Other residents.
3.7% Two Or More with 4,242 Two Or More residents.
3.1% Hispanic with 3,543 Hispanic residents.
| Race | Springfield | IL | USA |
|---|---|---|---|
| White | 69.7% | 59.6% | 58.9% |
| African American | 20.1% | 13.7% | 12.1% |
| American Indian | 0.1% | 0.1% | 0.6% |
| Asian | 3.0% | 5.7% | 5.7% |
| Hawaiian | 0.0% | 0.0% | 0.2% |
| Other | 0.3% | 0.3% | 0.4% |
| Two Or More | 3.7% | 2.8% | 3.5% |
| Hispanic | 3.1% | 17.8% | 18.7% |
Gender in Springfield
Springfield is 51.8% female with 59,157 female residents.
Springfield is 48.2% male with 55,056 male residents.
| Gender | Springfield | IL | USA |
|---|---|---|---|
| Female | 51.8% | 50.5% | 50.4% |
| Male | 48.2% | 49.5% | 49.6% |
Highest level of educational attainment in Springfield for adults over 25
3.0% of adults in Springfield completed < 9th grade.
6.0% of adults in Springfield completed 9-12th grade.
27.0% of adults in Springfield completed high school / ged.
21.0% of adults in Springfield completed some college.
8.0% of adults in Springfield completed associate's degree.
20.0% of adults in Springfield completed bachelor's degree.
10.0% of adults in Springfield completed master's degree.
4.0% of adults in Springfield completed professional degree.
1.0% of adults in Springfield completed doctorate degree.
| Education | Springfield | IL | USA |
|---|---|---|---|
| < 9th Grade | 3.0% | 6.0% | 4.0% |
| 9-12th Grade | 6.0% | 5.0% | 6.0% |
| High School / GED | 27.0% | 25.0% | 26.0% |
| Some College | 21.0% | 20.0% | 20.0% |
| Associate's Degree | 8.0% | 8.0% | 9.0% |
| Bachelor's Degree | 20.0% | 22.0% | 21.0% |
| Master's Degree | 10.0% | 11.0% | 10.0% |
| Professional Degree | 4.0% | 2.0% | 2.0% |
| Doctorate Degree | 1.0% | 1.0% | 2.0% |
Household Income For Springfield, Illinois
7.1% of households in Springfield earn Less than $10,000.
5.2% of households in Springfield earn $10,000 to $14,999.
8.2% of households in Springfield earn $15,000 to $24,999.
7.8% of households in Springfield earn $25,000 to $34,999.
12.5% of households in Springfield earn $35,000 to $49,999.
17.3% of households in Springfield earn $50,000 to $74,999.
12.2% of households in Springfield earn $75,000 to $99,999.
15.7% of households in Springfield earn $100,000 to $149,999.
7.4% of households in Springfield earn $150,000 to $199,999.
6.6% of households in Springfield earn $200,000 or more.
| Income | Springfield | IL | USA |
|---|---|---|---|
| Less than $10,000 | 7.1% | 5.3% | 4.9% |
| $10,000 to $14,999 | 5.2% | 3.5% | 3.8% |
| $15,000 to $24,999 | 8.2% | 6.7% | 7.0% |
| $25,000 to $34,999 | 7.8% | 7.1% | 7.4% |
| $35,000 to $49,999 | 12.5% | 10.1% | 10.7% |
| $50,000 to $74,999 | 17.3% | 15.4% | 16.1% |
| $75,000 to $99,999 | 12.2% | 12.9% | 12.8% |
| $100,000 to $149,999 | 15.7% | 17.6% | 17.1% |
| $150,000 to $199,999 | 7.4% | 9.4% | 8.8% |
| $200,000 or more | 6.6% | 12.1% | 11.4% |


