Selma, AL
Demographics And Statistics
Living In Selma, Alabama Summary
Life in Selma research summary. HomeSnacks has been using Saturday Night Science to research the quality of life in Selma over the past nine years using Census, FBI, Zillow, and other primary data sources. Based on the most recently available data, we found the following about life in Selma:
The population in Selma is 17,442.
The median home value in Selma is $69,055.
The median income in Selma is $32,184.
The cost of living in Selma is 83 which is 0.8x lower than the national average.
The median rent in Selma is $723.
The unemployment rate in Selma is 14.4%.
The poverty rate in Selma is 28.3%.
The average high in Selma is 75.6° and the average low is 52.8°.
Table Of Contents
Selma SnackAbility
Overall SnackAbility
Selma, AL Cost Of Living
Cost of living in Selma summary. We use data on the cost of living to determine how expensive it is to live in Selma. Real estate prices drive most of the variance in cost of living around Alabama. Key points include:
The cost of living in Selma is 83 with 100 being average.
The cost of living in Selma is 0.8x lower than the national average.
The median home value in Selma is $69,055.
The median income in Selma is $32,184.
Selma's Overall Cost Of Living
Lower Than The National Average
Cost Of Living In Selma Comparison Table
| Living Expense | Selma | Alabama | National Average | |
|---|---|---|---|---|
| Overall | 83 | 90 | 100 | |
| Services | 92 | 97 | 100 | |
| Groceries | 98 | 98 | 100 | |
| Health | 78 | 86 | 100 | |
| Housing | 55 | 74 | 100 | |
| Transportation | 94 | 93 | 100 | |
| Utilities | 105 | 102 | 100 | |
Selma, AL Weather
The average high in Selma is 75.6° and the average low is 52.8°.
There are 74.0 days of precipitation each year.
Expect an average of 52.8 inches of precipitation each year with 0.2 inches of snow.
| Stat | Selma |
|---|---|
| Average Annual High | 75.6 |
| Average Annual Low | 52.8 |
| Annual Precipitation Days | 74.0 |
| Average Annual Precipitation | 52.8 |
| Average Annual Snowfall | 0.2 |
Average High
Days of Rain
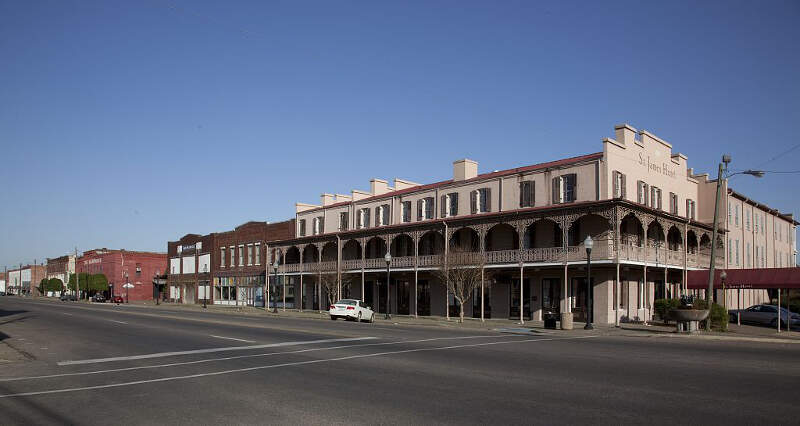
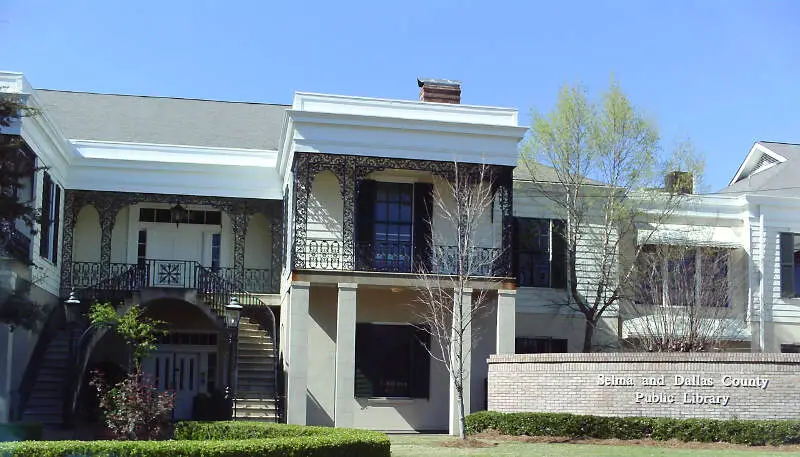
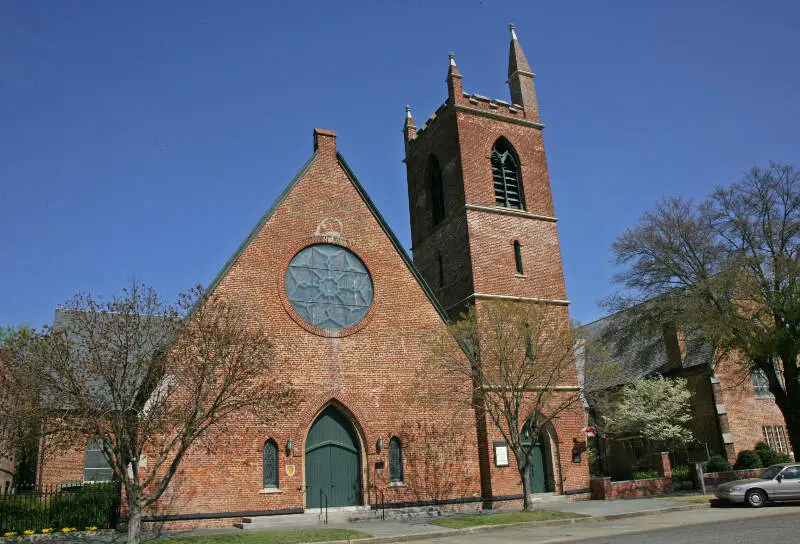
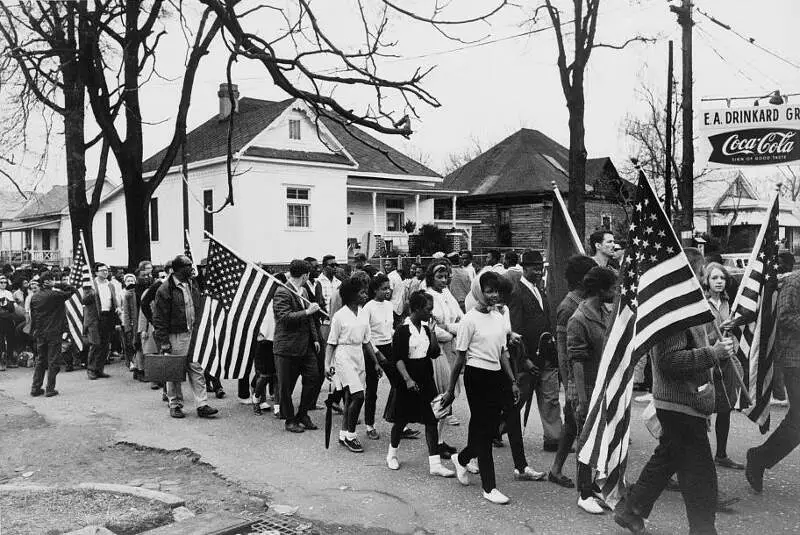
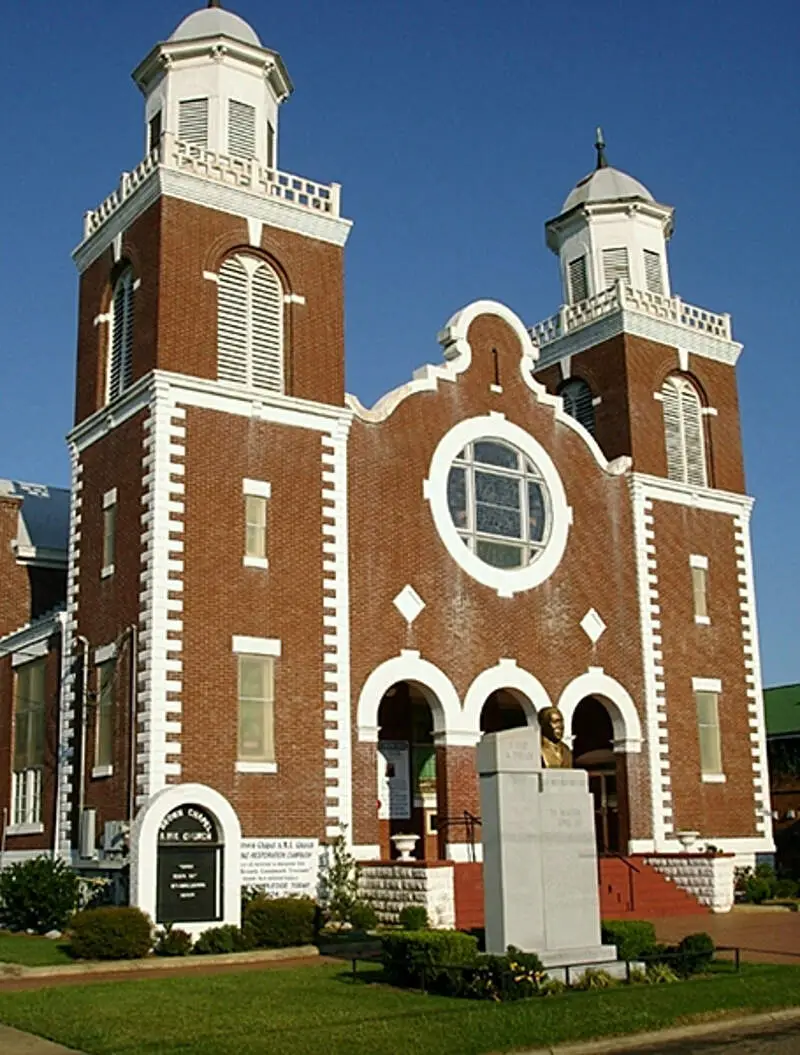
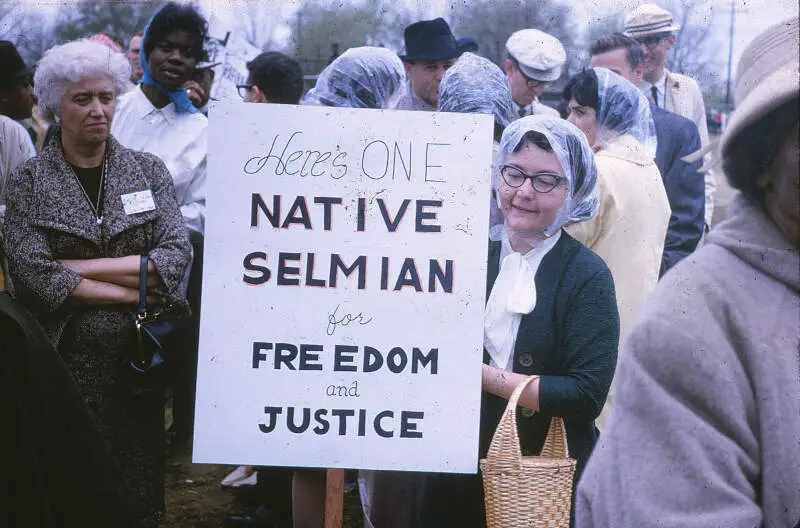
Selma, AL Photos


1 Reviews & Comments About Selma
/5

TheLittleDavies - None
I lived in Selma from the age of 2 to 11. It IS very dangerous. However, if you have a St. Bernard and help out everyone in the city, looking past race, you are respected. But yeah, no where near BHam.
Rankings for Selma in Alabama


Locations Around Selma
Map Of Selma, AL
Best Places Around Selma
Montgomery, AL
Population 198,440
Millbrook, AL
Population 16,923
Prattville, AL
Population 38,850
Selma Demographics And Statistics
Population over time in Selma
The current population in Selma is 17,442. The population has decreased -15.3% from 2010.
| Year | Population | % Change |
|---|---|---|
| 2023 | 17,442 | -2.4% |
| 2022 | 17,875 | -3.0% |
| 2021 | 18,429 | 3.8% |
| 2020 | 17,762 | -2.8% |
| 2019 | 18,276 | -2.8% |
| 2018 | 18,804 | -1.9% |
| 2017 | 19,176 | -2.4% |
| 2016 | 19,650 | -1.7% |
| 2015 | 19,987 | -1.4% |
| 2014 | 20,276 | -0.6% |
| 2013 | 20,391 | -0.8% |
| 2012 | 20,559 | -0.3% |
| 2011 | 20,623 | 0.2% |
| 2010 | 20,591 | - |
Race / Ethnicity in Selma
Selma is:
16.0% White with 2,788 White residents.
81.0% African American with 14,122 African American residents.
0.5% American Indian with 90 American Indian residents.
1.2% Asian with 210 Asian residents.
0.0% Hawaiian with 0 Hawaiian residents.
0.1% Other with 21 Other residents.
0.5% Two Or More with 84 Two Or More residents.
0.7% Hispanic with 127 Hispanic residents.
| Race | Selma | AL | USA |
|---|---|---|---|
| White | 16.0% | 63.8% | 58.2% |
| African American | 81.0% | 25.9% | 12.0% |
| American Indian | 0.5% | 0.3% | 0.5% |
| Asian | 1.2% | 1.4% | 5.7% |
| Hawaiian | 0.0% | 0.0% | 0.2% |
| Other | 0.1% | 0.3% | 0.5% |
| Two Or More | 0.5% | 2.9% | 3.9% |
| Hispanic | 0.7% | 5.4% | 19.0% |
Gender in Selma
Selma is 56.0% female with 9,761 female residents.
Selma is 44.0% male with 7,681 male residents.
| Gender | Selma | AL | USA |
|---|---|---|---|
| Female | 56.0% | 51.5% | 50.5% |
| Male | 44.0% | 48.5% | 49.5% |
Highest level of educational attainment in Selma for adults over 25
4.0% of adults in Selma completed < 9th grade.
8.0% of adults in Selma completed 9-12th grade.
35.0% of adults in Selma completed high school / ged.
23.0% of adults in Selma completed some college.
11.0% of adults in Selma completed associate's degree.
11.0% of adults in Selma completed bachelor's degree.
6.0% of adults in Selma completed master's degree.
1.0% of adults in Selma completed professional degree.
1.0% of adults in Selma completed doctorate degree.
| Education | Selma | AL | USA |
|---|---|---|---|
| < 9th Grade | 4.0% | 4.0% | 5.0% |
| 9-12th Grade | 8.0% | 8.0% | 6.0% |
| High School / GED | 35.0% | 30.0% | 26.0% |
| Some College | 23.0% | 21.0% | 19.0% |
| Associate's Degree | 11.0% | 9.0% | 9.0% |
| Bachelor's Degree | 11.0% | 17.0% | 21.0% |
| Master's Degree | 6.0% | 8.0% | 10.0% |
| Professional Degree | 1.0% | 2.0% | 2.0% |
| Doctorate Degree | 1.0% | 1.0% | 2.0% |
Household Income For Selma, Alabama
12.1% of households in Selma earn Less than $10,000.
10.7% of households in Selma earn $10,000 to $14,999.
19.7% of households in Selma earn $15,000 to $24,999.
9.9% of households in Selma earn $25,000 to $34,999.
12.6% of households in Selma earn $35,000 to $49,999.
14.7% of households in Selma earn $50,000 to $74,999.
8.0% of households in Selma earn $75,000 to $99,999.
7.6% of households in Selma earn $100,000 to $149,999.
3.0% of households in Selma earn $150,000 to $199,999.
1.8% of households in Selma earn $200,000 or more.
| Income | Selma | AL | USA |
|---|---|---|---|
| Less than $10,000 | 12.1% | 6.3% | 4.9% |
| $10,000 to $14,999 | 10.7% | 5.0% | 3.6% |
| $15,000 to $24,999 | 19.7% | 9.2% | 6.6% |
| $25,000 to $34,999 | 9.9% | 8.7% | 6.8% |
| $35,000 to $49,999 | 12.6% | 12.2% | 10.4% |
| $50,000 to $74,999 | 14.7% | 16.8% | 15.7% |
| $75,000 to $99,999 | 8.0% | 12.5% | 12.7% |
| $100,000 to $149,999 | 7.6% | 15.2% | 17.4% |
| $150,000 to $199,999 | 3.0% | 7.1% | 9.3% |
| $200,000 or more | 1.8% | 7.2% | 12.6% |


