Compare Tucson to…
Tucson SnackAbility
Overall SnackAbility
Crime in Tucson summary. We use data from the FBI to determine the crime rates in Tucson. Key points include:
There were 21,413 total crimes in Tucson in the last reporting year.
The overall crime rate per 100,000 people in Tucson is 3,901.9 / 100k people.
The violent crime rate per 100,000 people in Tucson is 588.8 / 100k people.
The property crime rate per 100,000 people in Tucson is 3,313.1 / 100k people.
Overall, crime in Tucson is 84.12% above the national average.
Total Crimes
Above National Average
Crime In Tucson Comparison Table
| Statistic | Count Raw |
Tucson / 100k People |
Arizona / 100k People |
National / 100k People |
|---|---|---|---|---|
| Total Crimes Per 100K | 21,413 | 3,901.9 | 2,214.0 | 2,119.2 |
| Violent Crime | 3,231 | 588.8 | 421.9 | 359.0 |
| Murder | 37 | 6.7 | 4.9 | 5.0 |
| Robbery | 593 | 108.1 | 64.6 | 61.0 |
| Aggravated Assault | 2,339 | 426.2 | 312.4 | 256.0 |
| Property Crime | 18,182 | 3,313.1 | 1,792.1 | 1,760.0 |
| Burglary | 1,629 | 296.8 | 217.8 | 229.0 |
| Larceny | 13,723 | 2,500.6 | 1,329.9 | 1,272.0 |
| Car Theft | 2,830 | 515.7 | 244.4 | 259.0 |
Source: FBI Uniform Crime Reporting (2024)
Cost of living in Tucson summary. We use data on the cost of living to determine how expensive it is to live in Tucson. Real estate prices drive most of the variance in cost of living around Arizona. Key points include:
The cost of living in Tucson is 102 with 100 being average.
The cost of living in Tucson is 1.0x higher than the national average.
The median home value in Tucson is $324,023.
The median income in Tucson is $57,073.
Tucson's Overall Cost Of Living
Higher Than The National Average
Cost Of Living In Tucson Comparison Table
| Living Expense | Tucson | Arizona | National Average |
|---|---|---|---|
| Overall | 102 | 100 | 100 |
| Services | 104 | 99 | 100 |
| Groceries | 102 | 99 | 100 |
| Health | 91 | 97 | 100 |
| Housing | 99 | 104 | 100 |
| Transportation | 112 | 113 | 100 |
| Utilities | 107 | 104 | 100 |
Source: Cost of living index, normalized to US average = 100
Tucson, AZ Weather
The average high in Tucson is 83.2° and the average low is 54.0°.
There are 30.8 days of precipitation each year.
Expect an average of 12.8 inches of precipitation each year with 0.7 inches of snow.
| Stat | Tucson |
|---|---|
| Average Annual High | 83.2 |
| Average Annual Low | 54.0 |
| Annual Precipitation Days | 30.8 |
| Average Annual Precipitation | 12.8 |
| Average Annual Snowfall | 0.7 |
Average High
Days of Rain
Source: NOAA climate normals (30-year)
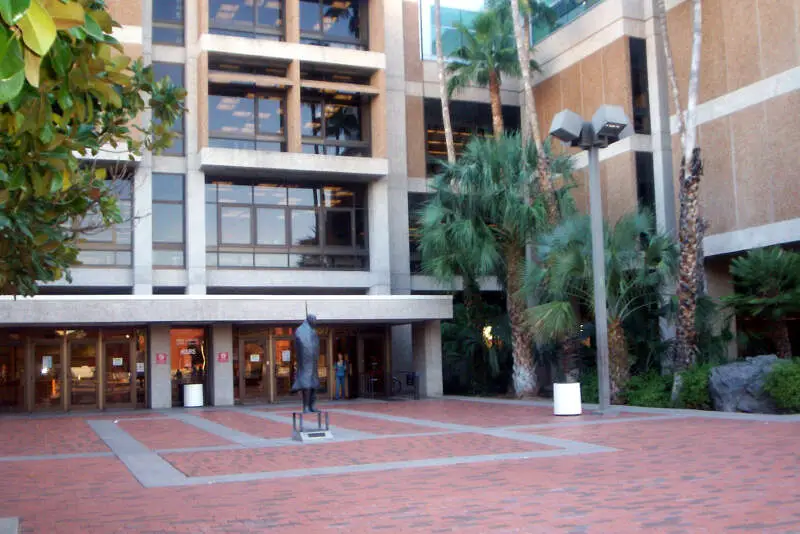
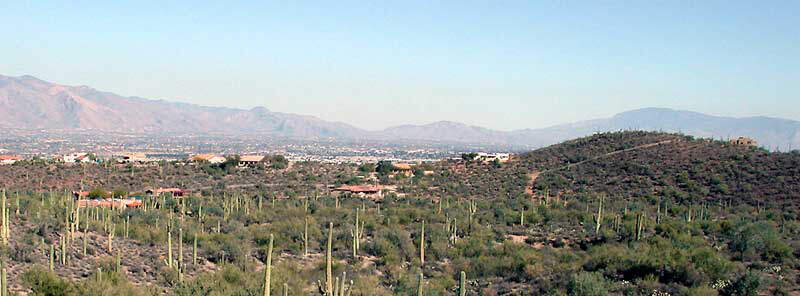
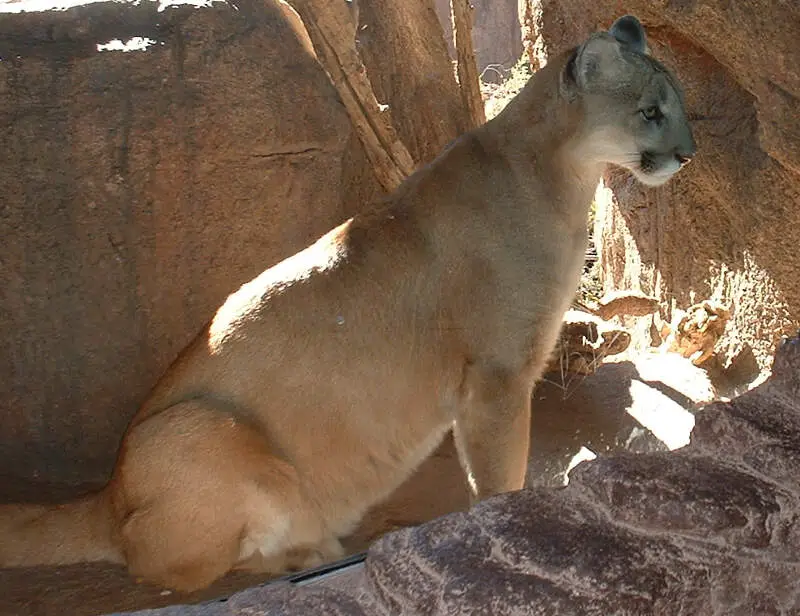
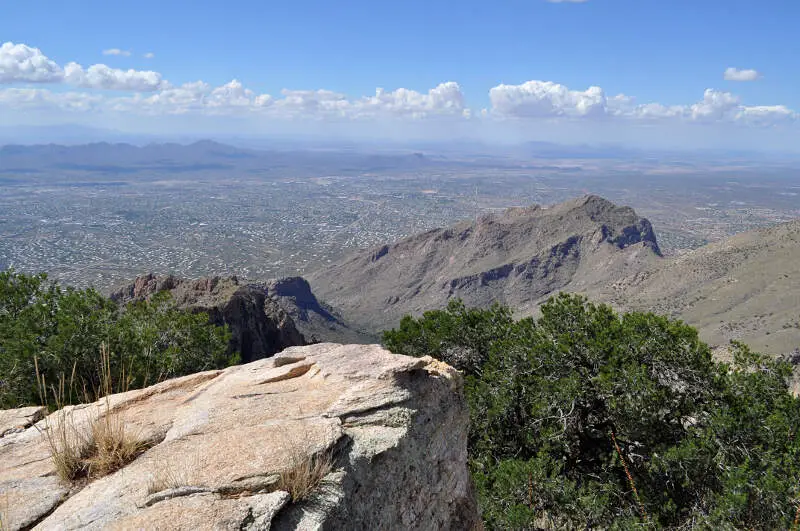
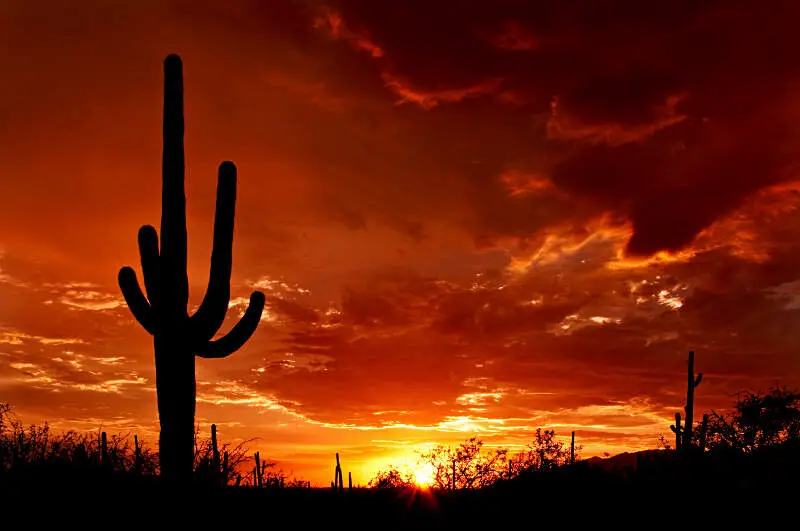
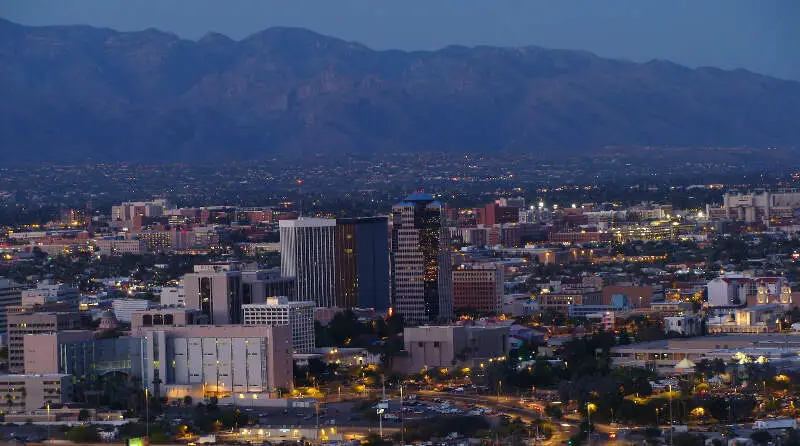
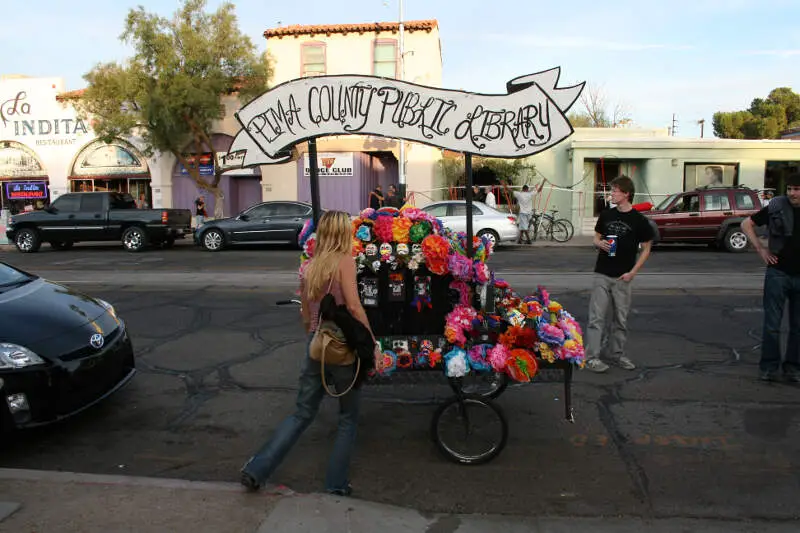
Tucson, AZ Photos


6 Reviews & Comments About Tucson

I live in Tucson now 14 years. Do not think the surrounding mountains is the only place you see snakes we got diamond back snakes i live central to east Tucson snakes here don't care where they sun bathe i came home one night to see a 15 inch baby diamond back in my front room my neighbor had one in her home too i've seen several of them one was sun bathing in my front yard another in the alley behind me. If you hike in Arizona better be prepared with proper clothing snake bite kit and plenty of ice water. People here dehydrate real quick. Different kind of heat than California. Rental prices have increased to California prices. Traffic s***s here there is only one freeway and it goes around Tucson I-10. Crime s***s here Tucson police are corrupt way too many people in Tucson.Tucson is multi cultural has many events every year lots of fine eateries it also has a huge drug problem.
I've lived in Tucson for 18 yrs. Like any other city you need to choose wisely what part of town you choose to reside. I live at the base of the Catalina Mtns and it's a beautiful view year round.
My electric bill this month was $50 and my gas bill this month was $43. I live on 1 1/2 beautiful acres with a well on my property. It's hot about 6-8 wks out of the year.
I'm originally from Texas and the heat is no worse here in the summer as where I lived in TX. Everyone should be as miserable where they live as I am in Tucson, AZ.
Oh, I forgot to mention gasoline right now 12019 is $2.34 a gallon.
I lived in Tucson in the 80's, thought it was acceptable back then.
idk ive lived here 7yrs. i exp everything you would in a typical life .........................................................................
food and the people....................................
Crime in Tucson was fairly limited to various areas throughout the city. As like all other locations, schools, environment, neighborhoods all had their ups and downs. But for the most part, it was a great place to be.
Tucson was great, the weather was perfect, if you can stand dry heat and hot temperatures. Just the atmosphere there was good. You have Phoenix an hour or so away, Vegas, California, all within hours of a drive. Worked on the military base there, and it was a large area, great jobs, great people. Loved going out downtown to the city and going to the various bars, clubs.
Crime is pretty stable, living in the city you always have to be careful. The great thing about Tucson it city but town feeling. You will always run into people you know and find nice people.
The university of Arizona is the heart of the city! The basketball is Tucson gold. You will find that everywhere you go someone is wearing Arizona wildcat shirt.
Rankings & Articles For Tucson


Locations Around Tucson
Map Of Tucson, AZ
Best Places Around Tucson
Oro Valley, AZ
Population 48,162
Corona de Tucson, AZ
Population 9,566
Catalina Foothills, AZ
Population 52,593
Vail, AZ
Population 16,315
Tanque Verde, AZ
Population 15,866
Sahuarita, AZ
Population 35,862
Casas Adobes, AZ
Population 72,059
Tucson Estates, AZ
Population 12,136
Valencia West, AZ
Population 14,728
Drexel Heights, AZ
Population 27,675
Tucson Demographics And Statistics
Population over time in Tucson
The current population in Tucson is 547,073. The population has increased 5.5% from 2010.
| Year | Population | % Change |
|---|---|---|
| 2024 | 547,073 | 0.7% |
| 2023 | 543,348 | 0.4% |
| 2022 | 541,033 | 0.5% |
| 2021 | 538,167 | -1.3% |
| 2020 | 545,340 | 0.7% |
| 2019 | 541,482 | 0.4% |
| 2018 | 539,216 | 1.6% |
| 2017 | 530,905 | 0.6% |
| 2016 | 527,586 | -0.1% |
| 2015 | 528,374 | 0.6% |
| 2014 | 525,031 | 0.3% |
| 2013 | 523,278 | 0.3% |
| 2012 | 521,695 | 0.1% |
| 2011 | 520,981 | 0.5% |
| 2010 | 518,457 | - |
Race / Ethnicity in Tucson
See the full breakdown
Tucson is:
43.3% White with 236,728 White residents.
4.8% African American with 26,020 African American residents.
1.2% American Indian with 6,800 American Indian residents.
3.1% Asian with 17,022 Asian residents.
0.2% Hawaiian with 836 Hawaiian residents.
0.4% Other with 2,135 Other residents.
4.3% Two Or More with 23,654 Two Or More residents.
42.8% Hispanic with 233,878 Hispanic residents.
| Race | Tucson | AZ | USA |
|---|---|---|---|
| White | 43.3% | 52.6% | 57.4% |
| African American | 4.8% | 4.4% | 11.9% |
| American Indian | 1.2% | 3.2% | 0.5% |
| Asian | 3.1% | 3.5% | 5.9% |
| Hawaiian | 0.2% | 0.2% | 0.2% |
| Other | 0.4% | 0.5% | 0.6% |
| Two Or More | 4.3% | 4.4% | 4.3% |
| Hispanic | 42.8% | 31.4% | 19.3% |
Gender in Tucson
See the full breakdown
Tucson is 50.4% female with 275,919 female residents.
Tucson is 49.6% male with 271,154 male residents.
| Gender | Tucson | AZ | USA |
|---|---|---|---|
| Female | 50.4% | 50.1% | 50.5% |
| Male | 49.6% | 49.9% | 49.5% |
Highest level of educational attainment in Tucson for adults over 25
See the full breakdown
5.0% of adults in Tucson completed < 9th grade.
7.0% of adults in Tucson completed 9-12th grade.
23.0% of adults in Tucson completed high school / ged.
25.0% of adults in Tucson completed some college.
9.0% of adults in Tucson completed associate's degree.
18.0% of adults in Tucson completed bachelor's degree.
9.0% of adults in Tucson completed master's degree.
2.0% of adults in Tucson completed professional degree.
2.0% of adults in Tucson completed doctorate degree.
| Education | Tucson | AZ | USA |
|---|---|---|---|
| < 9th Grade | 5.0% | 6.0% | 4.0% |
| 9-12th Grade | 7.0% | 6.0% | 6.0% |
| High School / GED | 23.0% | 23.0% | 26.0% |
| Some College | 25.0% | 23.0% | 19.0% |
| Associate's Degree | 9.0% | 9.0% | 9.0% |
| Bachelor's Degree | 18.0% | 20.0% | 22.0% |
| Master's Degree | 9.0% | 9.0% | 10.0% |
| Professional Degree | 2.0% | 2.0% | 2.0% |
| Doctorate Degree | 2.0% | 2.0% | 2.0% |
Household Income For Tucson, Arizona
See the full breakdown
7.0% of households in Tucson earn Less than $10,000.
4.4% of households in Tucson earn $10,000 to $14,999.
9.5% of households in Tucson earn $15,000 to $24,999.
9.4% of households in Tucson earn $25,000 to $34,999.
13.9% of households in Tucson earn $35,000 to $49,999.
17.3% of households in Tucson earn $50,000 to $74,999.
12.8% of households in Tucson earn $75,000 to $99,999.
14.4% of households in Tucson earn $100,000 to $149,999.
6.0% of households in Tucson earn $150,000 to $199,999.
5.0% of households in Tucson earn $200,000 or more.
| Income | Tucson | AZ | USA |
|---|---|---|---|
| Less than $10,000 | 7.0% | 5.0% | 5.0% |
| $10,000 to $14,999 | 4.4% | 2.7% | 3.4% |
| $15,000 to $24,999 | 9.5% | 5.8% | 6.3% |
| $25,000 to $34,999 | 9.4% | 6.6% | 6.6% |
| $35,000 to $49,999 | 13.9% | 10.5% | 10.1% |
| $50,000 to $74,999 | 17.3% | 16.5% | 15.5% |
| $75,000 to $99,999 | 12.8% | 13.5% | 12.6% |
| $100,000 to $149,999 | 14.4% | 18.4% | 17.5% |
| $150,000 to $199,999 | 6.0% | 9.4% | 9.6% |
| $200,000 or more | 5.0% | 11.6% | 13.4% |
Source: U.S. Census ACS 5-year estimates (2024)


