Are you looking for love in Missouri?
Or are you just hoping to hook up with a hot Missourian?
Either way, we’ve got you covered here.
If you live in Missouri, there’s a pretty good chance there are a lot of singles in your area. The Show Me State has plenty of people over 18 who aren’t married or in a serious relationship.
That’s great news for people who are single and looking to mingle.
So, where are the best cities for singles in Missouri? We used Saturday Night Science to find out.
30.0 median age · 12.0% married households
Data | Crime | Cost of living | Movers
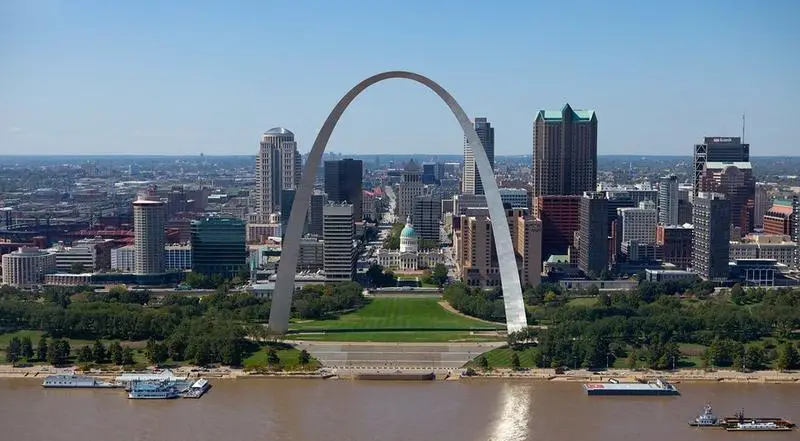
36.8 median age · 15.0% married households
St. Louis is an independent city and major U.S. port in the state of Missouri, built along the western bank of the Mississippi River, on the border with Illinois. The city had an estimated 2016 population of 311,404, and is the cultural and economic center of the Greater St. Louis area, making it the largest metropolitan area in Missouri and the 19th-largest in the United States.
Data | Crime | Cost of living | Movers | Compare
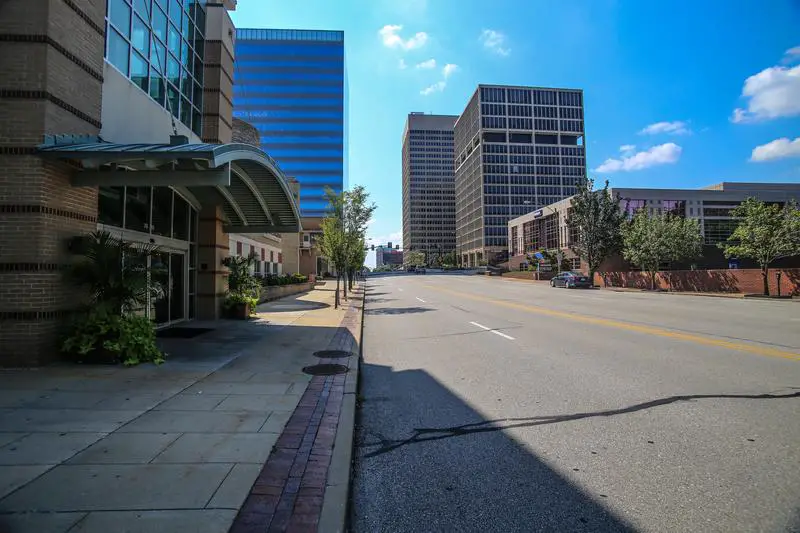
34.8 median age · 16.0% married households
St. Ann is an inner-ring suburb of St. Louis in mid St. Louis County, Missouri, United States. The population was 13,020 at the 2010 census.
Data | Crime | Cost of living | Movers
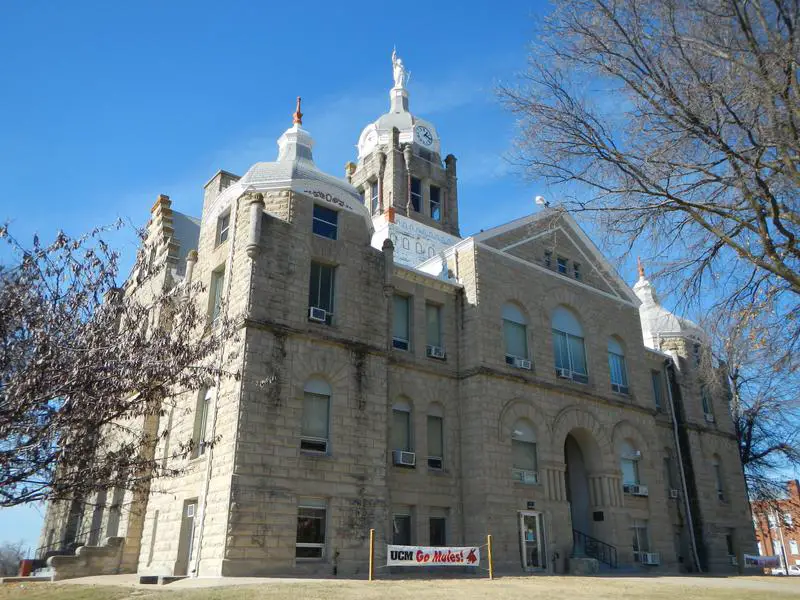
24.8 median age · 13.0% married households
Warrensburg is a city in Johnson County, Missouri, United States. The population was 18,838 at the 2010 census. It is the county seat of Johnson County. The Warrensburg Micropolitan Statistical Area consists of Johnson County. It is home to the University of Central Missouri.
Data | Crime | Cost of living | Movers
33.7 median age · 19.0% married households
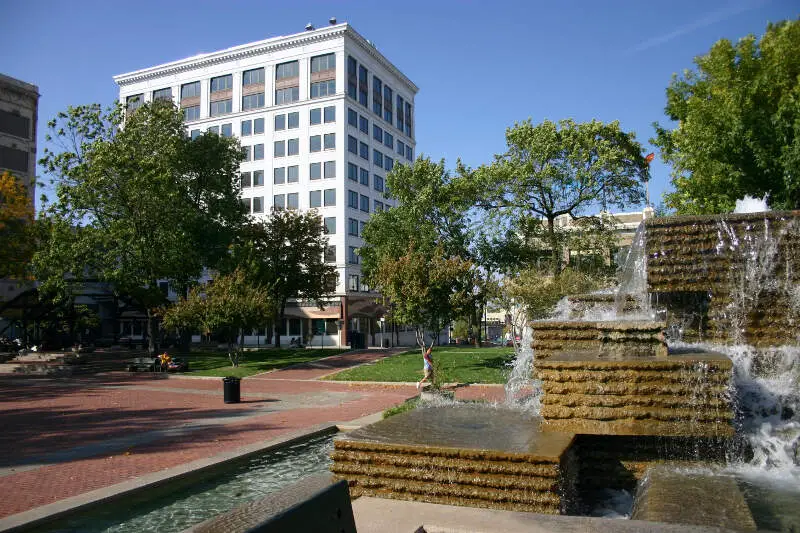
Springfield is the third-largest city in the state of Missouri and the county seat of Greene County. As of the 2010 census, its population was 159,498. As of 2016, the Census Bureau estimated its population at 167,319. It is one of the two principal cities of the Springfield-Branson Metropolitan Area, which has a population of 541,991 and includes the counties of Christian, Dallas, Greene, Polk, Webster, Stone and Taney. Springfield’s nickname is “Queen City of the Ozarks” and it is known as the “Birthplace of Route 66”. It is home to several universities, including Missouri State University, Drury University, and Evangel University.
Data | Crime | Cost of living | Movers
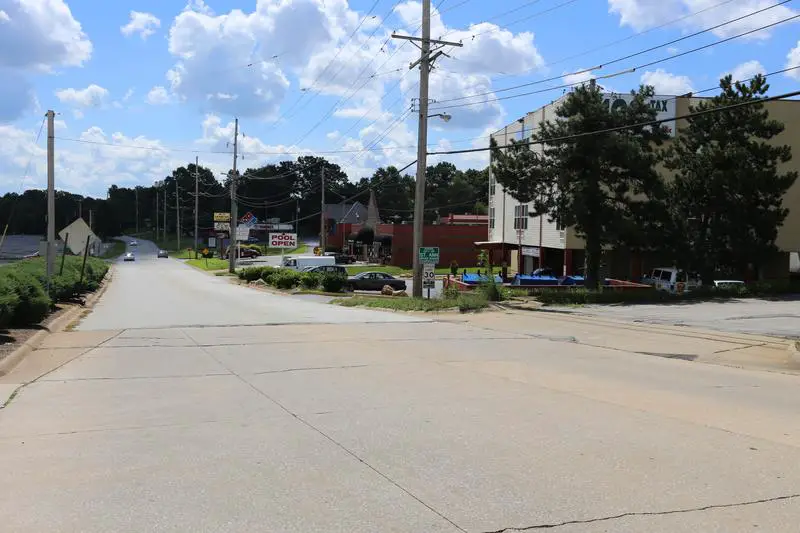
34.7 median age · 15.0% married households
Grandview is a city in Jackson County, Missouri, United States. The population was 24,475 at the 2010 census.
Data | Crime | Cost of living | Movers
29.5 median age · 18.0% married households
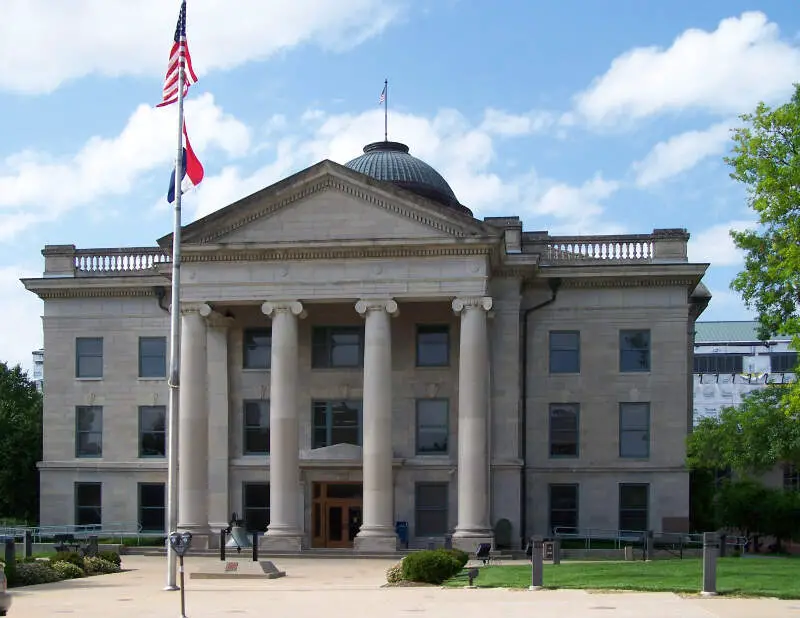
Columbia is a city in the U.S. state of Missouri and the county seat of Boone County. Founded in 1821, it is home to the University of Missouri and is the principal city of the Columbia metropolitan area. It is Missouri’s fourth most-populous city, with an estimated 120,612 residents in 2016. As a Midwestern college town, the city has a reputation for progressive politics, persuasive journalism, and public art. The tripartite establishment of Stephens College, the University of Missouri, and Columbia College, which surround the city’s central business district to the east, south, and north, has made Columbia a center of learning. At the center of Downtown is 8th Street, also known as the Avenue of the Columns, which connects Francis Quadrangle and Jesse Hall to the Boone County Courthouse and the City Hall. Never a major center of manufacturing, the city also depends on healthcare, insurance, and technology businesses. Companies such as Shelter Insurance, Carfax, and Slackers CDs and Games, were founded in the city. Cultural institutions include the State Historical Society of Missouri, the Museum of Art and Archaeology, and the annual True/False Film Festival. The Missouri Tigers, the state’s only major college athletic program, play football at Faurot Field and basketball at Mizzou Arena as members of the Southeastern Conference.
Data | Crime | Cost of living | Movers
25.2 median age · 15.0% married households
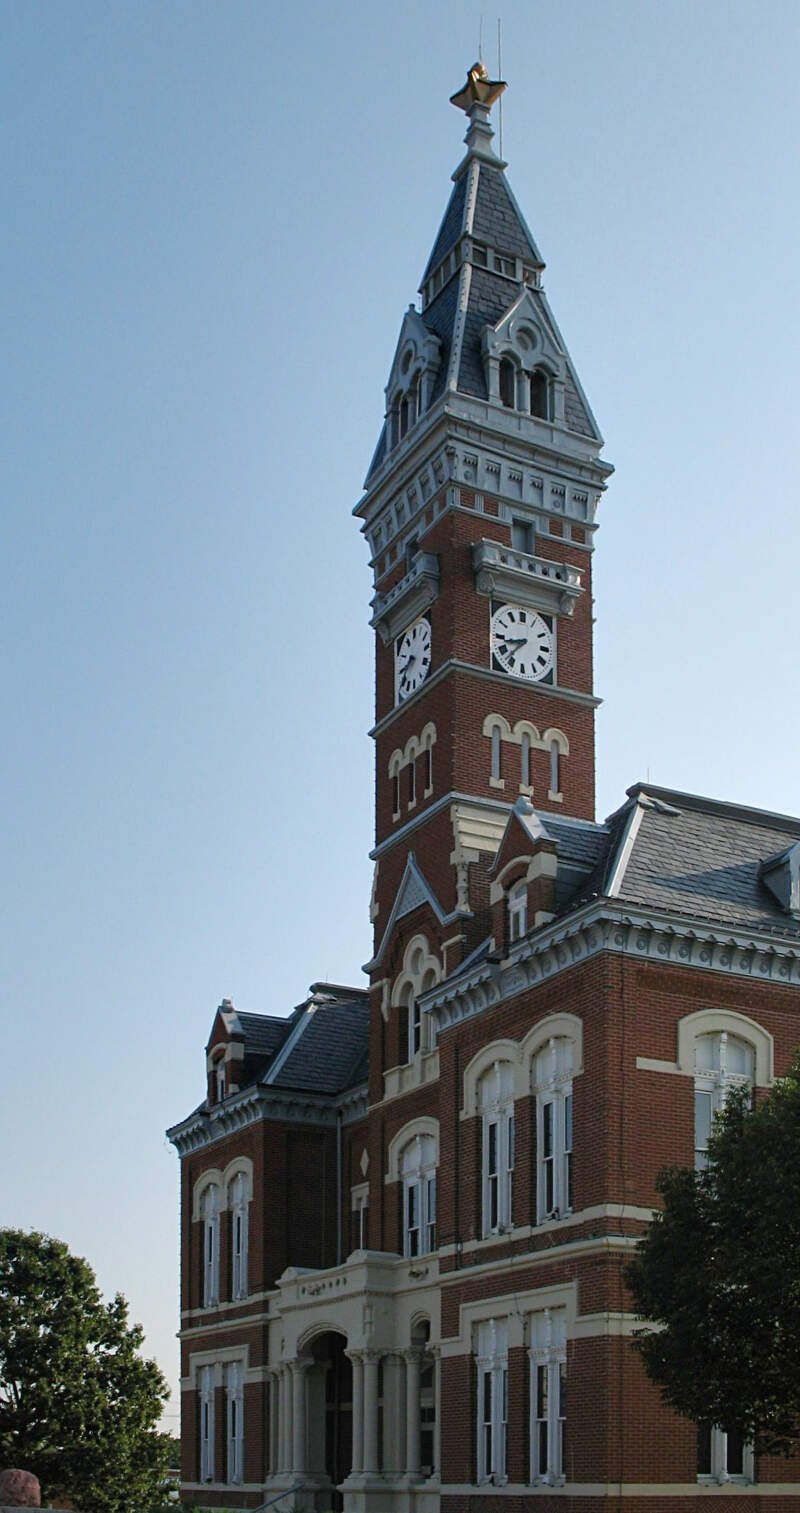
Maryville is a city and county seat of Nodaway County, Missouri, United States. As of the 2010 census, the city population was 11,972. Maryville is home to Northwest Missouri State University, Northwest Technical School, and the Missouri Academy of Science, Mathematics and Computing.
Data | Crime | Cost of living | Movers
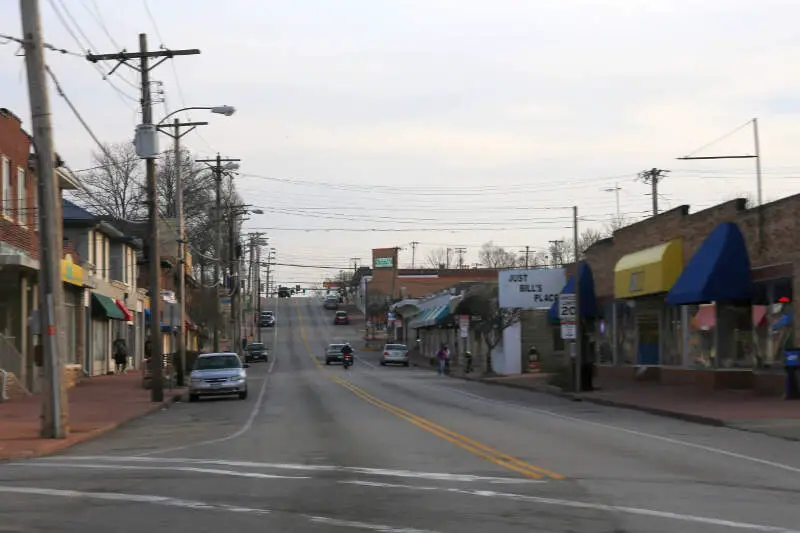
34.7 median age · 18.0% married households
Overland is a city in St. Louis County, Missouri, United States. The population was 16,062 at the 2010 census.
Data | Crime | Cost of living | Movers | Compare
35.6 median age · 19.0% married households
Data | Crime | Cost of living | Movers
The receipts
Compare the top ten
Pick a metric. The bars rescale. The red line is Missouri’s statewide median.
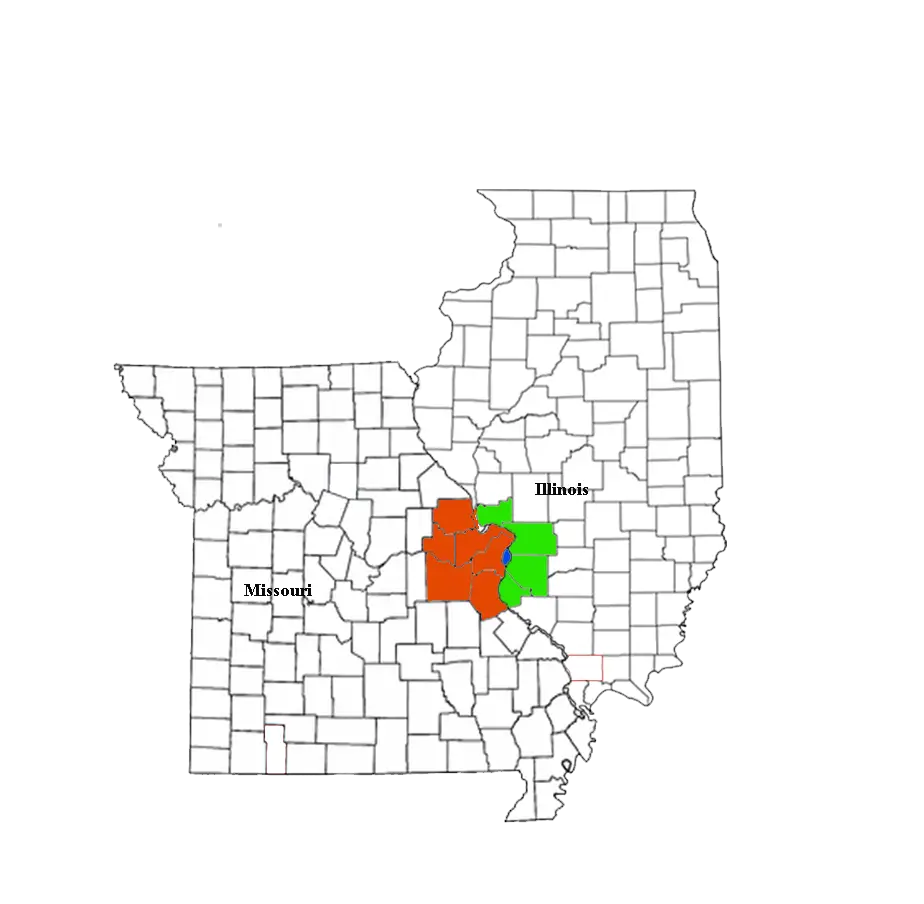
On the map
Where Missouri’s singles cluster
Saturday Night Science
Methodology: How do you determine which city is best for singles in Missouri anyways?
To give you the places in Missouri which are best for singles to find one another, we used Saturday Night Science to look at a handful of metrics. Of course, we want to measure the type of people who live in each city and make some assumptions about what single people like.
So we researched the internet for a database that contains all that information.
We threw a lot of criteria at this one to get the best, most complete results possible. Using the 2020-2024 American Community Survey Census data produced for the state of Missouri, we looked at every single city in the state. We paid particular attention to:
- Population density
- % of population that’s male vs. female (closer to a 50-50 ratio is better)
- % of households with kids
- Median age
- Number of unmarried people in each city
We then gave each city a “Singles Score.”
The higher the score, the better the city is for singles to find one another. We also limited our results to cities with over 10,000 people. For Missouri, that meant a total of 75 cities.
We updated this article for 2026. This is our eleventh time ranking the best cities for singles in Missouri.
Read on to see why Clayton is the talk of the town while Smithville is probably a bit on the bland side.
The full plate
Best Cities For Singles In Missouri
Click any column to sort. Search by city name.
| Rank | City | Singles Score | Population | Median Age | % Married Households | % Households w/ Kids |
|---|---|---|---|---|---|---|
| 1 | Clayton | 9.20 | 17,380 | 30.0 | 12.0% | 27.6% |
| 2 | St. Louis | 14.20 | 288,512 | 36.8 | 15.0% | 18.9% |
| 3 | St. Ann | 14.90 | 12,811 | 34.8 | 16.0% | 28.0% |
| 4 | Warrensburg | 15.10 | 19,582 | 24.8 | 13.0% | 23.9% |
| 5 | Springfield | 18.70 | 169,954 | 33.7 | 19.0% | 21.1% |
| 6 | Grandview | 18.80 | 26,527 | 34.7 | 15.0% | 26.6% |
| 7 | Columbia | 20.30 | 128,548 | 29.5 | 18.0% | 25.1% |
| 8 | Maryville | 20.70 | 10,428 | 25.2 | 15.0% | 19.7% |
| 9 | Overland | 21.90 | 15,695 | 34.7 | 18.0% | 28.0% |
| 10 | Maryland Heights | 22.90 | 27,880 | 35.6 | 19.0% | 25.6% |
| 11 | Kirksville | 23.20 | 17,563 | 24.8 | 15.0% | 24.4% |
| 12 | Rolla | 24.40 | 20,287 | 28.2 | 13.0% | 23.4% |
| 13 | Gladstone | 24.60 | 27,207 | 41.9 | 22.0% | 26.6% |
| 14 | St. Charles | 25.20 | 71,508 | 38.6 | 27.0% | 24.9% |
| 15 | St. Joseph | 25.90 | 71,236 | 38.1 | 25.0% | 26.5% |
| 16 | Marshall | 26.80 | 13,739 | 30.9 | 23.0% | 30.9% |
| 17 | Raytown | 27.00 | 29,445 | 40.9 | 20.0% | 26.1% |
| 18 | Cape Girardeau | 28.20 | 40,344 | 34.5 | 22.0% | 20.2% |
| 19 | Florissant | 30.30 | 51,773 | 37.6 | 24.0% | 28.3% |
| 20 | Joplin | 31.10 | 52,593 | 38.5 | 18.0% | 25.8% |
| 21 | Ferguson | 31.80 | 18,213 | 34.5 | 22.0% | 30.1% |
| 22 | Manchester | 31.90 | 18,160 | 38.2 | 28.0% | 36.2% |
| 23 | Hazelwood | 32.20 | 25,114 | 38.4 | 20.0% | 22.6% |
| 24 | Jennings | 32.50 | 12,918 | 39.4 | 13.0% | 27.9% |
| 25 | Independence | 33.00 | 121,740 | 39.0 | 23.0% | 26.4% |
| 26 | Sedalia | 33.20 | 22,003 | 37.3 | 25.0% | 29.2% |
| 27 | Poplar Bluff | 34.80 | 16,254 | 37.3 | 24.0% | 27.2% |
| 28 | Ballwin | 36.00 | 31,279 | 42.6 | 30.0% | 31.7% |
| 29 | Creve Coeur | 36.90 | 18,643 | 41.5 | 21.0% | 22.0% |
| 30 | Excelsior Springs | 37.10 | 10,484 | 35.9 | 29.0% | 32.2% |
| 31 | Bolivar | 37.50 | 11,170 | 34.1 | 22.0% | 28.8% |
| 32 | Lebanon | 37.60 | 15,270 | 37.4 | 19.0% | 33.3% |
| 33 | Blue Springs | 38.30 | 59,965 | 37.2 | 31.0% | 36.8% |
| 34 | Grain Valley | 38.60 | 16,271 | 35.2 | 32.0% | 38.9% |
| 35 | Lake St. Louis | 40.50 | 18,066 | 42.7 | 32.0% | 28.4% |
| 36 | Neosho | 40.90 | 13,224 | 33.0 | 18.0% | 34.3% |
| 37 | Branson | 41.10 | 12,817 | 39.3 | 14.0% | 20.1% |
| 38 | Kennett | 41.10 | 10,196 | 41.4 | 24.0% | 28.4% |
| 39 | Festus | 41.20 | 13,201 | 36.7 | 40.0% | 38.8% |
| 40 | Ozark | 41.50 | 22,417 | 33.8 | 21.0% | 45.8% |
| 41 | Nixa | 41.80 | 24,836 | 37.3 | 26.0% | 41.8% |
| 42 | Liberty | 42.40 | 30,689 | 37.8 | 27.0% | 34.4% |
| 43 | Crestwood | 42.40 | 12,295 | 42.4 | 41.0% | 28.8% |
| 44 | Webster Groves | 42.50 | 23,712 | 40.3 | 29.0% | 30.8% |
| 45 | O’Fallon | 43.00 | 93,801 | 38.4 | 33.0% | 36.8% |
| 46 | St. Peters | 43.80 | 59,092 | 41.0 | 34.0% | 26.8% |
| 47 | Fulton | 43.80 | 12,617 | 34.9 | 23.0% | 30.2% |
| 48 | Carthage | 43.90 | 15,574 | 32.2 | 19.0% | 45.7% |
| 49 | Chesterfield | 44.10 | 49,574 | 47.2 | 26.0% | 29.0% |
| 50 | Ellisville | 44.20 | 10,002 | 45.2 | 28.0% | 27.2% |
| 51 | Jackson | 44.30 | 15,659 | 37.1 | 37.0% | 32.0% |
| 52 | Mexico | 44.40 | 11,477 | 37.3 | 29.0% | 26.7% |
| 53 | Troy | 44.80 | 13,947 | 35.2 | 37.0% | 38.6% |
| 54 | Union | 45.30 | 12,781 | 33.3 | 31.0% | 36.5% |
| 55 | Wentzville | 45.60 | 47,061 | 36.5 | 36.0% | 44.6% |
| 56 | Kirkwood | 45.80 | 29,363 | 41.8 | 33.0% | 33.1% |
| 57 | Republic | 45.80 | 19,829 | 33.2 | 30.0% | 35.1% |
| 58 | West Plains | 46.30 | 12,441 | 36.3 | 25.0% | 29.6% |
| 59 | Belton | 46.60 | 25,008 | 36.8 | 25.0% | 34.9% |
| 60 | Farmington | 46.70 | 18,282 | 38.5 | 27.0% | 33.1% |
| 61 | Hannibal | 46.70 | 16,771 | 38.5 | 26.0% | 28.3% |
| 62 | Lee’s Summit | 46.80 | 103,656 | 38.8 | 30.0% | 34.7% |
| 63 | Arnold | 47.00 | 20,956 | 39.7 | 35.0% | 33.9% |
| 64 | Bellefontaine Neighbors | 47.00 | 10,498 | 41.9 | 24.0% | 32.5% |
| 65 | Town and Country | 47.20 | 11,607 | 48.7 | 28.0% | 29.7% |
| 66 | Raymore | 51.70 | 24,526 | 41.1 | 31.0% | 34.5% |
| 67 | Washington | 52.70 | 15,130 | 43.1 | 37.0% | 29.1% |
| 68 | Wildwood | 53.10 | 35,133 | 45.7 | 32.0% | 34.2% |
| 69 | Moberly | 53.60 | 13,526 | 39.4 | 29.0% | 33.9% |
| 70 | Sikeston | 54.90 | 16,320 | 38.2 | 30.0% | 31.5% |
| 71 | Eureka | 55.50 | 13,081 | 37.5 | 31.0% | 40.2% |
| 72 | Bridgeton | 55.60 | 11,369 | 40.9 | 26.0% | 34.3% |
| 73 | Kearney | 56.00 | 10,885 | 39.3 | 32.0% | 34.9% |
| 74 | Dardenne Prairie | 56.10 | 13,503 | 42.9 | 37.0% | 40.3% |
| 75 | Smithville | 57.50 | 10,705 | 37.4 | 30.0% | 40.3% |
Source: U.S. Census ACS 2020-2024. 75 cities with more than 10,000 residents.
Summary
Summary: The Best Cities For Singles In Missouri For 2026
If you’re looking for a breakdown of cities in Missouri ranked by criteria that most agree make a place a great spot for finding a single person (and potentially love), this is an accurate list.
The best cities for singles in Missouri are Clayton, St. Louis, St. Ann, Warrensburg, Springfield, Grandview, Columbia, Maryville, Overland, and Maryland Heights. Not sold on Missouri? Take the two-minute Find Your Place quiz and see which state actually fits you.


