Compare St. Louis to…
St. Louis SnackAbility
Overall SnackAbility
Crime in St. Louis summary. We use data from the FBI to determine the crime rates in St. Louis. Key points include:
There were 19,616 total crimes in St. Louis in the last reporting year.
The overall crime rate per 100,000 people in St. Louis is 7,074.1 / 100k people.
The violent crime rate per 100,000 people in St. Louis is 1,367.1 / 100k people.
The property crime rate per 100,000 people in St. Louis is 5,706.9 / 100k people.
Overall, crime in St. Louis is 233.80% above the national average.
Total Crimes
Above National Average
Crime In St. Louis Comparison Table
| Statistic | Count Raw |
St. Louis / 100k People |
Missouri / 100k People |
National / 100k People |
|---|---|---|---|---|
| Total Crimes Per 100K | 19,616 | 7,074.1 | 2,403.3 | 2,119.2 |
| Violent Crime | 3,791 | 1,367.1 | 462.0 | 359.0 |
| Murder | 150 | 54.1 | 7.8 | 5.0 |
| Robbery | 692 | 249.6 | 51.5 | 61.0 |
| Aggravated Assault | 2,788 | 1,005.4 | 357.5 | 256.0 |
| Property Crime | 15,825 | 5,706.9 | 1,941.2 | 1,760.0 |
| Burglary | 2,273 | 819.7 | 236.3 | 229.0 |
| Larceny | 9,462 | 3,412.3 | 1,306.5 | 1,272.0 |
| Car Theft | 4,090 | 1,475.0 | 398.4 | 259.0 |
Source: FBI Uniform Crime Reporting (2024)
Cost of living in St. Louis summary. We use data on the cost of living to determine how expensive it is to live in St. Louis. Real estate prices drive most of the variance in cost of living around Missouri. Key points include:
The cost of living in St. Louis is 89 with 100 being average.
The cost of living in St. Louis is 0.9x lower than the national average.
The median home value in St. Louis is $181,927.
The median income in St. Louis is $56,160.
St. Louis's Overall Cost Of Living
Lower Than The National Average
Cost Of Living In St. Louis Comparison Table
| Living Expense | St. Louis | Missouri | National Average |
|---|---|---|---|
| Overall | 89 | 90 | 100 |
| Services | 98 | 97 | 100 |
| Groceries | 96 | 98 | 100 |
| Health | 82 | 76 | 100 |
| Housing | 97 | 95 | 100 |
| Transportation | 96 | 94 | 100 |
| Utilities | 95 | 96 | 100 |
Source: Cost of living index, normalized to US average = 100
St. Louis, MO Weather
The average high in St. Louis is 65.9° and the average low is 46.9°.
There are 74.1 days of precipitation each year.
Expect an average of 42.5 inches of precipitation each year with 15.4 inches of snow.
| Stat | St. Louis |
|---|---|
| Average Annual High | 65.9 |
| Average Annual Low | 46.9 |
| Annual Precipitation Days | 74.1 |
| Average Annual Precipitation | 42.5 |
| Average Annual Snowfall | 15.4 |
Average High
Days of Rain
Source: NOAA climate normals (30-year)
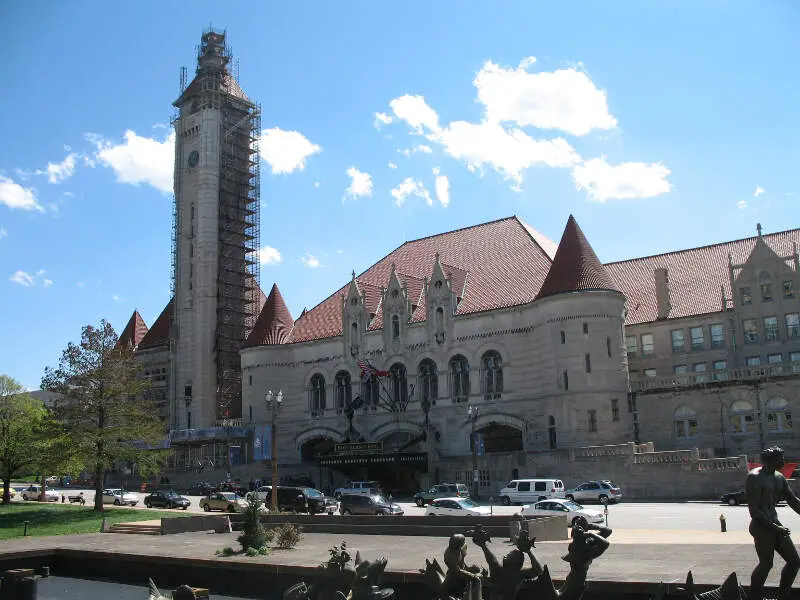
St. Louis, MO Photos


7 Reviews & Comments About St. Louis

MO has one of the best collages in the mid west and that is Washington University in St Louis. St Louis I hate to say is little Detroit. I dont want to say that because MO is the state I was born in outside the city of St Louis in Overland co.
I lived in St. Louis for 20 years. #1 in the nation for crime,l and drugs at the time. Not once did anything of mine ever get stolen, I was never a target of any criminal activity, I never feared for anything. Why- Because no one had a reason to bother me. I wasn't into drugs with them, I didn't punch my family members, and I wasn't out p*****g people off.
Statistics are real, but you have to take into account that most of these numbers aren't random acts of violence against normal people.
St Louis has the highest murder rate I think in the whole country! Even worse than Detroit..... I guess though in all honesty that besides all the crime in East STL it isn't that bad, I live in Western St Louis county in a million dollar house where house in my area range from $400,000 to in the millions.......
Okay I live in St. Louis and deadass the only times I hear bad things, is if you're from Downtown St. Louis. My dad used to work around there, but eventually left to get a higher paying job. The worst thing he encountered is a murder right outside of his store. A gunman shot a young girl, about 4/5, right there. That's all I know. And tbh I think some places in St. Louis aren't even that bad. Like where I live has a pretty good education and jobs, the crime rate isn't that high as well. Either way St. Louis has some con and pros, good and bad places.
So I live in St. Louis and lets just say this is all true you have to watch your back
The city area has a higher crime rate than the suburbs, but St. Louis is one of those cities that seems to exist mostly in the suburbs. Except for a renovated waterfront area and the ballpark, most of the attractions in St. Louis are in the outskirts of the city.
The Waterfront area is very pretty and has a neat amount of shops and the train station is very wonderful. St. Louis also has a great zoo. Navigating around the city is difficult, as the traffic and highway system is confusing.
Being in a new place is so different,everything is different but the people are great. I got tot meet some really good people along the way.
Of course the Arch stands out more than anything else in St. Louis. There is no bad side to it at all
Rankings & Articles For St. Louis


Locations Around St. Louis
Map Of St. Louis, MO
Best Places Around St. Louis
O'Fallon, IL
Population 32,262
Maryville, IL
Population 8,316
Shiloh, IL
Population 14,572
Swansea, IL
Population 14,710
Columbia, IL
Population 11,127
Edwardsville, IL
Population 26,474
Glen Carbon, IL
Population 13,977
Fairview Heights, IL
Population 16,745
Pontoon Beach, IL
Population 6,025
Collinsville, IL
Population 24,031
St. Louis Demographics And Statistics
Population over time in St. Louis
The current population in St. Louis is 288,512. The population has decreased 9.5% from 2010.
| Year | Population | % Change |
|---|---|---|
| 2024 | 288,512 | -1.6% |
| 2023 | 293,109 | -1.6% |
| 2022 | 298,018 | -1.6% |
| 2021 | 302,787 | -0.6% |
| 2020 | 304,709 | -1.1% |
| 2019 | 308,174 | -1.0% |
| 2018 | 311,273 | -1.1% |
| 2017 | 314,867 | -0.4% |
| 2016 | 316,030 | -0.6% |
| 2015 | 317,850 | -0.3% |
| 2014 | 318,727 | -0.1% |
| 2013 | 318,955 | 0.1% |
| 2012 | 318,527 | 0.1% |
| 2011 | 318,367 | -0.1% |
| 2010 | 318,809 | - |
Race / Ethnicity in St. Louis
See the full breakdown
St. Louis is:
44.4% White with 128,219 White residents.
42.1% African American with 121,473 African American residents.
0.2% American Indian with 433 American Indian residents.
3.5% Asian with 10,146 Asian residents.
0.0% Hawaiian with 77 Hawaiian residents.
0.5% Other with 1,303 Other residents.
4.0% Two Or More with 11,564 Two Or More residents.
5.3% Hispanic with 15,297 Hispanic residents.
| Race | St. Louis | MO | USA |
|---|---|---|---|
| White | 44.4% | 76.3% | 57.4% |
| African American | 42.1% | 10.9% | 11.9% |
| American Indian | 0.2% | 0.2% | 0.5% |
| Asian | 3.5% | 2.1% | 5.9% |
| Hawaiian | 0.0% | 0.1% | 0.2% |
| Other | 0.5% | 0.4% | 0.6% |
| Two Or More | 4.0% | 4.8% | 4.3% |
| Hispanic | 5.3% | 5.2% | 19.3% |
Gender in St. Louis
See the full breakdown
St. Louis is 51.5% female with 148,716 female residents.
St. Louis is 48.5% male with 139,796 male residents.
| Gender | St. Louis | MO | USA |
|---|---|---|---|
| Female | 51.5% | 50.7% | 50.5% |
| Male | 48.5% | 49.3% | 49.5% |
Highest level of educational attainment in St. Louis for adults over 25
See the full breakdown
3.0% of adults in St. Louis completed < 9th grade.
6.0% of adults in St. Louis completed 9-12th grade.
24.0% of adults in St. Louis completed high school / ged.
19.0% of adults in St. Louis completed some college.
7.0% of adults in St. Louis completed associate's degree.
23.0% of adults in St. Louis completed bachelor's degree.
12.0% of adults in St. Louis completed master's degree.
3.0% of adults in St. Louis completed professional degree.
3.0% of adults in St. Louis completed doctorate degree.
| Education | St. Louis | MO | USA |
|---|---|---|---|
| < 9th Grade | 3.0% | 4.0% | 4.0% |
| 9-12th Grade | 6.0% | 5.0% | 6.0% |
| High School / GED | 24.0% | 30.0% | 26.0% |
| Some College | 19.0% | 21.0% | 19.0% |
| Associate's Degree | 7.0% | 8.0% | 9.0% |
| Bachelor's Degree | 23.0% | 20.0% | 22.0% |
| Master's Degree | 12.0% | 9.0% | 10.0% |
| Professional Degree | 3.0% | 2.0% | 2.0% |
| Doctorate Degree | 3.0% | 1.0% | 2.0% |
Household Income For St. Louis, Missouri
See the full breakdown
8.7% of households in St. Louis earn Less than $10,000.
6.5% of households in St. Louis earn $10,000 to $14,999.
8.5% of households in St. Louis earn $15,000 to $24,999.
8.7% of households in St. Louis earn $25,000 to $34,999.
12.5% of households in St. Louis earn $35,000 to $49,999.
17.2% of households in St. Louis earn $50,000 to $74,999.
11.1% of households in St. Louis earn $75,000 to $99,999.
13.3% of households in St. Louis earn $100,000 to $149,999.
6.8% of households in St. Louis earn $150,000 to $199,999.
6.8% of households in St. Louis earn $200,000 or more.
| Income | St. Louis | MO | USA |
|---|---|---|---|
| Less than $10,000 | 8.7% | 4.9% | 5.0% |
| $10,000 to $14,999 | 6.5% | 3.8% | 3.4% |
| $15,000 to $24,999 | 8.5% | 7.1% | 6.3% |
| $25,000 to $34,999 | 8.7% | 7.8% | 6.6% |
| $35,000 to $49,999 | 12.5% | 11.9% | 10.1% |
| $50,000 to $74,999 | 17.2% | 17.4% | 15.5% |
| $75,000 to $99,999 | 11.1% | 13.2% | 12.6% |
| $100,000 to $149,999 | 13.3% | 17.1% | 17.5% |
| $150,000 to $199,999 | 6.8% | 8.2% | 9.6% |
| $200,000 or more | 6.8% | 8.7% | 13.4% |
Source: U.S. Census ACS 5-year estimates (2024)


