Compare Ferguson to…
Ferguson SnackAbility
Overall SnackAbility
Crime in Ferguson summary. We use data from the FBI to determine the crime rates in Ferguson. Key points include:
There were 751 total crimes in Ferguson in the last reporting year.
The overall crime rate per 100,000 people in Ferguson is 4,210.8 / 100k people.
The violent crime rate per 100,000 people in Ferguson is 712.1 / 100k people.
The property crime rate per 100,000 people in Ferguson is 3,498.7 / 100k people.
Overall, crime in Ferguson is 98.70% above the national average.
Total Crimes
Above National Average
Crime In Ferguson Comparison Table
| Statistic | Count Raw |
Ferguson / 100k People |
Missouri / 100k People |
National / 100k People |
|---|---|---|---|---|
| Total Crimes Per 100K | 751 | 4,210.8 | 2,403.3 | 2,119.2 |
| Violent Crime | 127 | 712.1 | 462.0 | 359.0 |
| Murder | 6 | 33.6 | 7.8 | 5.0 |
| Robbery | 22 | 123.4 | 51.5 | 61.0 |
| Aggravated Assault | 94 | 527.1 | 357.5 | 256.0 |
| Property Crime | 624 | 3,498.7 | 1,941.2 | 1,760.0 |
| Burglary | 99 | 555.1 | 236.3 | 229.0 |
| Larceny | 364 | 2,040.9 | 1,306.5 | 1,272.0 |
| Car Theft | 161 | 902.7 | 398.4 | 259.0 |
Source: FBI Uniform Crime Reporting (2024)
Cost of living in Ferguson summary. We use data on the cost of living to determine how expensive it is to live in Ferguson. Real estate prices drive most of the variance in cost of living around Missouri. Key points include:
The cost of living in Ferguson is 87 with 100 being average.
The cost of living in Ferguson is 0.9x lower than the national average.
The median home value in Ferguson is $116,377.
The median income in Ferguson is $47,524.
Ferguson's Overall Cost Of Living
Lower Than The National Average
Cost Of Living In Ferguson Comparison Table
| Living Expense | Ferguson | Missouri | National Average |
|---|---|---|---|
| Overall | 87 | 90 | 100 |
| Services | 98 | 97 | 100 |
| Groceries | 94 | 98 | 100 |
| Health | 58 | 76 | 100 |
| Housing | 99 | 95 | 100 |
| Transportation | 95 | 94 | 100 |
| Utilities | 96 | 96 | 100 |
Source: Cost of living index, normalized to US average = 100
Ferguson, MO Weather
The average high in Ferguson is 65.8° and the average low is 47.2°.
There are 71.4 days of precipitation each year.
Expect an average of 41.7 inches of precipitation each year with 15.9 inches of snow.
| Stat | Ferguson |
|---|---|
| Average Annual High | 65.8 |
| Average Annual Low | 47.2 |
| Annual Precipitation Days | 71.4 |
| Average Annual Precipitation | 41.7 |
| Average Annual Snowfall | 15.9 |
Average High
Days of Rain
Source: NOAA climate normals (30-year)
Ferguson, MO Photos


2 Reviews & Comments About Ferguson

I'm 'Ferguson Strong'...Ferguson is a nice place to live, and we will heal, rebuild, and grow from this tragedy!!! I live in Ferguson, and Ferguson will heal, rebuild, and grow, but we can't until all these people go home and stay home. Ferguson was the nerdiest city in St. Louis County until the riot happened!!!
99.9% of Ferguson is perfectly fine. That one block in Ferguson is labeling the whole community. This is all media hype for ratings and votes. Ferguson is a nice place to live...one dumb a*s cocky cop and one innocent young man doesn't define us.
I just wish all these reporters, hooligans, BS politicians, bootleg preachers, and media attention whores would ALL KEEP FERGUSON OUT OF THEIR MOUTHS!!!! Also, 98% of those hooligans did not live in Ferguson... they only reason for being there was for chaos and mayhem!!!!!
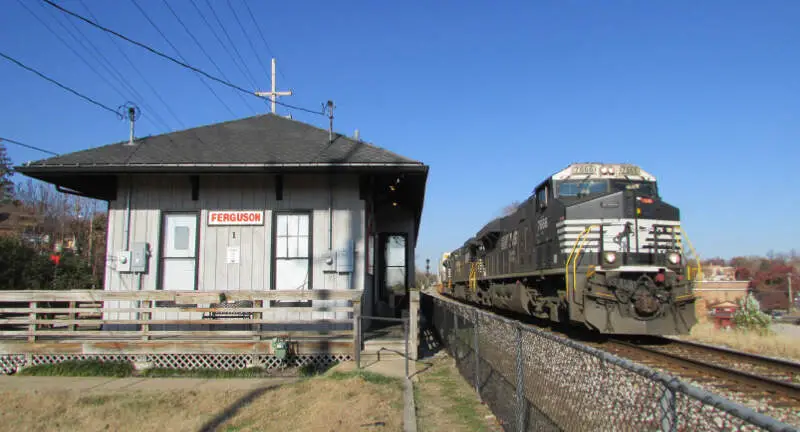
I moved to Ferguson July of 2016. I took advantage of lowered property values to buy a fantastic Victorian-era house. The picture used for the story is probably the poorest choice imaginable. Go a block south, and you will see new buildings, great resteraunts, and a great area. I love my neighborhood and town, and it is getting a bad rap with this story.
Rankings & Articles For Ferguson


Locations Around Ferguson
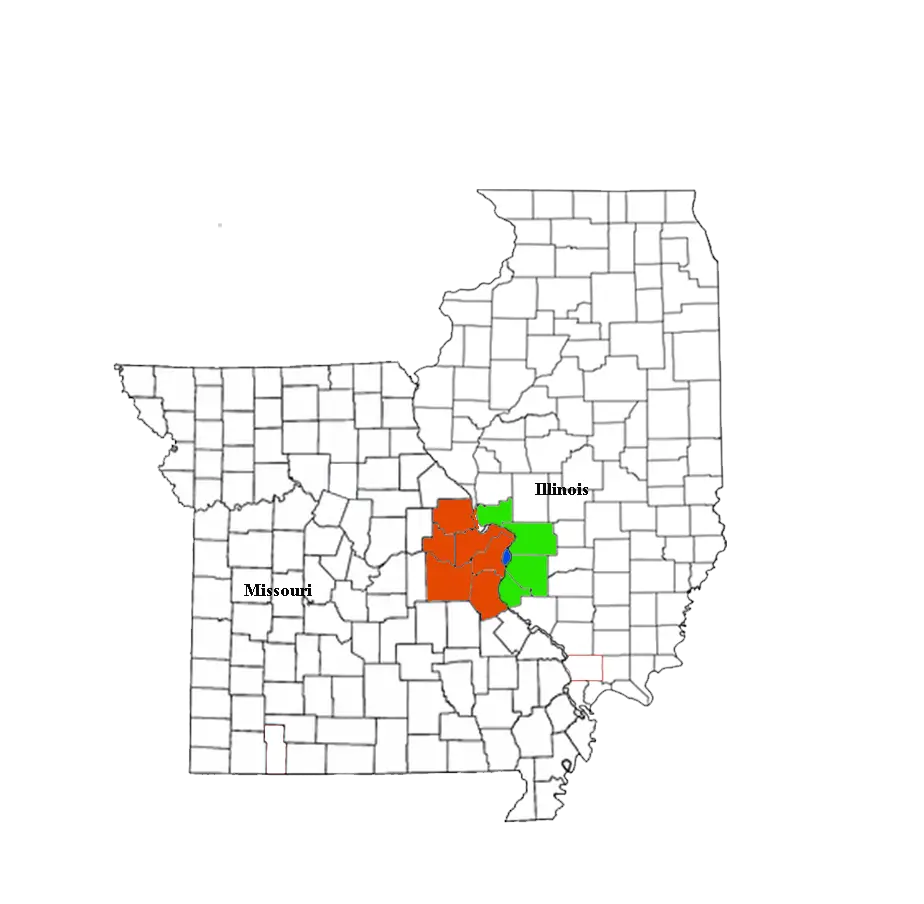
Map Of Ferguson, MO
Best Places Around Ferguson
Maryville, IL
Population 8,316
Edwardsville, IL
Population 26,474
Bethalto, IL
Population 9,239
Glen Carbon, IL
Population 13,977
Godfrey, IL
Population 17,712
Fairview Heights, IL
Population 16,745
Pontoon Beach, IL
Population 6,025
Collinsville, IL
Population 24,031
Wood River, IL
Population 10,279
Ballwin, MO
Population 31,279
Ferguson Demographics And Statistics
Population over time in Ferguson
The current population in Ferguson is 18,213. The population has decreased 14.6% from 2010.
| Year | Population | % Change |
|---|---|---|
| 2024 | 18,213 | -0.7% |
| 2023 | 18,350 | -1.1% |
| 2022 | 18,546 | -1.5% |
| 2021 | 18,826 | -8.7% |
| 2020 | 20,631 | -0.5% |
| 2019 | 20,738 | -0.9% |
| 2018 | 20,931 | 0.0% |
| 2017 | 20,927 | -0.5% |
| 2016 | 21,035 | -0.4% |
| 2015 | 21,120 | -0.1% |
| 2014 | 21,151 | -0.1% |
| 2013 | 21,164 | -0.2% |
| 2012 | 21,205 | -0.3% |
| 2011 | 21,269 | -0.3% |
| 2010 | 21,339 | - |
Race / Ethnicity in Ferguson
See the full breakdown
Ferguson is:
25.8% White with 4,706 White residents.
68.7% African American with 12,510 African American residents.
0.0% American Indian with 3 American Indian residents.
0.1% Asian with 18 Asian residents.
0.0% Hawaiian with 0 Hawaiian residents.
1.2% Other with 216 Other residents.
2.9% Two Or More with 525 Two Or More residents.
1.3% Hispanic with 235 Hispanic residents.
| Race | Ferguson | MO | USA |
|---|---|---|---|
| White | 25.8% | 76.3% | 57.4% |
| African American | 68.7% | 10.9% | 11.9% |
| American Indian | 0.0% | 0.2% | 0.5% |
| Asian | 0.1% | 2.1% | 5.9% |
| Hawaiian | 0.0% | 0.1% | 0.2% |
| Other | 1.2% | 0.4% | 0.6% |
| Two Or More | 2.9% | 4.8% | 4.3% |
| Hispanic | 1.3% | 5.2% | 19.3% |
Gender in Ferguson
See the full breakdown
Ferguson is 54.8% female with 9,973 female residents.
Ferguson is 45.2% male with 8,240 male residents.
| Gender | Ferguson | MO | USA |
|---|---|---|---|
| Female | 54.8% | 50.7% | 50.5% |
| Male | 45.2% | 49.3% | 49.5% |
Highest level of educational attainment in Ferguson for adults over 25
See the full breakdown
3.0% of adults in Ferguson completed < 9th grade.
7.0% of adults in Ferguson completed 9-12th grade.
35.0% of adults in Ferguson completed high school / ged.
27.0% of adults in Ferguson completed some college.
7.0% of adults in Ferguson completed associate's degree.
14.0% of adults in Ferguson completed bachelor's degree.
7.0% of adults in Ferguson completed master's degree.
0.0% of adults in Ferguson completed professional degree.
0.0% of adults in Ferguson completed doctorate degree.
| Education | Ferguson | MO | USA |
|---|---|---|---|
| < 9th Grade | 3.0% | 4.0% | 4.0% |
| 9-12th Grade | 7.0% | 5.0% | 6.0% |
| High School / GED | 35.0% | 30.0% | 26.0% |
| Some College | 27.0% | 21.0% | 19.0% |
| Associate's Degree | 7.0% | 8.0% | 9.0% |
| Bachelor's Degree | 14.0% | 20.0% | 22.0% |
| Master's Degree | 7.0% | 9.0% | 10.0% |
| Professional Degree | 0.0% | 2.0% | 2.0% |
| Doctorate Degree | 0.0% | 1.0% | 2.0% |
Household Income For Ferguson, Missouri
See the full breakdown
5.8% of households in Ferguson earn Less than $10,000.
4.9% of households in Ferguson earn $10,000 to $14,999.
9.4% of households in Ferguson earn $15,000 to $24,999.
15.9% of households in Ferguson earn $25,000 to $34,999.
17.3% of households in Ferguson earn $35,000 to $49,999.
17.9% of households in Ferguson earn $50,000 to $74,999.
11.6% of households in Ferguson earn $75,000 to $99,999.
10.8% of households in Ferguson earn $100,000 to $149,999.
3.6% of households in Ferguson earn $150,000 to $199,999.
2.8% of households in Ferguson earn $200,000 or more.
| Income | Ferguson | MO | USA |
|---|---|---|---|
| Less than $10,000 | 5.8% | 4.9% | 5.0% |
| $10,000 to $14,999 | 4.9% | 3.8% | 3.4% |
| $15,000 to $24,999 | 9.4% | 7.1% | 6.3% |
| $25,000 to $34,999 | 15.9% | 7.8% | 6.6% |
| $35,000 to $49,999 | 17.3% | 11.9% | 10.1% |
| $50,000 to $74,999 | 17.9% | 17.4% | 15.5% |
| $75,000 to $99,999 | 11.6% | 13.2% | 12.6% |
| $100,000 to $149,999 | 10.8% | 17.1% | 17.5% |
| $150,000 to $199,999 | 3.6% | 8.2% | 9.6% |
| $200,000 or more | 2.8% | 8.7% | 13.4% |
Source: U.S. Census ACS 5-year estimates (2024)


