
Are you looking for love in New Jersey?
Or are you just hoping to hook up with a hot New Jerseyan?
Either way, we’ve got you covered here.
If you live in New Jersey, there’s a pretty good chance there are a lot of singles in your area. The Garden State has plenty of people over 18 who aren’t married or in a serious relationship.
That’s great news for people who are single and looking to mingle.
So, where are the best cities for singles in New Jersey? We used Saturday Night Science to find out.
Table Of Contents: Top Ten | Methodology | Summary | Table
The 10 Best Cities For Singles In New Jersey For 2025
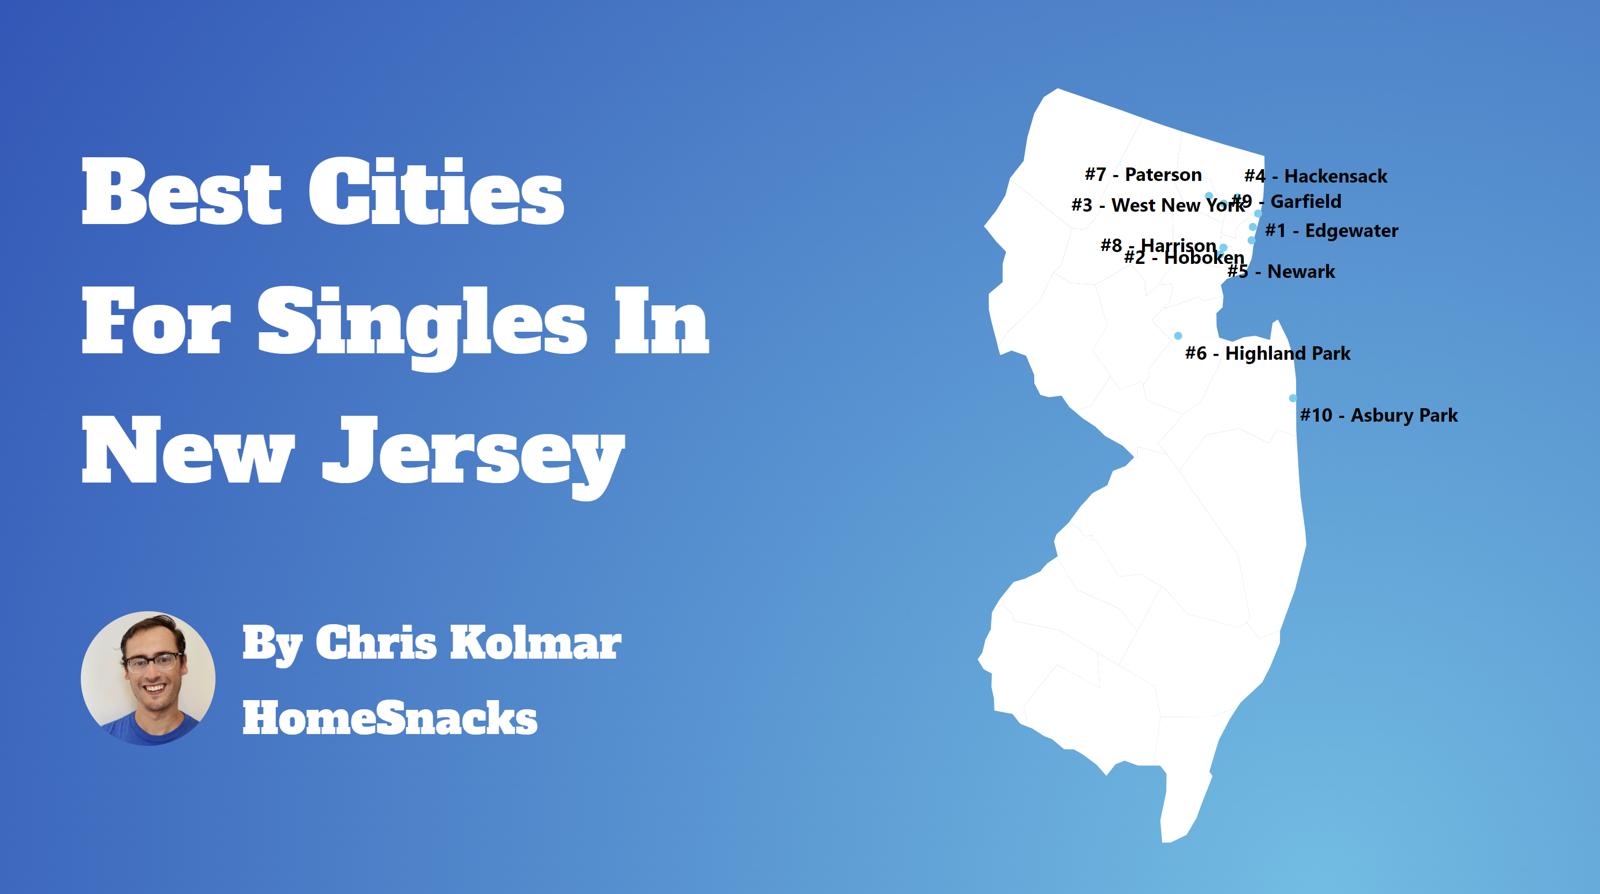
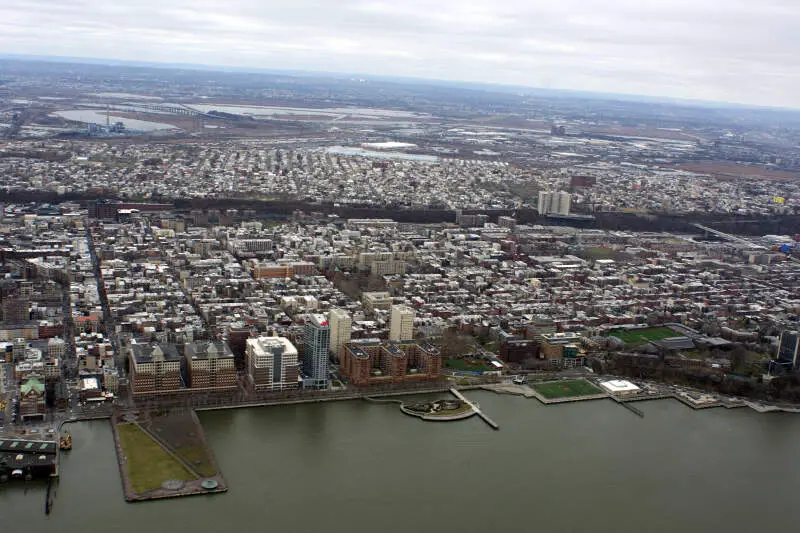
So, what was the best city for singles in New Jersey? Hoboken ranks as the best place for singles in New Jersey if you care about things singles care about, like nightlife, affordable housing, and other singles.
Read below to see how we crunched the numbers and how each city ranked. If you live in or are close to one of these cities and are single, you should probably get out more often.
Just saying.
For more New Jersey reading, check out:
- Best Places To Live In New Jersey
- Cheapest Places To Live In New Jersey
- Most Dangerous Cities In New Jersey
The 10 Best Cities For Singles In New Jersey For 2025

/10
Population: 58,340
Median Age: 31.9
Married households: 10.0%
Households with kids: 20.6%
More on Hoboken: Data


/10
Population: 14,544
Median Age: 39.9
Married households: 5.0%
Households with kids: 19.4%
More on Edgewater: Data

/10
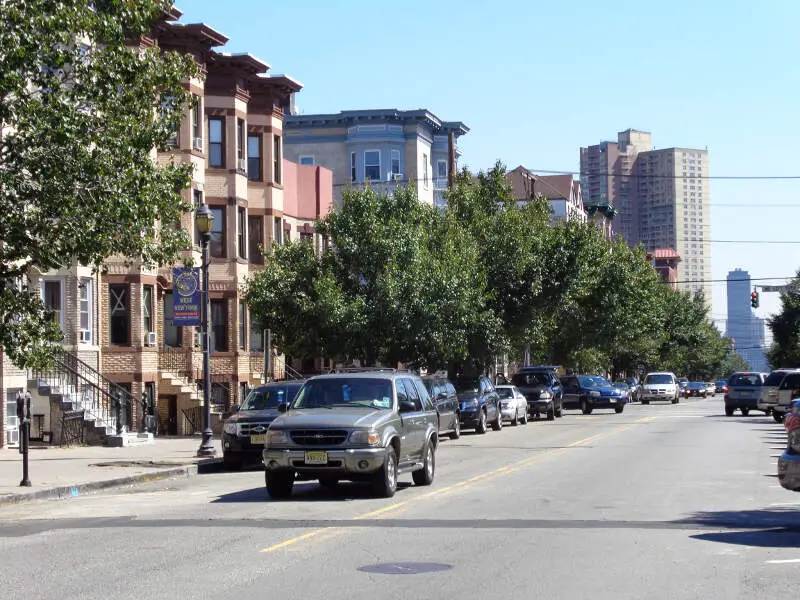
Population: 51,683
Median Age: 37.3
Married households: 3.0%
Households with kids: 28.9%
More on West New York: Data

If he had added a corruption metric, West New York would be #1. But we can’t be first in anything.

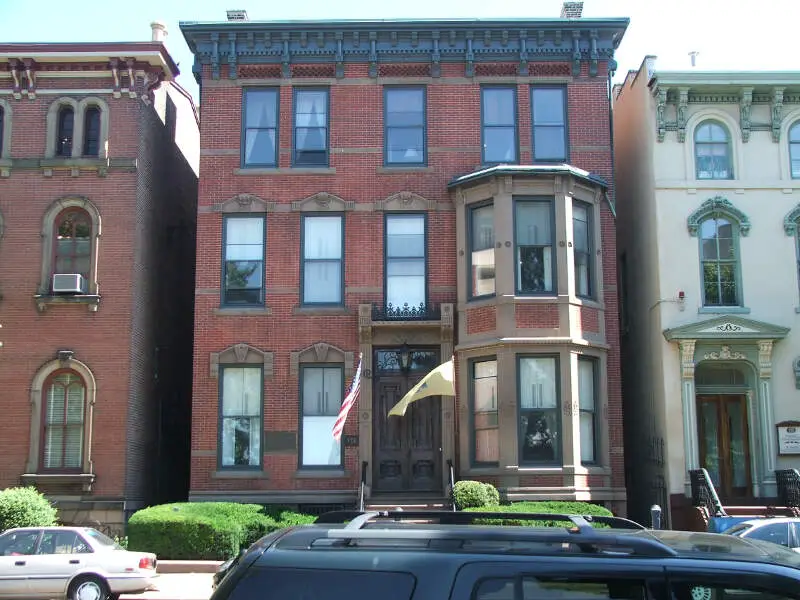
/10
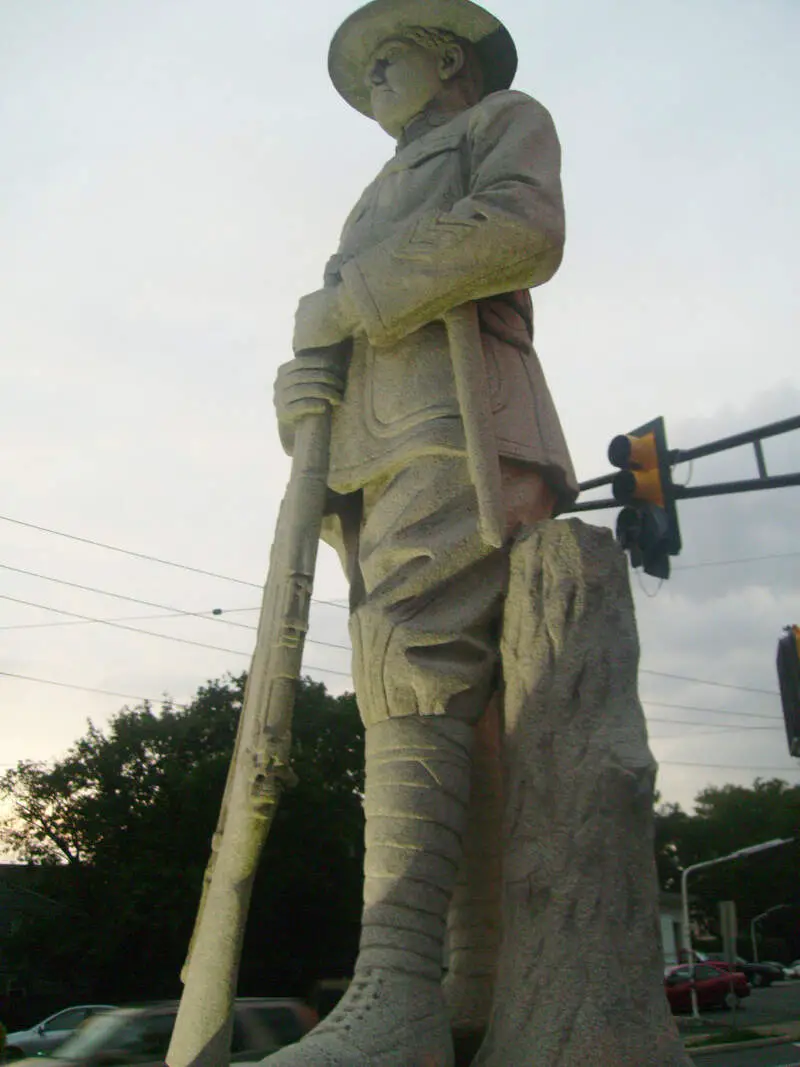
Population: 14,981
Median Age: 34.6
Married households: 10.0%
Households with kids: 25.1%
More on Highland Park: Data

/10
Population: 25,580
Median Age: 41.0
Married households: 9.0%
Households with kids: 24.1%
More on Cliffside Park: Data


/10
Population: 45,768
Median Age: 41.5
Married households: 6.0%
Households with kids: 20.6%
More on Hackensack: Data


/10
Population: 307,188
Median Age: 34.8
Married households: 6.0%
Households with kids: 34.0%
More on Newark: Data
There are schools, colleges and several indian stores.
Niagra is my favourite place. It is awesome

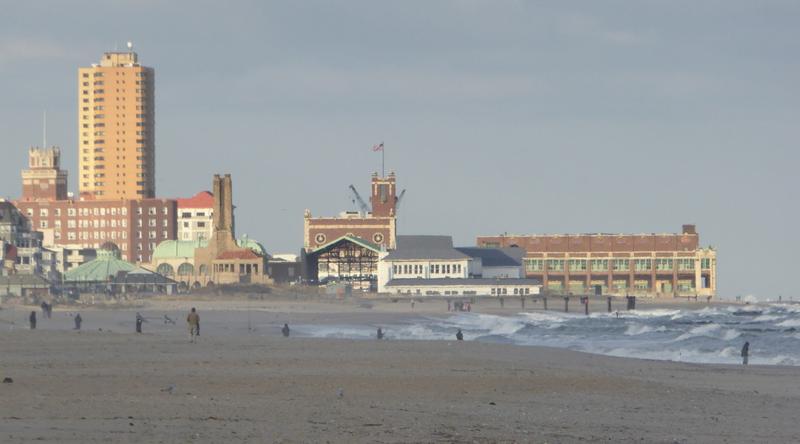
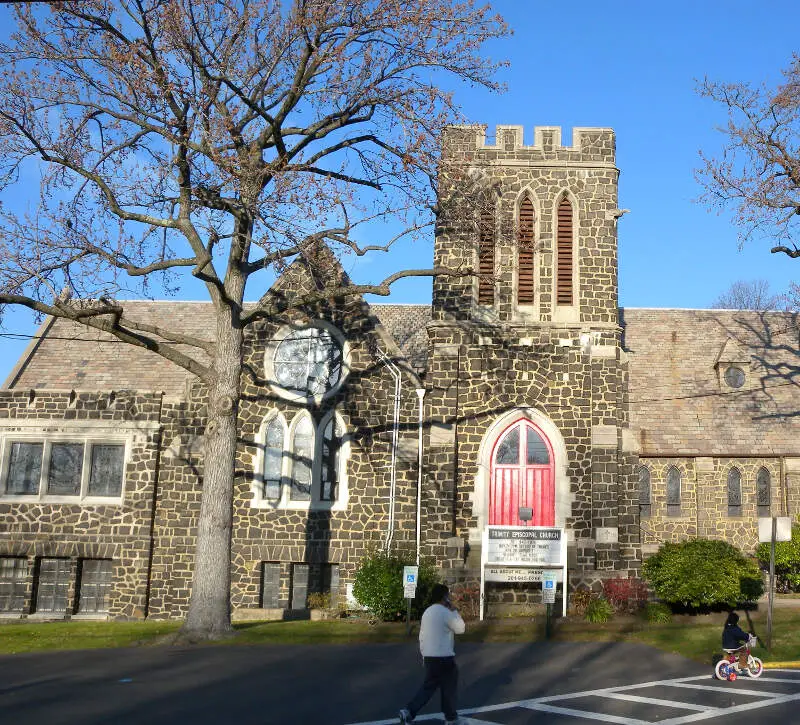
/10
Population: 15,239
Median Age: 38.3
Married households: 12.0%
Households with kids: 16.4%
More on Asbury Park: Data
There are so many things to do in Asbury Park, and you will never be bored! From restaurants, to venues, to bars and so much more, you will find something you’ll love.
My favorite places in Asbury Park are The Beach Bar and Biergarten. Both are different, but so much fun. I also love the beach!

/10
Population: 89,966
Median Age: 35.4
Married households: 8.0%
Households with kids: 30.1%
More on Trenton: Data
I grew up in Trenton. It was close to everything, malls, food, and shops. You name it! We kept our doors unlocked and everyone knew their neighbor. It wasn’t a very rich city but people were friendly and there was low crime. Fast forward to today, 39 years later, things are a lot different. Shops are closed, crime is high, streets a loaded with trash and everyone is fighting each other. No one goes to Trenton anymore.
I wouldn’t recommend a trip to Trenton unless you are visiting relatives or have an appointment during the day with a business. Bullets are always crossing the streets from gang fights. I’d recommend going else where.

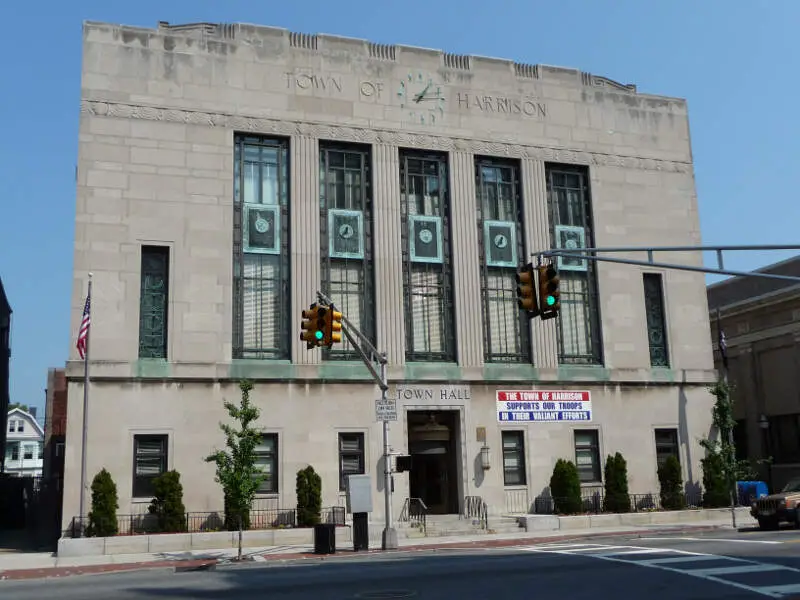
/10
Population: 19,599
Median Age: 33.8
Married households: 7.0%
Households with kids: 23.4%
More on Harrison: Data
Methodology: How do you determine which city is best for singles in New Jersey anyways?
To give you the places in New Jersey which are best for singles to find one another, we used Saturday Night Science to look at a handful of metrics. Of course, we want to measure the type of people who live in each city and make some assumptions about what single people like.
So we researched the internet for a database that contains all that information.
We threw a lot of criteria at this one to get the best, most complete results possible. Using the 2019-2023 American Community Survey Census data produced for the state of New Jersey, we looked at every single city in the state. We paid particular attention to:
- Population density
- % of population that’s male vs. female (closer to a 50-50 ratio is better)
- % of households with kids
- Median age
- Number of unmarried people in each city
We then gave each city a “Singles Score.”
The higher the score, the better the city is for singles to find one another. We also limited our results to cities with over 10,000 people. For New Jersey, that meant a total of 102 cities.
We updated this article for 2025. This is our tenth time ranking the best cities for singles in New Jersey.
Read on to see why Hoboken is the talk of the town while Franklin Lakes is probably a bit on the bland side.
Summary: The Best Cities for Singles in New Jersey for 2025
If you’re looking for a breakdown of cities in New Jersey ranked by criteria that most agree make a place a great spot for finding a single person (and potentially love), this is an accurate list.
The best cities for singles in New Jersey are Hoboken, Edgewater, West New York, Highland Park, Cliffside Park, Hackensack, Newark, Asbury Park, Trenton, and Harrison.
Here’s a look at the most boring cities in New Jersey according to the data:
- Franklin Lakes
- Hillsdale
- Tinton Falls
For more New Jersey reading, check out:
- Best Places To Raise A Family In New Jersey
- Safest Places In New Jersey
- Worst Places To Live In New Jersey
Best Cities For Singles In New Jersey
| Rank | City | Population | Median Age | % Married Households | % Households /w Kids |
|---|---|---|---|---|---|
| 1 | Hoboken, NJ | 58,340 | 31.9 | 10.0% | 20.6% |
| 2 | Edgewater, NJ | 14,544 | 39.9 | 5.0% | 19.4% |
| 3 | West New York, NJ | 51,683 | 37.3 | 3.0% | 28.9% |
| 4 | Highland Park, NJ | 14,981 | 34.6 | 10.0% | 25.1% |
| 5 | Cliffside Park, NJ | 25,580 | 41.0 | 9.0% | 24.1% |
| 6 | Hackensack, NJ | 45,768 | 41.5 | 6.0% | 20.6% |
| 7 | Newark, NJ | 307,188 | 34.8 | 6.0% | 34.0% |
| 8 | Asbury Park, NJ | 15,239 | 38.3 | 12.0% | 16.4% |
| 9 | Trenton, NJ | 89,966 | 35.4 | 8.0% | 30.1% |
| 10 | Harrison, NJ | 19,599 | 33.8 | 7.0% | 23.4% |
| 11 | Guttenberg, NJ | 11,638 | 37.8 | 4.0% | 30.7% |
| 12 | Paterson, NJ | 157,660 | 33.3 | 5.0% | 44.2% |
| 13 | Garfield, NJ | 32,502 | 39.0 | 9.0% | 34.7% |
| 14 | Fairview, NJ | 14,920 | 39.0 | 6.0% | 26.4% |
| 15 | Elizabeth, NJ | 135,887 | 35.8 | 6.0% | 40.2% |
| 16 | Red Bank, NJ | 12,864 | 39.7 | 17.0% | 21.8% |
| 17 | Lindenwold, NJ | 21,534 | 35.4 | 11.0% | 26.3% |
| 18 | Bayonne, NJ | 70,468 | 38.6 | 15.0% | 31.4% |
| 19 | Roselle Park, NJ | 13,965 | 38.6 | 17.0% | 30.7% |
| 20 | Plainfield, NJ | 54,515 | 33.0 | 8.0% | 45.7% |
| 21 | New Brunswick, NJ | 55,744 | 24.5 | 5.0% | 35.8% |
| 22 | Fort Lee, NJ | 39,818 | 47.2 | 4.0% | 22.2% |
| 23 | Glassboro, NJ | 23,375 | 28.7 | 15.0% | 22.0% |
| 24 | East Orange, NJ | 69,183 | 37.0 | 8.0% | 28.5% |
| 25 | Perth Amboy, NJ | 55,278 | 36.3 | 5.0% | 40.8% |
| 26 | Palisades Park, NJ | 20,192 | 43.2 | 5.0% | 22.6% |
| 27 | Passaic, NJ | 69,651 | 30.9 | 5.0% | 48.0% |
| 28 | Bergenfield, NJ | 28,269 | 40.7 | 8.0% | 34.7% |
| 29 | North Plainfield, NJ | 22,667 | 36.9 | 11.0% | 28.3% |
| 30 | Clifton, NJ | 89,247 | 41.1 | 14.0% | 27.1% |
| 31 | Bound Brook, NJ | 12,023 | 35.8 | 11.0% | 34.7% |
| 32 | Freehold, NJ | 12,504 | 35.4 | 15.0% | 35.0% |
| 33 | Long Branch, NJ | 32,184 | 35.4 | 14.0% | 28.5% |
| 34 | Wallington, NJ | 11,825 | 39.0 | 13.0% | 32.2% |
| 35 | Camden, NJ | 71,471 | 33.4 | 6.0% | 39.0% |
| 36 | Ridgefield, NJ | 11,439 | 40.3 | 11.0% | 32.2% |
| 37 | Somerville, NJ | 12,958 | 35.5 | 19.0% | 26.9% |
| 38 | Collingswood, NJ | 14,163 | 39.6 | 17.0% | 22.4% |
| 39 | Ridgefield Park, NJ | 13,167 | 38.0 | 10.0% | 34.5% |
| 40 | Little Ferry, NJ | 10,942 | 44.8 | 8.0% | 21.6% |
| 41 | Linden, NJ | 43,614 | 39.8 | 11.0% | 33.4% |
| 42 | Wood-Ridge, NJ | 10,094 | 39.7 | 23.0% | 31.5% |
| 43 | Kearny, NJ | 40,570 | 39.2 | 11.0% | 32.0% |
| 44 | Phillipsburg, NJ | 15,251 | 41.6 | 22.0% | 26.7% |
| 45 | Roselle, NJ | 22,455 | 39.8 | 11.0% | 29.7% |
| 46 | East Rutherford, NJ | 10,154 | 36.5 | 13.0% | 27.8% |
| 47 | New Milford, NJ | 16,882 | 39.5 | 13.0% | 34.1% |
| 48 | Secaucus, NJ | 21,437 | 38.6 | 12.0% | 30.2% |
| 49 | Manville, NJ | 10,870 | 42.4 | 22.0% | 28.1% |
| 50 | Maywood, NJ | 10,042 | 45.6 | 17.0% | 28.4% |
| 51 | Rahway, NJ | 29,748 | 39.0 | 15.0% | 32.8% |
| 52 | Hawthorne, NJ | 19,472 | 42.3 | 27.0% | 30.0% |
| 53 | Rutherford, NJ | 18,748 | 40.7 | 20.0% | 33.7% |
| 54 | South River, NJ | 16,007 | 36.5 | 22.0% | 36.3% |
| 55 | Lodi, NJ | 25,946 | 39.4 | 12.0% | 35.6% |
| 56 | Pleasantville, NJ | 20,604 | 35.0 | 8.0% | 36.0% |
| 57 | Pine Hill, NJ | 10,762 | 36.0 | 15.0% | 27.4% |
| 58 | Sayreville, NJ | 45,237 | 39.6 | 15.0% | 32.1% |
| 59 | Dover, NJ | 18,420 | 41.0 | 6.0% | 37.3% |
| 60 | Fair Lawn, NJ | 35,153 | 39.2 | 14.0% | 42.2% |
| 61 | Bellmawr, NJ | 11,678 | 41.1 | 22.0% | 30.3% |
| 62 | Carteret, NJ | 25,187 | 39.3 | 14.0% | 38.0% |
| 63 | Tenafly, NJ | 15,252 | 42.1 | 10.0% | 52.4% |
| 64 | Madison, NJ | 16,464 | 39.0 | 19.0% | 35.2% |
| 65 | Bridgeton, NJ | 26,836 | 28.9 | 10.0% | 48.1% |
| 66 | Westwood, NJ | 11,221 | 41.7 | 22.0% | 32.5% |
| 67 | Somers Point, NJ | 10,461 | 43.5 | 20.0% | 21.8% |
| 68 | Englewood, NJ | 29,342 | 43.0 | 7.0% | 31.6% |
| 69 | Paramus, NJ | 26,500 | 49.1 | 16.0% | 31.8% |
| 70 | Ridgewood, NJ | 26,076 | 41.1 | 18.0% | 43.8% |
| 71 | North Arlington, NJ | 16,368 | 39.6 | 21.0% | 28.8% |
| 72 | Dumont, NJ | 18,072 | 42.1 | 17.0% | 30.5% |
| 73 | Glen Rock, NJ | 12,082 | 40.0 | 15.0% | 52.2% |
| 74 | Woodland Park, NJ | 13,284 | 44.3 | 16.0% | 27.0% |
| 75 | Florham Park, NJ | 13,134 | 39.9 | 22.0% | 26.9% |
| 76 | Elmwood Park, NJ | 21,287 | 39.9 | 18.0% | 35.8% |
| 77 | Hopatcong, NJ | 14,470 | 41.4 | 31.0% | 28.2% |
| 78 | Hasbrouck Heights, NJ | 12,067 | 44.2 | 21.0% | 36.1% |
| 79 | Point Pleasant, NJ | 19,158 | 44.9 | 37.0% | 30.2% |
| 80 | Summit, NJ | 22,512 | 40.6 | 15.0% | 40.1% |
| 81 | Wanaque, NJ | 11,162 | 47.3 | 23.0% | 22.4% |
| 82 | South Plainfield, NJ | 24,231 | 41.7 | 27.0% | 35.2% |
| 83 | Ramsey, NJ | 14,722 | 41.1 | 20.0% | 39.6% |
| 84 | Pompton Lakes, NJ | 11,010 | 39.4 | 29.0% | 34.0% |
| 85 | Beachwood, NJ | 11,002 | 42.1 | 32.0% | 30.5% |
| 86 | Millville, NJ | 27,432 | 42.6 | 26.0% | 25.0% |
| 87 | Metuchen, NJ | 14,982 | 39.4 | 23.0% | 38.2% |
| 88 | Westfield, NJ | 30,760 | 41.0 | 22.0% | 43.6% |
| 89 | Totowa, NJ | 10,919 | 43.1 | 26.0% | 34.0% |
| 90 | Vineland, NJ | 60,692 | 38.8 | 24.0% | 35.4% |
| 91 | Hammonton, NJ | 14,746 | 45.1 | 23.0% | 29.6% |
| 92 | Waldwick, NJ | 10,090 | 39.5 | 29.0% | 37.7% |
| 93 | Oakland, NJ | 12,700 | 41.9 | 31.0% | 39.0% |
| 94 | River Edge, NJ | 12,024 | 42.2 | 20.0% | 35.2% |
| 95 | Lincoln Park, NJ | 10,901 | 48.0 | 22.0% | 22.8% |
| 96 | Haddonfield, NJ | 12,502 | 39.3 | 24.0% | 50.0% |
| 97 | Ringwood, NJ | 11,600 | 43.6 | 28.0% | 28.8% |
| 98 | Middlesex, NJ | 14,518 | 44.3 | 26.0% | 32.1% |
| 99 | New Providence, NJ | 13,577 | 44.7 | 21.0% | 37.9% |
| 100 | Tinton Falls, NJ | 19,252 | 47.1 | 28.0% | 24.0% |