
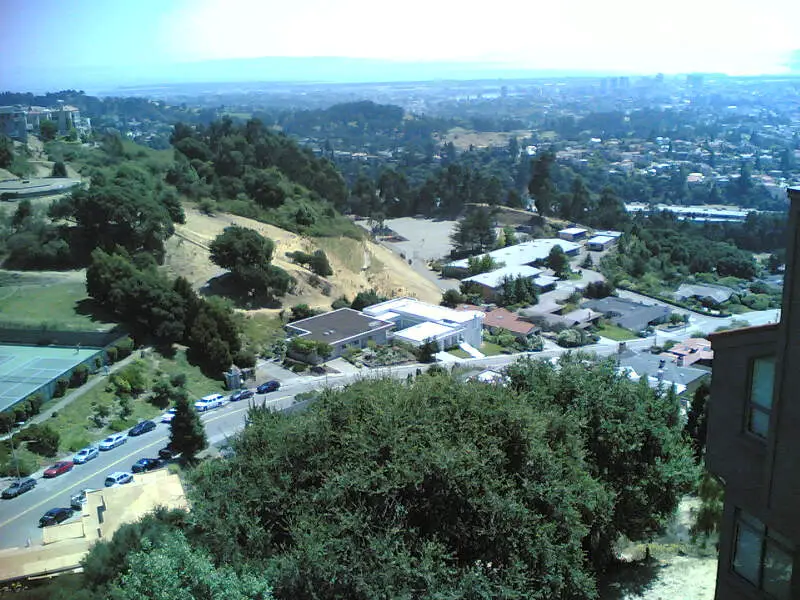
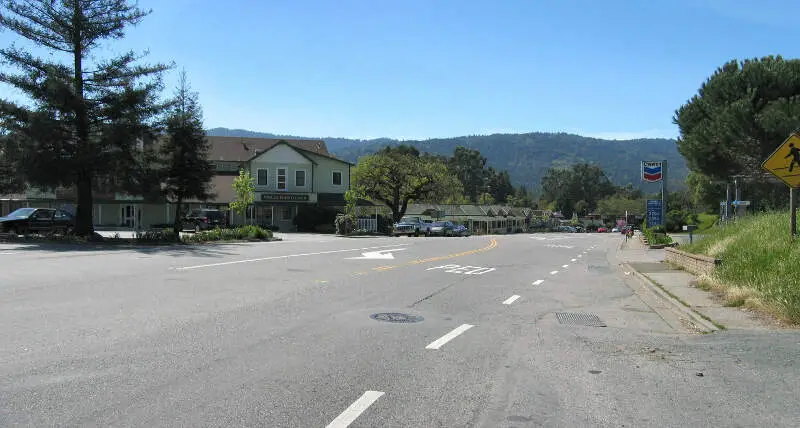
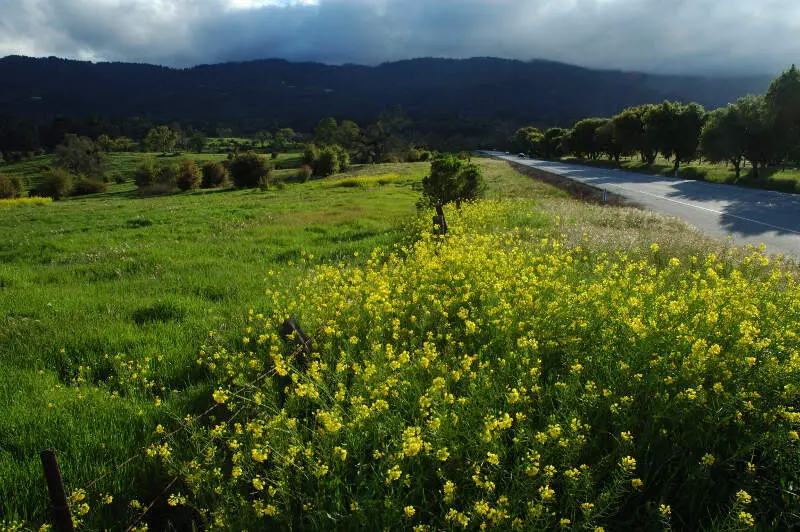
While big cities like Hayward offer culture, cuisine, and charisma, they also deliver terrible traffic, towering expenses, and a taxing quality of life.
With that in mind, we wanted to uncover the best suburbs around Hayward. These burbs have all of the benefits of being near Hayward without actually having to be in the city.
Of course, not all suburbs of Hayward are created equally, which is precisely why we set out to find the best ones. Using Saturday Night Science, we delve into the factors that matter most, from commutes and housing costs to community vibes, to help you uncover the perfect suburban spots in the Greater Hayward area.
Table Of Contents: Top Ten | Methodology | Summary | Table
The 10 best suburbs to live around Hayward for 2025:
What’s the best suburb of Hayward? Piedmont ranks as the best suburb of Hayward for 2025 based on the most recent Census and FBI data. If you happen to be a resident of Piedmont, you’re probably not too surprised to find it on the top our list.
We’ll tell you what makes each of these 10 Hayward ‘burbs better than the rest–but first, a bit about our methodology.
Feel free to check out some more reading about California:
The 10 Best Hayward Suburbs To Live For 2025

/10
Population: 11,012
Median Income: $250,001
Unemployment Rate: 4.0%
Poverty Rate: 3.8%
More on Piedmont: Data
Piedmont is always mentioned as one of the best suburbs in the Hayward area. We’ll tell you the good about “Awesome Piedmont.”
Everyone here is rich; families average $250,001 a year, which is the 5th highest in the Hayward region. And only 3.96% are out of work. Homes average more than $2,000,001 each.

/10
Population: 30,736
Median Income: $250,001
Unemployment Rate: 4.4%
Poverty Rate: 3.1%
More on Los Altos: Data
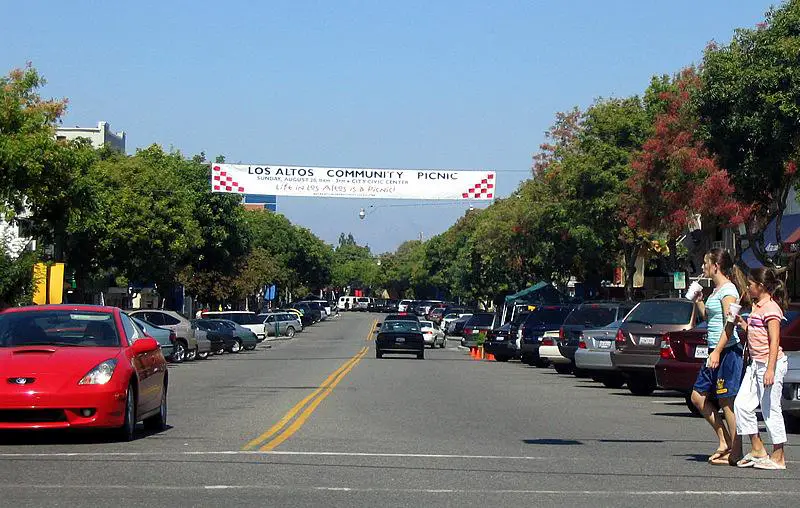
Los Altos is the second best ‘burb we looked at near Hayward for 2025.
It ranks 5th for incomes in the area and only 1.4% of residents lack insurance, good for 11th best.
/10
Population: 2,415
Median Income: $250,001
Unemployment Rate: 0.4%
Poverty Rate: 6.6%
More on Belvedere: Data
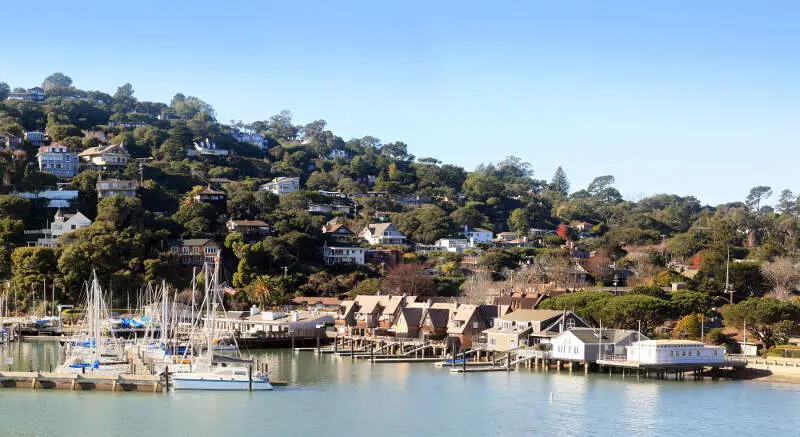
Here in Belvedere, it’s really safe, and residents are just about as rich as you’ll see in the Hayward metro area.
The bad side? Schools are more crowded, and the cost of living puts a large part of the city out of reach for most families.
But price is based on demand and a lot of people want to live in Belvedere.

/10
Population: 8,367
Median Income: $250,001
Unemployment Rate: 3.3%
Poverty Rate: 4.5%
More on Los Altos Hills: Data
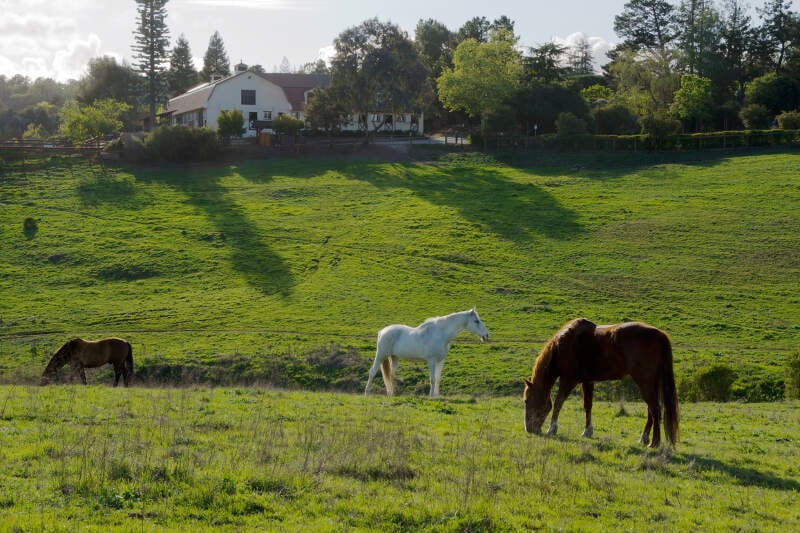
Los Altos Hills ranks as the 4th best suburb of Hayward for 2025.
You won’t find many better places to raise your kids in the region than in Los Altos Hills and the schools are some of the best around.

/10
Population: 58,886
Median Income: $231,139
Unemployment Rate: 3.4%
Poverty Rate: 4.3%
More on Cupertino: Data
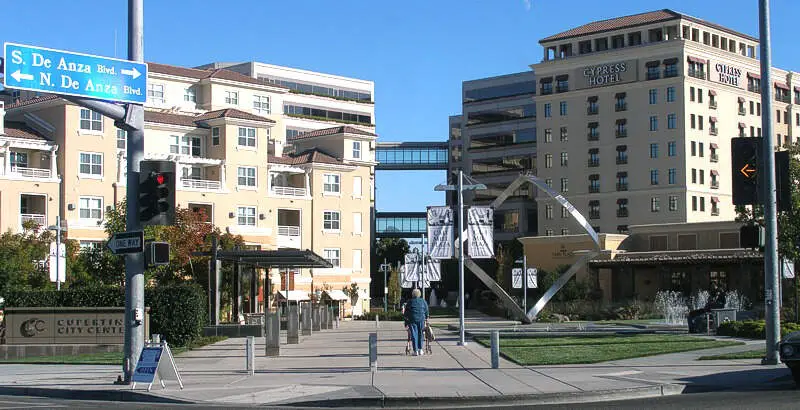
Coming in as the fifth best is Cupertino.
Cupertino gets kudos for having the 10th most expensive homes in the Hayward area, where houses sell for an average of $2,000,001. However, the cost of living here is among the highest in the area.

/10
Population: 29,797
Median Income: $233,333
Unemployment Rate: 4.6%
Poverty Rate: 3.2%
More on San Carlos: Data
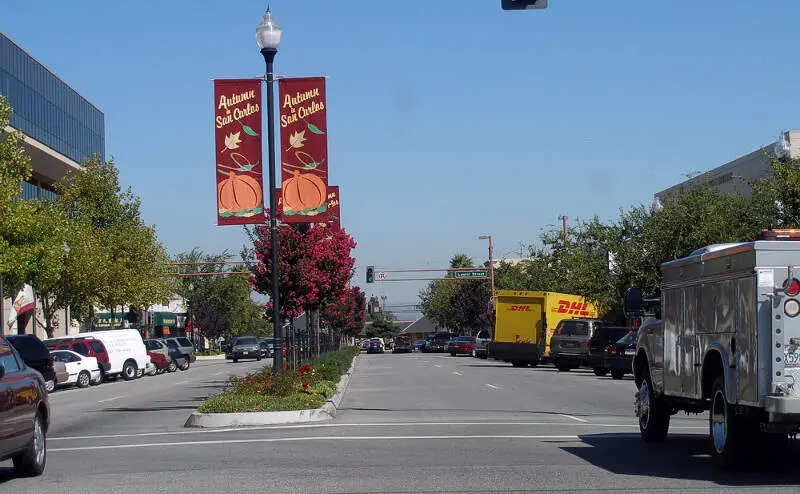
San Carlos is proud of its 6th place finish on this list. And here’s why.
Most residents have great jobs and the unemployment rate sits at 4.59%.
According to online reports, San Carlos is quickly becoming one of the more affluent suburbs in the Hayward area, meaning you need to get in soon.

/10
Population: 19,472
Median Income: $250,001
Unemployment Rate: 3.0%
Poverty Rate: 2.0%
More on Orinda: Data
The 7th best suburb on our list goes to Orinda.
Orinda schools are some of the best in the region, and crime is really low. The cost of living makes it a lot more desirable for many families, especially first-time home buyers.
And, it’s only 17.8 miles to downtown, which is a good thing.

/10
Population: 7,021
Median Income: $250,001
Unemployment Rate: 3.0%
Poverty Rate: 3.3%
More on Atherton: Data
Atherton is growing quickly, and for a good reason. Crime is far below average, and most residents are gainfully employed. Even the cost of living is reasonable.
A solid 1.64% of people lack insurance, good for 16th in the area.

/10
Population: 5,181
Median Income: $250,001
Unemployment Rate: 3.1%
Poverty Rate: 4.2%
More on Woodside: Data
Is ‘Everything Better In Woodside?’
Almost.
It placed 9th on our list thanks to the fact that it’s really expensive to live here, but the schools are great, so you get what you pay for in that regard.
/10
Population: 4,329
Median Income: $250,001
Unemployment Rate: 2.2%
Poverty Rate: 5.3%
More on Portola Valley: Data
And rounding out the top ten for 2025 is Portola Valley.
This city is far above average in every category, and the best part? It’s far more affordable than the other cities listed above. So, you get a big bang for your buck here.
Methodology: How We Determined The Best Suburbs Around Hayward for 2025
Figuring out the best suburbs around Hayward was simple. We used Saturday Night Science to find things people like about living in the suburbs and then locate the suburbs with those things.
We analyzed the newest American Community Survey data for 2019-2023 to research each suburb. We decided upon the following criteria:
- Low unemployment rate
- High median household incomes
- Population density (lots of things to do)
- High home values
- A lot of college-educated people
- Low poverty
- High rate of insured families
We defined a suburb as being within 30 miles of Hayward.
Additionally, we limited the analysis to places that have over 2,000 people. This left us with a grand total of 65 suburbs to evaluate around Hayward.
We ranked each place with scores from 1 to 65 in each category, where 1 was the “best.
Next, we averaged the rankings for each place to create a quality-of-life index.
Finally, we crowned the city with the best quality of life index, the “Best Suburb near Hayward.” We’re lookin’ at you, Piedmont.
This result may differ from our state-wide data as we did not include commute times and crime for this analysis to allow for a more extensive selection of suburbs.
We updated the data for 2025. This report is our tenth time ranking the best Hayward suburbs. Skip to the end to see the list of all the suburbs ranked from best to worst.
Summary: Welcome to the Best Hayward ‘Burbs of 2025
We said it once, and we’ll say it again–life in the big city isn’t for everyone. At least not all the time.
The best suburbs of Hayward are .
So if you’re craving the amenities of a larger city like Hayward but don’t want to deal with the drawbacks, one of these suburbs might be for you.
For more California reading, check out:
Table: Best Hayward Suburbs
| Rank | City | Population | Median Income | Average Home Price |
|---|---|---|---|---|
| 1 | Piedmont, CA | 11,012 | $250,001 | $2,000,001 |
| 2 | Los Altos, CA | 30,736 | $250,001 | $2,000,001 |
| 3 | Belvedere, CA | 2,415 | $250,001 | $2,000,001 |
| 4 | Los Altos Hills, CA | 8,367 | $250,001 | $2,000,001 |
| 5 | Cupertino, CA | 58,886 | $231,139 | $2,000,001 |
| 6 | San Carlos, CA | 29,797 | $233,333 | $2,000,001 |
| 7 | Orinda, CA | 19,472 | $250,001 | $1,804,400 |
| 8 | Atherton, CA | 7,021 | $250,001 | $2,000,001 |
| 9 | Woodside, CA | 5,181 | $250,001 | $2,000,001 |
| 10 | Portola Valley, CA | 4,329 | $250,001 | $2,000,001 |
| 11 | Saratoga, CA | 30,335 | $241,348 | $2,000,001 |
| 12 | Los Gatos, CA | 32,773 | $207,891 | $2,000,001 |
| 13 | Monte Sereno, CA | 3,459 | $250,001 | $2,000,001 |
| 14 | Lafayette, CA | 25,277 | $222,393 | $2,000,001 |
| 15 | Hillsborough, CA | 11,122 | $250,001 | $2,000,001 |
| 16 | Palo Alto, CA | 67,231 | $220,408 | $2,000,001 |
| 17 | Danville, CA | 43,426 | $223,206 | $1,583,300 |
| 18 | Tiburon, CA | 9,035 | $212,794 | $2,000,001 |
| 19 | Dublin, CA | 70,542 | $205,046 | $1,224,100 |
| 20 | Mountain View, CA | 82,363 | $179,917 | $1,927,400 |
| 21 | Mountain View, CA | 82,363 | $179,917 | $1,927,400 |
| 22 | Mountain View, CA | 82,363 | $179,917 | $1,927,400 |
| 23 | Mountain View, CA | 82,363 | $179,917 | $1,927,400 |
| 24 | San Ramon, CA | 85,734 | $197,358 | $1,359,100 |
| 25 | Belmont, CA | 27,505 | $207,609 | $2,000,001 |
| 26 | Sunnyvale, CA | 153,455 | $181,862 | $1,816,600 |
| 27 | Burlingame, CA | 30,526 | $168,832 | $2,000,001 |
| 28 | Menlo Park, CA | 32,775 | $206,588 | $2,000,001 |
| 29 | Albany, CA | 19,768 | $135,927 | $1,188,600 |
| 30 | Campbell, CA | 42,848 | $147,128 | $1,550,000 |
| 31 | Sausalito, CA | 7,171 | $173,030 | $1,858,900 |
| 32 | Clayton, CA | 10,962 | $172,226 | $1,017,300 |
| 33 | Pleasanton, CA | 77,500 | $186,206 | $1,432,300 |
| 34 | Milpitas, CA | 78,216 | $176,822 | $1,180,000 |
| 35 | Moraga, CA | 16,790 | $199,800 | $1,597,600 |
| 36 | Livermore, CA | 85,870 | $153,602 | $1,038,600 |
| 37 | Pacifica, CA | 37,527 | $156,819 | $1,211,700 |
| 38 | Fremont, CA | 228,518 | $176,350 | $1,289,400 |
| 39 | Millbrae, CA | 22,589 | $157,567 | $1,929,700 |
| 40 | Santa Clara, CA | 129,239 | $173,670 | $1,527,900 |
| 41 | South San Francisco, CA | 64,487 | $135,909 | $1,160,100 |
| 42 | San Mateo, CA | 103,555 | $152,669 | $1,563,200 |
| 43 | Alameda, CA | 76,876 | $132,015 | $1,203,900 |
| 44 | Walnut Creek, CA | 69,790 | $135,665 | $1,031,100 |
| 45 | San Bruno, CA | 42,612 | $135,976 | $1,199,400 |
| 46 | Half Moon Bay, CA | 11,454 | $153,199 | $1,467,000 |
| 47 | Pleasant Hill, CA | 34,335 | $144,513 | $1,040,600 |
| 48 | Berkeley, CA | 120,223 | $108,558 | $1,351,100 |
| 49 | Newark, CA | 47,145 | $164,909 | $1,094,200 |
| 50 | El Cerrito, CA | 25,781 | $127,475 | $1,107,500 |
| 51 | Emeryville, CA | 12,756 | $120,302 | $598,300 |
| 52 | Martinez, CA | 36,926 | $125,436 | $824,700 |
| 53 | Hercules, CA | 26,245 | $130,583 | $741,200 |
| 54 | Brentwood, CA | 64,609 | $139,567 | $791,600 |
| 55 | San Jose, CA | 990,054 | $141,565 | $1,187,800 |
| 56 | Pinole, CA | 18,835 | $120,833 | $697,100 |
| 57 | East Palo Alto, CA | 29,143 | $104,832 | $1,124,000 |
| 58 | Brisbane, CA | 4,718 | $151,593 | $1,127,200 |
| 59 | Concord, CA | 124,260 | $109,195 | $755,900 |
| 60 | San Leandro, CA | 88,531 | $98,063 | $813,600 |
| 61 | Oakland, CA | 438,072 | $97,369 | $924,700 |
| 62 | San Pablo, CA | 31,771 | $78,215 | $516,000 |
| 63 | Antioch, CA | 115,759 | $94,256 | $607,400 |
| 64 | Pittsburg, CA | 75,868 | $101,099 | $583,100 |
| 65 | Richmond, CA | 115,396 | $90,038 | $650,100 |