Nyack, NY
Demographics And Statistics
Living In Nyack, New York Summary
Life in Nyack research summary. HomeSnacks has been using Saturday Night Science to research the quality of life in Nyack over the past nine years using Census, FBI, Zillow, and other primary data sources. Based on the most recently available data, we found the following about life in Nyack:
The population in Nyack is 7,469.
The median home value in Nyack is $739,576.
The median income in Nyack is $118,889.
The cost of living in Nyack is 155 which is 1.6x higher than the national average.
The median rent in Nyack is $2,213.
The unemployment rate in Nyack is 8.9%.
The poverty rate in Nyack is 6.5%.
The average high in Nyack is 61.8° and the average low is 42.7°.
Table Of Contents
Nyack SnackAbility
Overall SnackAbility
Nyack, NY Cost Of Living
Cost of living in Nyack summary. We use data on the cost of living to determine how expensive it is to live in Nyack. Real estate prices drive most of the variance in cost of living around New York. Key points include:
The cost of living in Nyack is 155 with 100 being average.
The cost of living in Nyack is 1.6x higher than the national average.
The median home value in Nyack is $739,576.
The median income in Nyack is $118,889.
Nyack's Overall Cost Of Living
Higher Than The National Average
Cost Of Living In Nyack Comparison Table
| Living Expense | Nyack | New York | National Average | |
|---|---|---|---|---|
| Overall | 155 | 119 | 100 | |
| Services | 115 | 110 | 100 | |
| Groceries | 107 | 103 | 100 | |
| Health | 112 | 101 | 100 | |
| Housing | 253 | 145 | 100 | |
| Transportation | 102 | 105 | 100 | |
| Utilities | 132 | 99 | 100 | |
Nyack, NY Weather
The average high in Nyack is 61.8° and the average low is 42.7°.
There are 79.5 days of precipitation each year.
Expect an average of 48.9 inches of precipitation each year with 30.4 inches of snow.
| Stat | Nyack |
|---|---|
| Average Annual High | 61.8 |
| Average Annual Low | 42.7 |
| Annual Precipitation Days | 79.5 |
| Average Annual Precipitation | 48.9 |
| Average Annual Snowfall | 30.4 |
Average High
Days of Rain
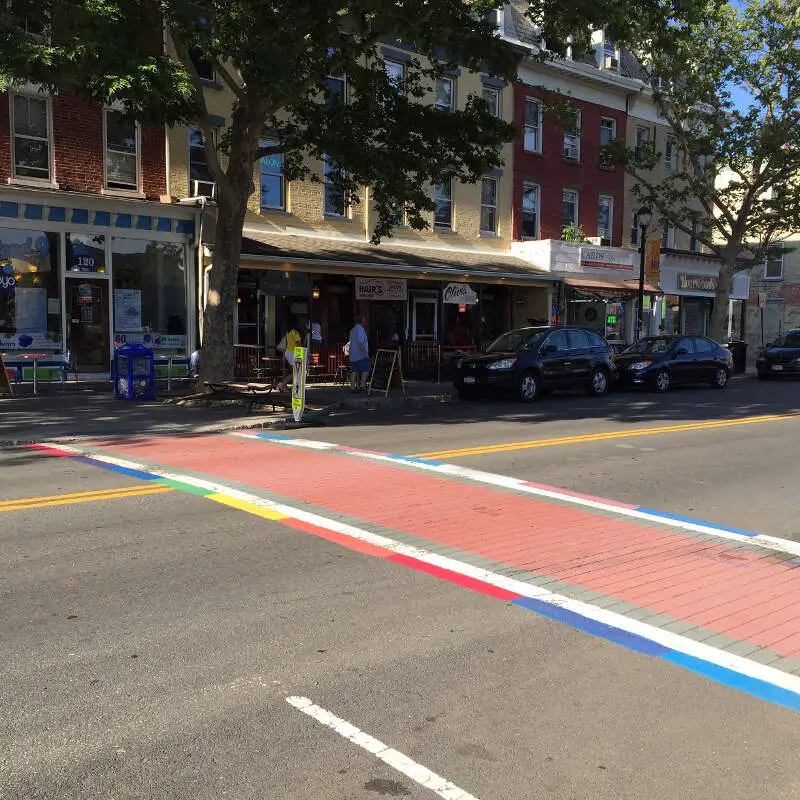
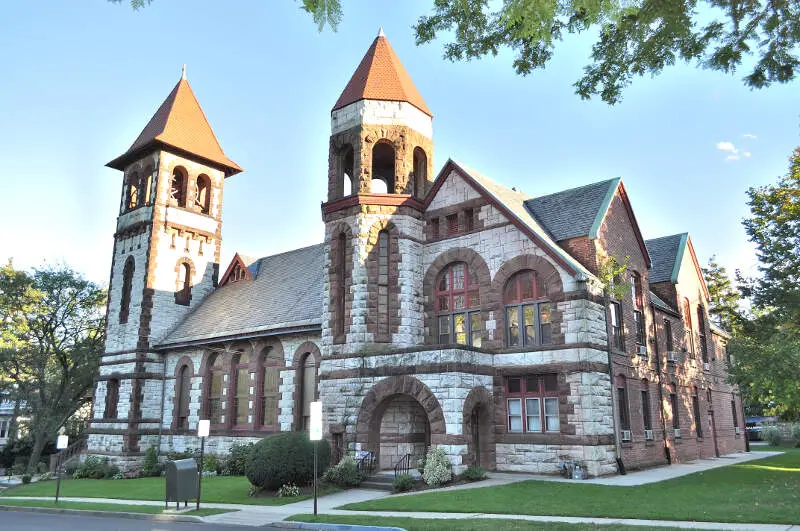
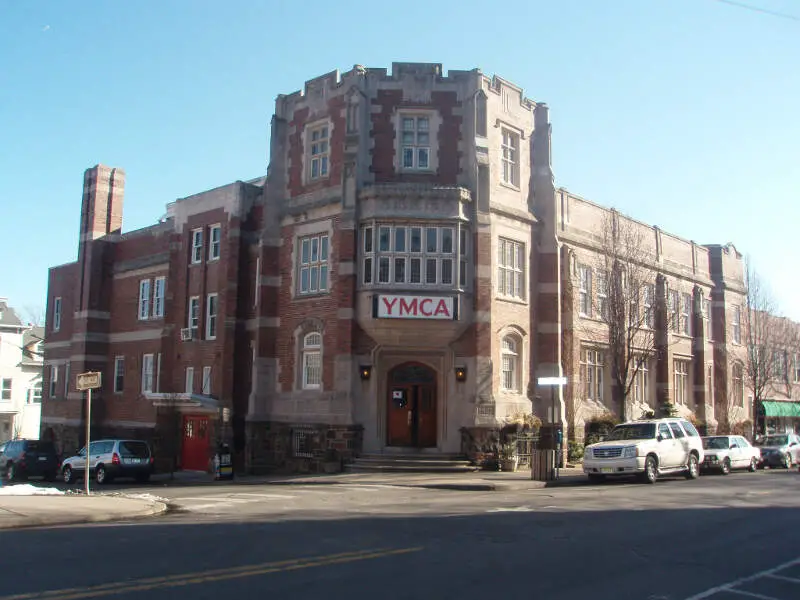
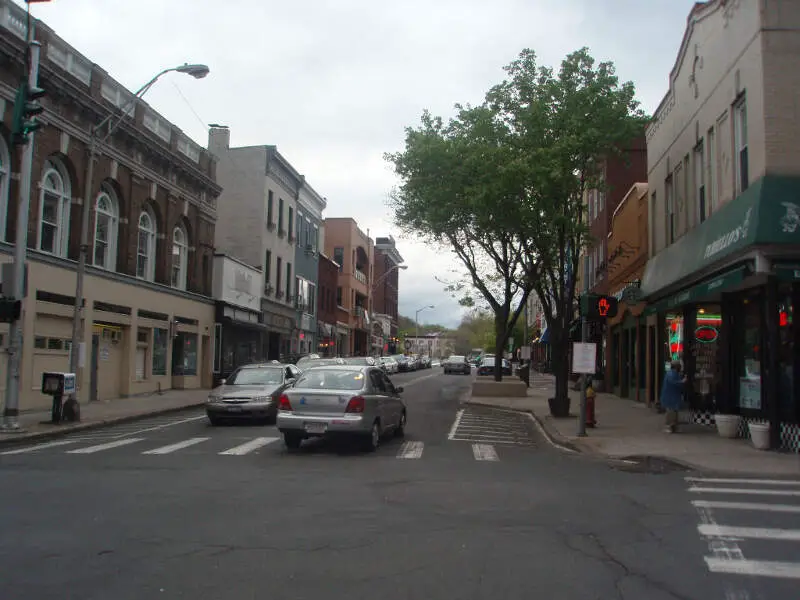
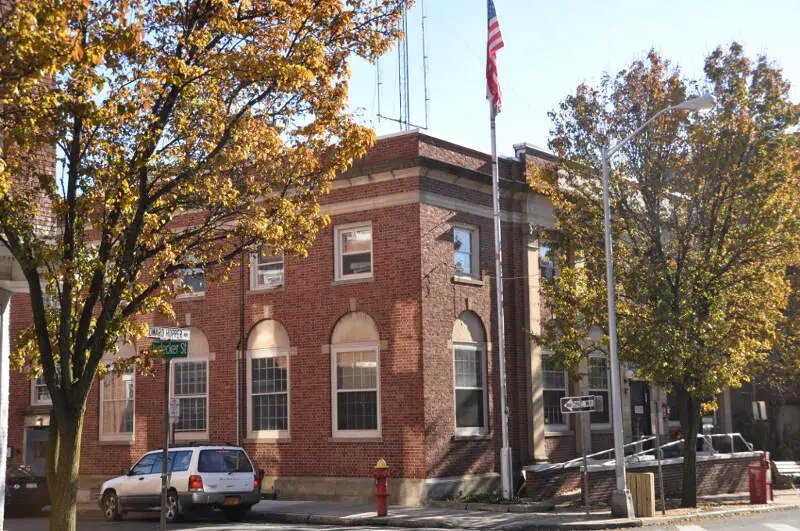
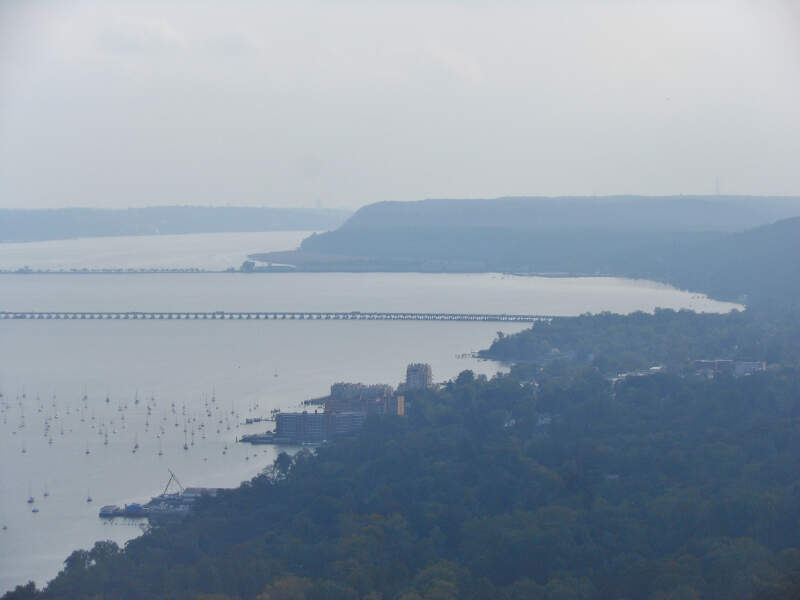
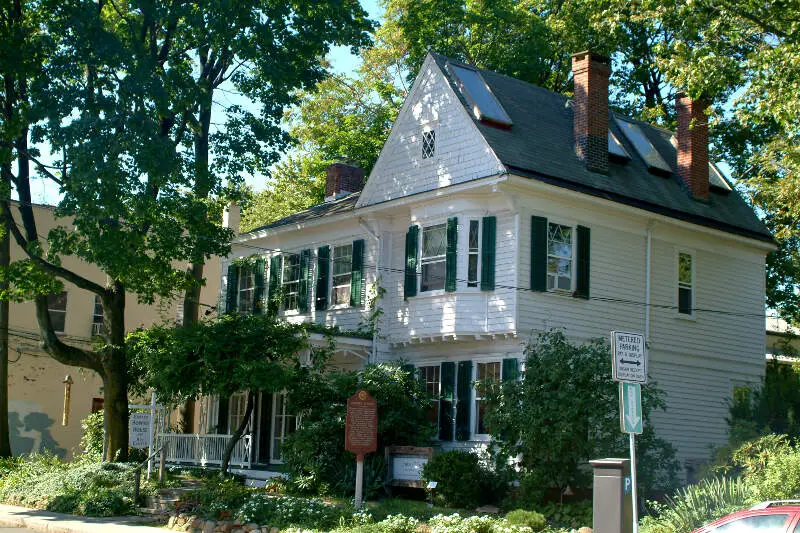
Nyack, NY Photos


Rankings for Nyack in New York


Locations Around Nyack
Map Of Nyack, NY
Best Places Around Nyack
Bronxville, NY
Population 6,539
Pelham Manor, NY
Population 5,648
Pleasantville, NY
Population 7,395
Larchmont, NY
Population 6,542
Briarcliff Manor, NY
Population 7,333
Tappan, NY
Population 6,704
Irvington, NY
Population 6,541
Mamaroneck, NY
Population 19,840
Blauvelt, NY
Population 5,485
Eastchester, NY
Population 20,519
Nyack Demographics And Statistics
Population over time in Nyack
The current population in Nyack is 7,469. The population has increased 7.3% from 2010.
| Year | Population | % Change |
|---|---|---|
| 2023 | 7,469 | 5.8% |
| 2022 | 7,057 | -3.4% |
| 2021 | 7,303 | 2.4% |
| 2020 | 7,130 | -0.6% |
| 2019 | 7,173 | -0.2% |
| 2018 | 7,188 | 1.9% |
| 2017 | 7,057 | 4.0% |
| 2016 | 6,788 | 0.3% |
| 2015 | 6,769 | -1.3% |
| 2014 | 6,857 | -1.8% |
| 2013 | 6,980 | -1.4% |
| 2012 | 7,079 | 1.5% |
| 2011 | 6,972 | 0.1% |
| 2010 | 6,964 | - |
Race / Ethnicity in Nyack
Nyack is:
52.4% White with 3,915 White residents.
21.4% African American with 1,602 African American residents.
0.0% American Indian with 0 American Indian residents.
4.7% Asian with 352 Asian residents.
0.0% Hawaiian with 0 Hawaiian residents.
0.5% Other with 36 Other residents.
2.6% Two Or More with 192 Two Or More residents.
18.4% Hispanic with 1,372 Hispanic residents.
| Race | Nyack | NY | USA |
|---|---|---|---|
| White | 52.4% | 53.4% | 58.2% |
| African American | 21.4% | 13.6% | 12.0% |
| American Indian | 0.0% | 0.2% | 0.5% |
| Asian | 4.7% | 8.8% | 5.7% |
| Hawaiian | 0.0% | 0.0% | 0.2% |
| Other | 0.5% | 0.9% | 0.5% |
| Two Or More | 2.6% | 3.4% | 3.9% |
| Hispanic | 18.4% | 19.6% | 19.0% |
Gender in Nyack
Nyack is 49.3% female with 3,679 female residents.
Nyack is 50.7% male with 3,789 male residents.
| Gender | Nyack | NY | USA |
|---|---|---|---|
| Female | 49.3% | 51.2% | 50.5% |
| Male | 50.7% | 48.8% | 49.5% |
Highest level of educational attainment in Nyack for adults over 25
2.0% of adults in Nyack completed < 9th grade.
5.0% of adults in Nyack completed 9-12th grade.
14.0% of adults in Nyack completed high school / ged.
12.0% of adults in Nyack completed some college.
5.0% of adults in Nyack completed associate's degree.
28.0% of adults in Nyack completed bachelor's degree.
19.0% of adults in Nyack completed master's degree.
11.0% of adults in Nyack completed professional degree.
4.0% of adults in Nyack completed doctorate degree.
| Education | Nyack | NY | USA |
|---|---|---|---|
| < 9th Grade | 2.0% | 5.0% | 5.0% |
| 9-12th Grade | 5.0% | 6.0% | 6.0% |
| High School / GED | 14.0% | 25.0% | 26.0% |
| Some College | 12.0% | 15.0% | 19.0% |
| Associate's Degree | 5.0% | 9.0% | 9.0% |
| Bachelor's Degree | 28.0% | 22.0% | 21.0% |
| Master's Degree | 19.0% | 13.0% | 10.0% |
| Professional Degree | 11.0% | 3.0% | 2.0% |
| Doctorate Degree | 4.0% | 2.0% | 2.0% |
Household Income For Nyack, New York
1.4% of households in Nyack earn Less than $10,000.
2.4% of households in Nyack earn $10,000 to $14,999.
8.4% of households in Nyack earn $15,000 to $24,999.
10.3% of households in Nyack earn $25,000 to $34,999.
5.0% of households in Nyack earn $35,000 to $49,999.
7.1% of households in Nyack earn $50,000 to $74,999.
5.5% of households in Nyack earn $75,000 to $99,999.
19.3% of households in Nyack earn $100,000 to $149,999.
10.0% of households in Nyack earn $150,000 to $199,999.
30.6% of households in Nyack earn $200,000 or more.
| Income | Nyack | NY | USA |
|---|---|---|---|
| Less than $10,000 | 1.4% | 5.7% | 4.9% |
| $10,000 to $14,999 | 2.4% | 4.1% | 3.6% |
| $15,000 to $24,999 | 8.4% | 6.5% | 6.6% |
| $25,000 to $34,999 | 10.3% | 6.2% | 6.8% |
| $35,000 to $49,999 | 5.0% | 9.1% | 10.4% |
| $50,000 to $74,999 | 7.1% | 13.8% | 15.7% |
| $75,000 to $99,999 | 5.5% | 11.4% | 12.7% |
| $100,000 to $149,999 | 19.3% | 16.8% | 17.4% |
| $150,000 to $199,999 | 10.0% | 10.1% | 9.3% |
| $200,000 or more | 30.6% | 16.4% | 12.6% |


