Suppose real estate is the most significant investment a majority of people make in their lifetime. In that case, it’s best to understand the places in Utah with best potential return on investment.
After working in real estate adjacent roles for over a decade, I had the hypothesis that the best place to buy for a return on investment would be up-and-coming cities. Smaller cities where crime might be high now, but people still move to.
To test my hypothesis, we are going to look at places in Utah that are growing faster than average, but where home prices are below average, and crime rates are higher than average.
In everyday terms, these might be “deals”. The best deal in Utah at the moment according to Saturday Night Science? That would be Hyde Park.
Table Of Contents: Top Ten | Methodology | Summary | Table
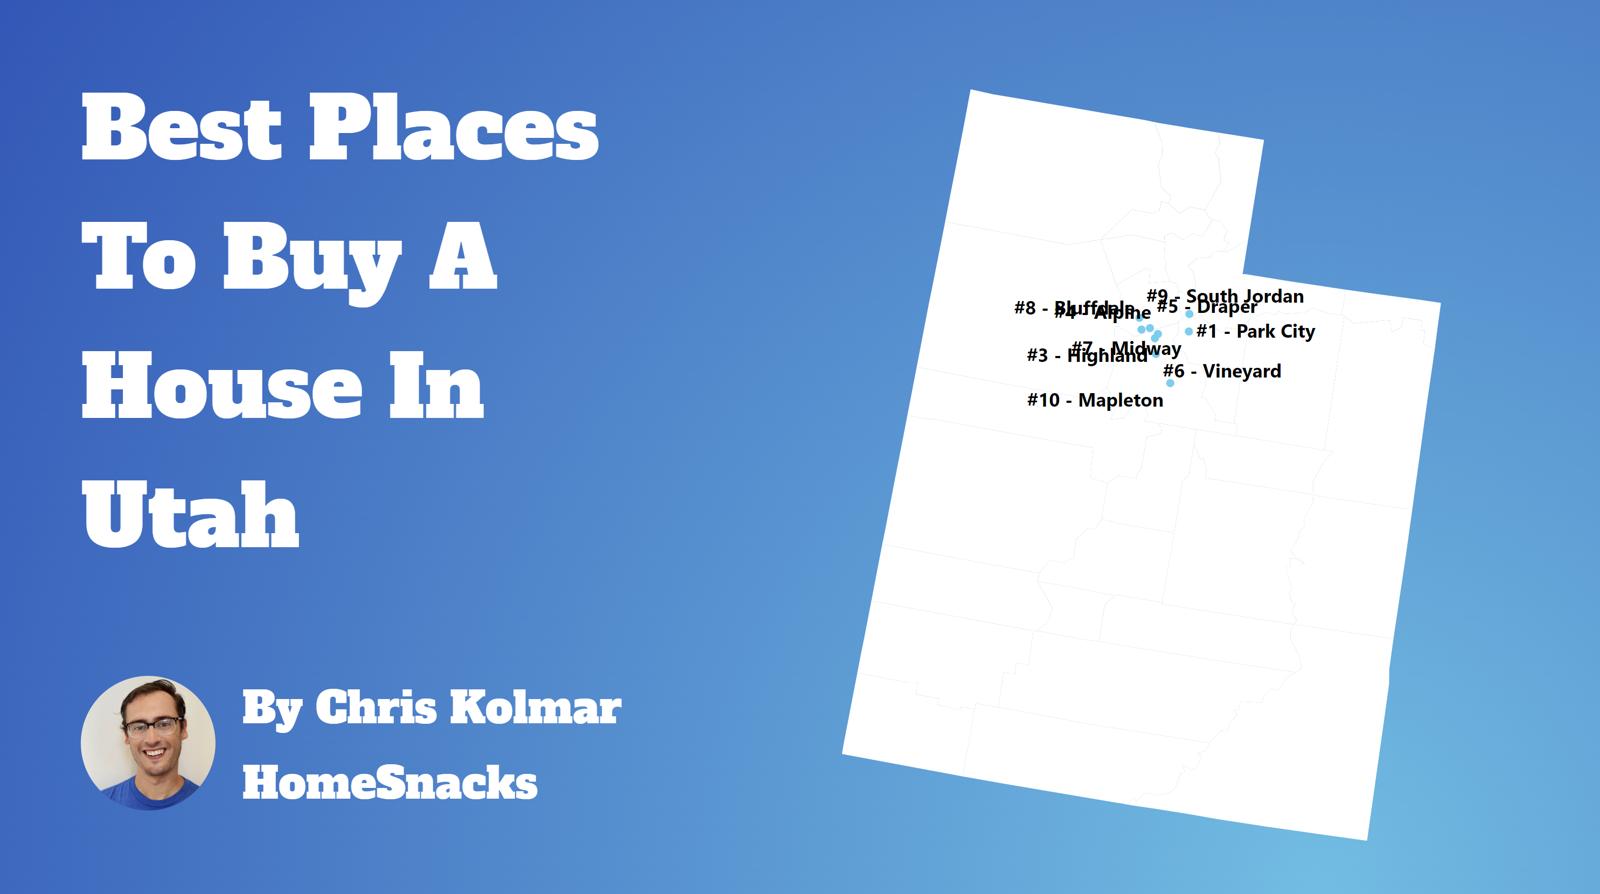
The 10 Best Places To Buy A Home In Utah For 2026
The methodology that wen’t into this can be a bit complicated, so we’ll break it down for you in as much detail as we can below.
For more Utah reading:
The 10 Best Cities To Buy A House In Utah For 2026
/10
Population: 5,540
Median Home Price: $570,837
Population Change: 2.4%
Home Price Change: 0.5%
More on Hyde Park: Data | Movers
/10
/10
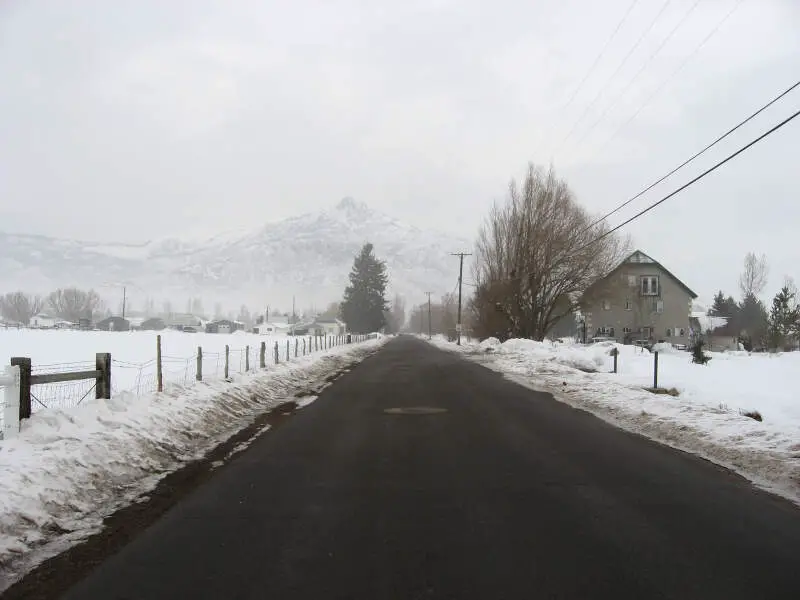
Population: 5,843
Median Home Price: $533,898
Population Change: 2.4%
Home Price Change: 1.0%
More on Perry: Data | Crime | Cost Of Living | Movers
/10
Population: 6,171
Median Home Price: $934,920
Population Change: 1.0%
Home Price Change: -4.6%
More on Midway: Data | Cost Of Living | Movers
/10
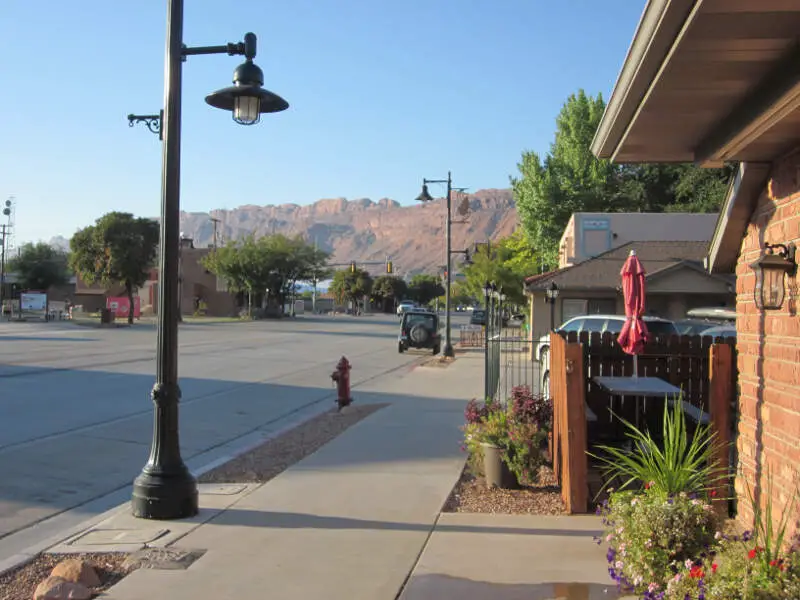
Population: 5,312
Median Home Price: $543,316
Population Change: -0.1%
Home Price Change: -3.0%
More on Moab: Data | Crime | Cost Of Living | Movers
/10
Population: 5,587
Median Home Price: $377,637
Population Change: 0.4%
Home Price Change: 1.7%
More on Sunset: Data | Crime | Cost Of Living | Movers

/10
Population: 5,915
Median Home Price: $602,324
Population Change: -0.1%
Home Price Change: 1.0%
More on West Bountiful: Data | Crime | Cost Of Living | Movers

/10
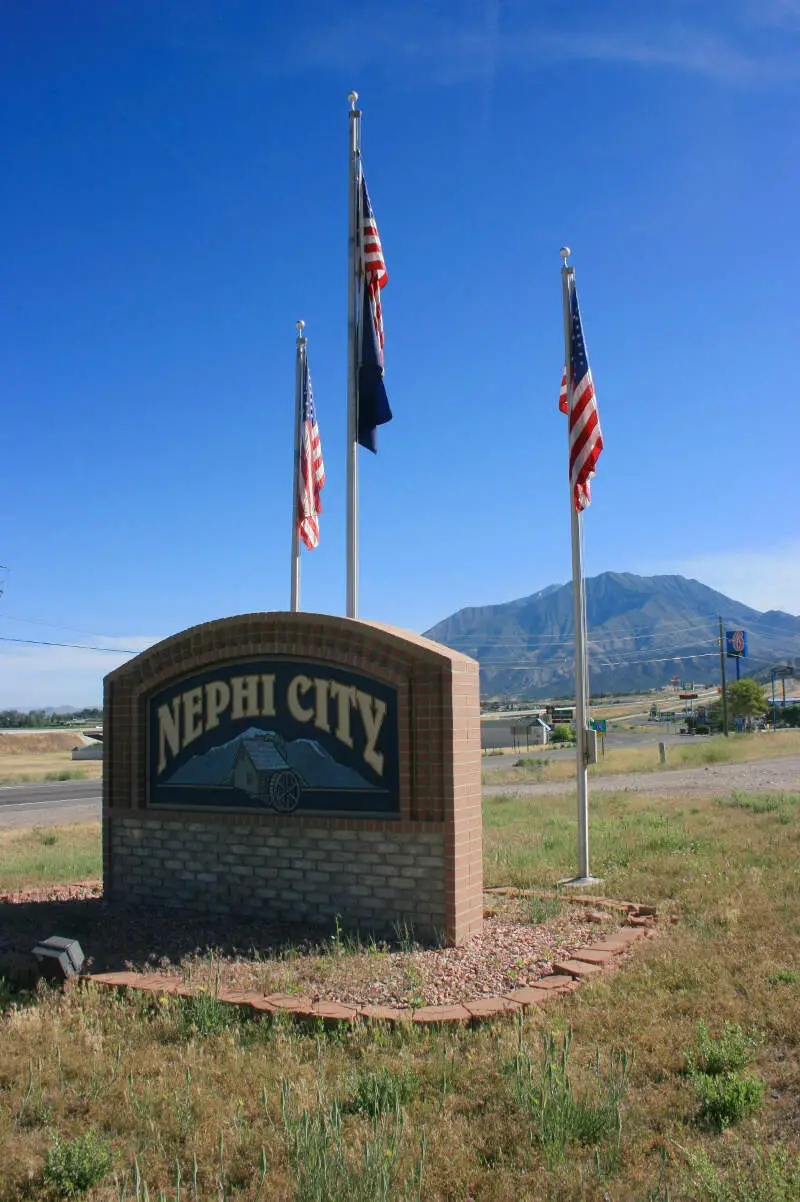
Population: 6,885
Median Home Price: $452,333
Population Change: 2.8%
Home Price Change: 2.3%
More on Nephi: Data | Crime | Cost Of Living | Movers

/10
Population: 6,023
Median Home Price: $758,826
Population Change: -0.2%
Home Price Change: 1.3%
More on Fruit Heights: Data | Cost Of Living | Movers

/10
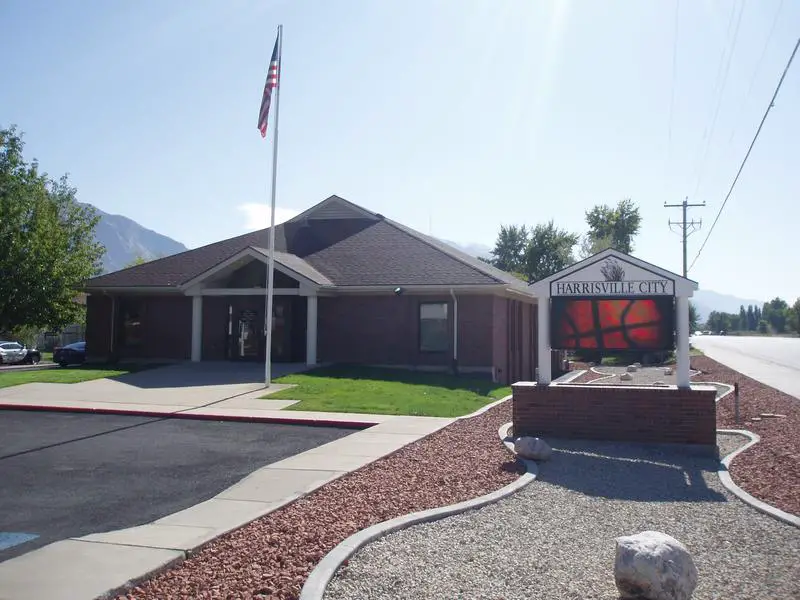
Population: 6,935
Median Home Price: $451,087
Population Change: 0.2%
Home Price Change: 1.6%
More on Harrisville: Data | Crime | Cost Of Living | Movers
Methodology: How do you determine the best places to buy a home in Utah for 2026?
We were in real estate for almost five years and have worked on this site for another 11. Suffice it to say we’ve put a lot of thought into finding an excellent place to buy a home.
So all that thinking has come to this moment where we get to spell out how we’d approach finding an up-and-coming place to live in Utah. Put differently, the analysis will try to find places in Utah with undervalued homes relative to pent-up demand using Saturday Night Science.
To do that, we looked at the most recent American Community Survey Census data for 2020-2024 and compared it to the previous vintage. Specifically, we used the following criteria:
- Y-o-Y Change In Population (People want to live here)
- Y-o-Y Change In Median Home Prices (People are willing to pay for it)
- Home Prices Relative To The State Average (It’s still kinda cheap)
We want places that are growing, have seen home prices increase in recent years, and are still “cheap” for Utah with the following caveats:
- Home prices had to be within 20% of the state average (Much lower than that, and you get to some of the more dangerous places)
- Home prices increased in the last year, and
- Above 5,000 people (Bigger cities have more data points)
So of the 0 cities and towns in Utah, only 90 places made it through our initial filters to even be considered.
We then ranked each place from 1 to 90 for the above criteria, with 1 being the best. We averaged the rankings to create a “best place to buy” index, with the place having the lowest index being the best.
Turns out that Hyde Park is the best potential gem in the not-so-rough in the Beehive State.
Summary: The Best Places To Purchase A House In Utah for 2026
There’s our analysis of the best places to buy a house in Utah. And, to be clear, we aren’t necessarily saying these places are the best places to live, just that it looks like they might be in a couple of years based on the data.
In fact, every place in the following table meets our criteria, so even though it may not look super long, remember we started off with all 0 places in the state.
The best cities to buy a house in Utah are Hyde Park, Kanab, Perry, Midway, Moab, Sunset, West Bountiful, Nephi, Fruit Heights, and Harrisville.
So if we’d could rent or buy in these cities, we’d definitely buy.
For more Utah reading, check out:
Best Places To Buy A Home In Utah
| Rank | City | Population | Median Home Price | Population Change | Home Price Increase |
|---|---|---|---|---|---|
| 1 | Hyde Park | 5,540 | $570,837 | 2.4% | 0.5% |
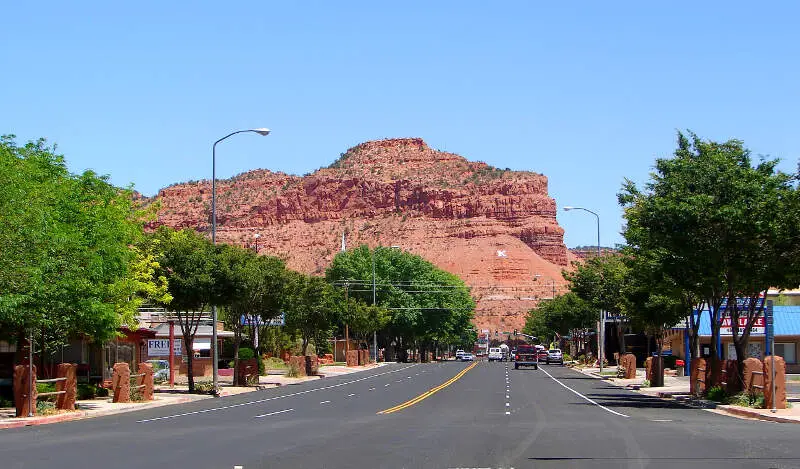
| 2 | Kanab | 5,081 | $432,201 | 2.6% | 2.3% |
| 3 | Perry | 5,843 | $533,898 | 2.4% | 1.0% |
| 4 | Midway | 6,171 | $934,920 | 1.0% | -4.6% |
| 5 | Moab | 5,312 | $543,316 | -0.1% | -3.0% |
| 6 | Sunset | 5,587 | $377,637 | 0.4% | 1.7% |
| 7 | West Bountiful | 5,915 | $602,324 | -0.1% | 1.0% |
| 8 | Nephi | 6,885 | $452,333 | 2.8% | 2.3% |
| 9 | Fruit Heights | 6,023 | $758,826 | -0.2% | 1.3% |
| 10 | Harrisville | 6,935 | $451,087 | 0.2% | 1.6% |
| 11 | Nibley | 7,952 | $484,028 | 3.9% | 0.1% |
| 12 | Enoch | 8,144 | $454,954 | 3.7% | 2.0% |
| 13 | Roosevelt | 7,078 | $350,392 | 1.7% | 2.1% |
| 14 | Plain City | 8,396 | $636,932 | 3.6% | 2.6% |
| 15 | Farr West | 7,952 | $635,263 | 0.9% | 0.9% |
| 16 | Ephraim | 5,949 | $465,611 | 2.5% | -1.6% |
| 17 | South Weber | 8,115 | $603,379 | 1.0% | 1.6% |
| 18 | Providence | 8,947 | $527,895 | 3.1% | 5.7% |
| 19 | Richfield | 8,224 | $329,292 | 0.6% | 2.0% |
| 20 | Santa Clara | 8,152 | $536,258 | 3.3% | 1.4% |
| 21 | Price | 8,248 | $310,715 | 0.4% | 0.8% |
| 22 | Salem | 10,324 | $611,418 | 4.4% | -0.9% |
| 23 | Hyrum | 10,401 | $445,965 | 3.8% | 1.8% |
| 24 | Park City | 8,362 | $1,588,140 | -0.0% | 4.3% |
| 25 | Vineyard | 14,446 | $525,876 | 6.9% | 0.6% |
| 26 | Riverdale | 9,279 | $461,455 | -0.2% | 1.0% |
| 27 | Hooper | 9,338 | $644,645 | 1.3% | 1.0% |
| 28 | Tremonton | 11,477 | $431,066 | 5.4% | 1.9% |
| 29 | Ivins | 9,998 | $617,241 | 5.0% | 0.8% |
| 30 | Washington Terrace | 9,182 | $396,701 | -0.2% | 1.0% |
| 31 | Cedar Hills | 9,950 | $665,410 | 0.1% | 1.2% |
| 32 | Mapleton | 13,114 | $730,776 | 6.3% | -2.5% |
| 33 | Vernal | 10,392 | $290,521 | 1.3% | 0.8% |
| 34 | Pleasant View | 11,217 | $671,686 | 1.0% | -0.0% |
| 35 | Alpine | 10,392 | $1,172,441 | 1.2% | 1.5% |
| 36 | West Point | 11,929 | $554,465 | 3.2% | 0.9% |
| 37 | North Logan | 11,460 | $545,674 | 2.1% | 2.0% |
| 38 | Lindon | 11,765 | $726,560 | 1.5% | 0.8% |
| 39 | Woods Cross | 11,531 | $531,312 | 0.4% | 1.7% |
| 40 | Grantsville | 14,341 | $528,196 | 5.2% | 0.6% |
| 41 | Smithfield | 14,408 | $464,322 | 2.7% | -0.4% |
| 42 | Santaquin | 16,436 | $494,553 | 6.8% | 0.1% |
| 43 | Bluffdale | 18,797 | $612,682 | 3.5% | -0.4% |
| 44 | West Haven | 21,563 | $528,107 | 7.9% | 0.6% |
| 45 | Heber | 18,015 | $718,911 | 3.3% | 7.9% |
| 46 | South Ogden | 17,650 | $431,143 | 0.5% | 1.3% |
| 47 | Centerville | 16,679 | $588,128 | -0.1% | 1.9% |
| 48 | Hurricane | 22,771 | $504,102 | 5.0% | 0.5% |
| 49 | Highland | 20,119 | $971,049 | 2.5% | 0.8% |
| 50 | Brigham City | 19,992 | $413,632 | 1.0% | 2.7% |
| 51 | North Ogden | 21,947 | $531,733 | 2.2% | 1.1% |
| 52 | Payson | 23,039 | $468,627 | 3.8% | 0.8% |
| 53 | North Salt Lake | 23,474 | $575,885 | 1.0% | 0.9% |
| 54 | Clinton | 23,612 | $497,696 | 0.5% | 1.5% |
| 55 | Farmington | 25,389 | $692,138 | 1.8% | 1.7% |
| 56 | South Salt Lake | 26,352 | $440,874 | 0.3% | 2.4% |
| 57 | Washington | 32,348 | $544,670 | 5.4% | 0.1% |
| 58 | Syracuse | 35,488 | $584,933 | 4.3% | 0.9% |
| 59 | Holladay | 31,099 | $832,129 | -0.4% | 2.7% |
| 60 | Saratoga Springs | 48,425 | $560,223 | 9.9% | -1.4% |
| 61 | Clearfield | 33,523 | $424,500 | 1.9% | 1.5% |
| 62 | American Fork | 37,109 | $525,230 | 5.1% | 2.1% |
| 63 | Kaysville | 33,053 | $682,325 | 0.6% | 1.8% |
| 64 | Springville | 35,849 | $509,191 | 1.1% | 1.9% |
| 65 | Cedar City | 38,524 | $403,486 | 3.6% | 1.5% |
| 66 | Midvale | 35,989 | $492,782 | 0.7% | 1.6% |
| 67 | Cottonwood Heights | 32,828 | $777,467 | -0.5% | 2.3% |
| 68 | Tooele | 38,405 | $432,504 | 3.1% | -0.0% |
| 69 | Eagle Mountain | 53,290 | $510,057 | 7.6% | -0.6% |
| 70 | Pleasant Grove | 37,852 | $555,047 | 0.8% | 2.4% |
| 71 | Roy | 38,993 | $436,793 | -0.1% | 1.9% |
| 72 | Spanish Fork | 44,946 | $514,916 | 3.0% | 1.5% |
| 73 | Riverton | 45,457 | $625,363 | 1.1% | 1.4% |
| 74 | Bountiful | 45,023 | $578,283 | -0.2% | 2.6% |
| 75 | Herriman | 59,346 | $607,545 | 3.5% | 0.6% |
| 76 | Draper | 50,278 | $806,898 | 0.2% | 0.8% |
| 77 | Murray | 50,188 | $551,623 | 0.6% | 2.6% |
| 78 | Logan | 54,907 | $391,018 | 1.8% | 1.0% |
| 79 | Taylorsville | 58,678 | $497,265 | -0.6% | 2.1% |
| 80 | Lehi | 85,173 | $568,596 | 5.1% | 1.2% |
| 81 | South Jordan | 82,686 | $665,928 | 2.9% | 1.3% |
| 82 | Layton | 83,286 | $527,622 | 0.9% | 1.7% |
| 83 | Ogden | 87,413 | $400,513 | 0.5% | 1.0% |
| 84 | St. George | 101,995 | $519,369 | 2.8% | 0.7% |
| 85 | Sandy | 94,291 | $665,522 | -0.5% | 2.1% |
| 86 | Orem | 97,182 | $504,054 | 0.1% | 1.8% |
| 87 | West Jordan | 116,692 | $561,836 | 0.4% | 1.9% |
| 88 | Provo | 114,766 | $484,203 | 0.4% | 1.7% |
| 89 | West Valley City | 138,437 | $471,862 | 0.3% | 1.9% |
| 90 | Salt Lake City | 208,007 | $573,181 | 2.0% | 2.4% |