Living in Upper Peralta Creek-Bartlett, Oakland, CA
Living In Upper Peralta Creek-Bartlett, Oakland Summary
Life in Upper Peralta Creek-Bartlett, Oakland, CA summary. HomeSnacks has been researching the quality of life in Upper Peralta Creek-Bartlett over the past eight years using Census, FBI, cost of living, and other primary data sources. Based on the most recently available data, we found the following about life in Upper Peralta Creek-Bartlett:
The population in Upper Peralta Creek-Bartlett is 3,256.
The median home value in Upper Peralta Creek-Bartlett is $371,600.
The median income in Upper Peralta Creek-Bartlett is $48,575.
The median rent in Upper Peralta Creek-Bartlett is $1,365.
The unemployment rate in Upper Peralta Creek-Bartlett is 8.4%.
The crime rate in Upper Peralta Creek-Bartlett is 3211 per 100k people.
Table Of Contents
Upper Peralta Creek-Bartlett, Oakland Quality Of Life
/10
Upper Peralta Creek-Bartlett, Oakland Crime Report
Crime in Upper Peralta Creek-Bartlett, Oakland summary. We derived crime rates by looking data from the FBI for Oakland and estimating down to Upper Peralta Creek-Bartlett. Key points include:
There were 105 total crimes in Upper Peralta Creek-Bartlett in the last reporting year.
The overall crime rate per 100,000 people in Upper Peralta Creek-Bartlett is 3,211 / 100k people.
The violent crime rate per 100,000 people in Upper Peralta Creek-Bartlett is 566 / 100k people.
The property crime rate per 100,000 people in Upper Peralta Creek-Bartlett is 2,645 / 100k people.
Overall, crime in Upper Peralta Creek-Bartlett is 38.16% above the national average.
Total Crimes
Above National Average
Crime In Upper Peralta Creek-Bartlett, Oakland vs Oakland Comparison Table
| Statistic | Count Raw |
Upper Peralta Creek-Bartlett / 100k People |
Oakland / 100k People |
California / 100k People |
National / 100k People |
|---|---|---|---|---|---|
| Total Crimes Per 100K | 105 | 3,211 | 7,996.1 | 2,581.0 | 2,324.2 |
| Violent Crime | 18 | 566 | 1,521.1 | 442.0 | 369.8 |
| Property Crime | 86 | 2,645 | 6,474.9 | 2,138.9 | 1,954.4 |
Upper Peralta Creek-Bartlett, Oakland Cost Of Living
Cost of living in Upper Peralta Creek-Bartlett, Oakland summary. We use data on the cost of living to determine how expensive it is to live in Upper Peralta Creek-Bartlett. Real estate prices and rent drive most of the variance in cost of living around Oakland. Key points include:
The cost of living in Upper Peralta Creek-Bartlett is 143 with 100 being average.
The cost of living in Oakland is 0.9x lower than the city average.
The median home value in Upper Peralta Creek-Bartlett is $371,600.
The median rent in Upper Peralta Creek-Bartlett is $1,365.
Oakland's Overall Cost Of Living
Home Prices
Rent
Cost Of Living In Upper Peralta Creek-Bartlett, Oakland Comparison Table
| Living Expense | Upper Peralta Creek-Bartlett | Oakland | California | National Average |
|---|---|---|---|---|
| Overall | 143 | 157 | 139 | 100 |
| Services | 119 | 117 | 110 | 100 |
| Groceries | 128 | 134 | 112 | 100 |
| Health | 122 | 109 | 100 | |
| Housing | 184 | 228 | 204 | 100 |
| Transportation | 140 | 145 | 126 | 100 |
| Utilities | 131 | 134 | 124 | 100 |
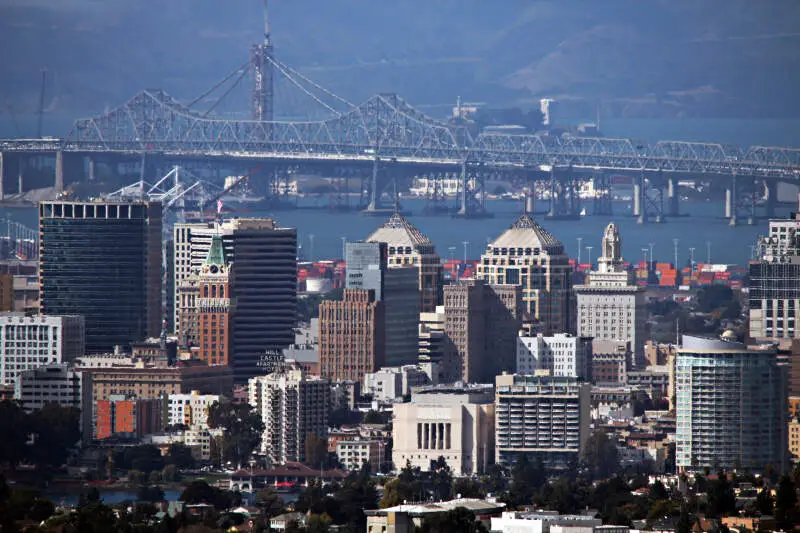
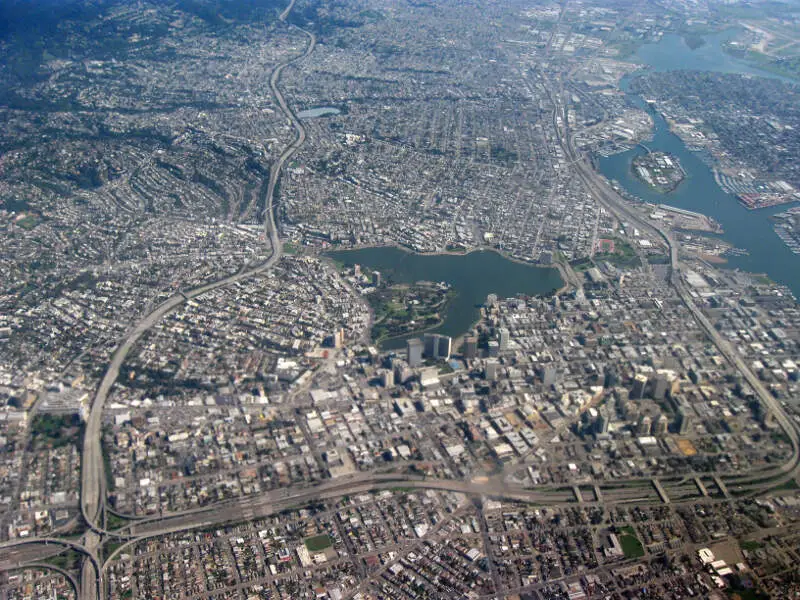
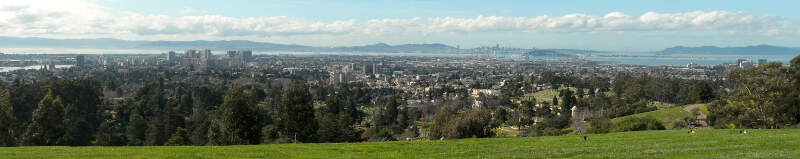
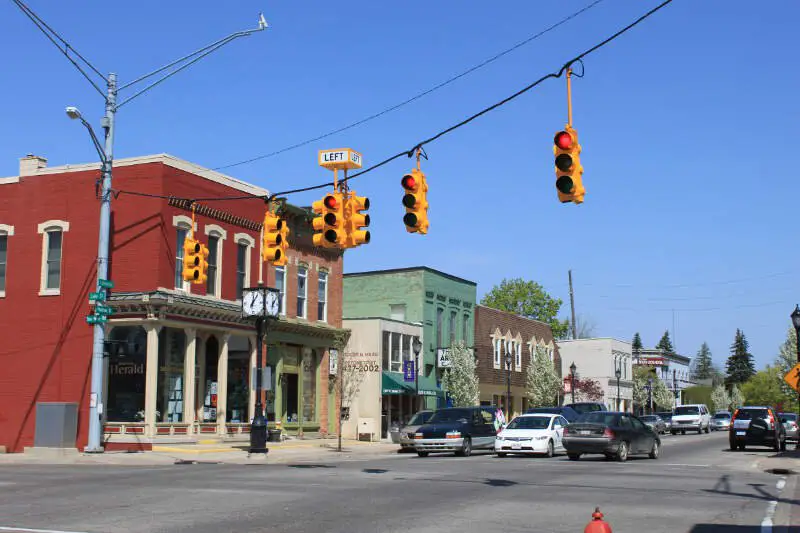
Upper Peralta Creek-Bartlett, Oakland Photos