Everyone wants a bit of a blissful breeze or a scoop of sunny sanctuary when looking for a place to live in Kansas.
The more sun, the more you can go outside. The more you go outside, the more you’ll feel at peace. The more you’ll feel at peace, the more you’ll enjoy where you live.
So it makes sense to try and find the places with the best weather in Kansas. We used Saturday Night Science to compare the number of sunny days, total precipitation, and the deviation from the ideal 70-degree weather for 36 places in Kansas over 10,000 people.
Grab your shades and put away your raincoat as we look at the cities with the best weather in Kansas.
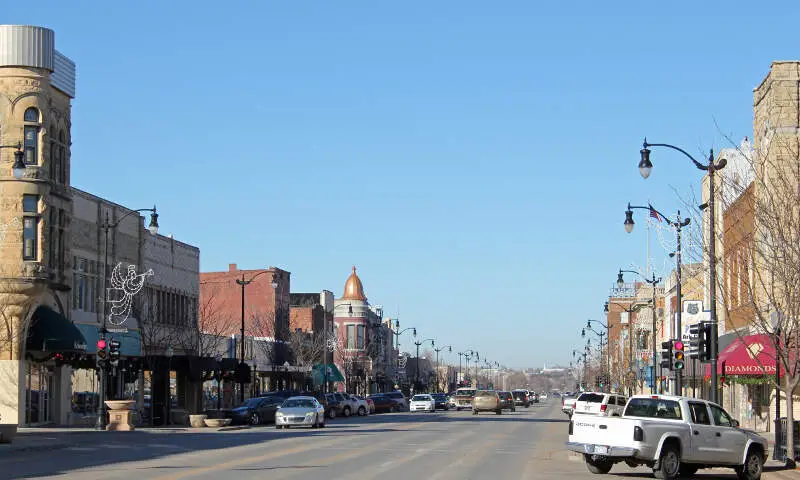
307.8 sunny days · 69.9 degree average high
Arkansas City is a city in Cowley County, Kansas, United States, situated at the confluence of the Arkansas and Walnut rivers in the southwestern part of the county. As of the 2010 census, the city population was 12,415.
Data | Crime | Cost of living | Movers
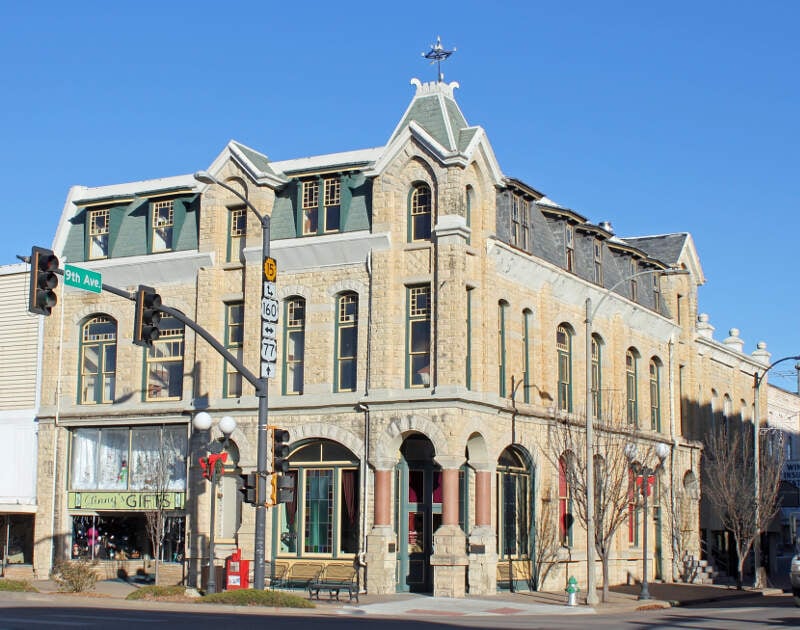
309.3 sunny days · 69.3 degree average high
Winfield is a city and county seat of Cowley County, Kansas, United States. It is situated along the Walnut River in South Central Kansas. As of the 2010 census, the city population was 12,301 and second most populous city of Cowley County.
Data | Crime | Cost of living | Movers
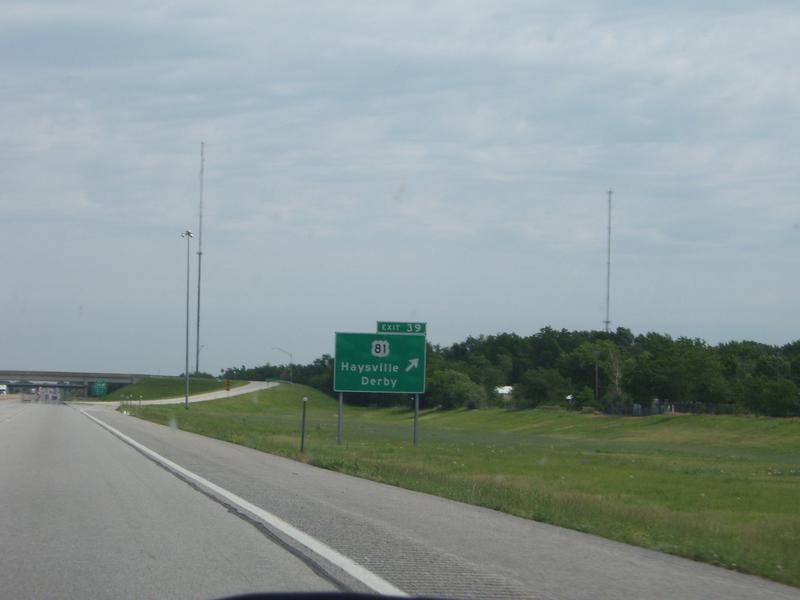
311.1 sunny days · 68.0 degree average high
Haysville is a city in Sedgwick County, Kansas, United States, and a suburb of Wichita. As of the 2010 census, the city population was 10,826. Haysville is known as the “Peach Capital of Kansas”.
Data | Crime | Cost of living | Movers
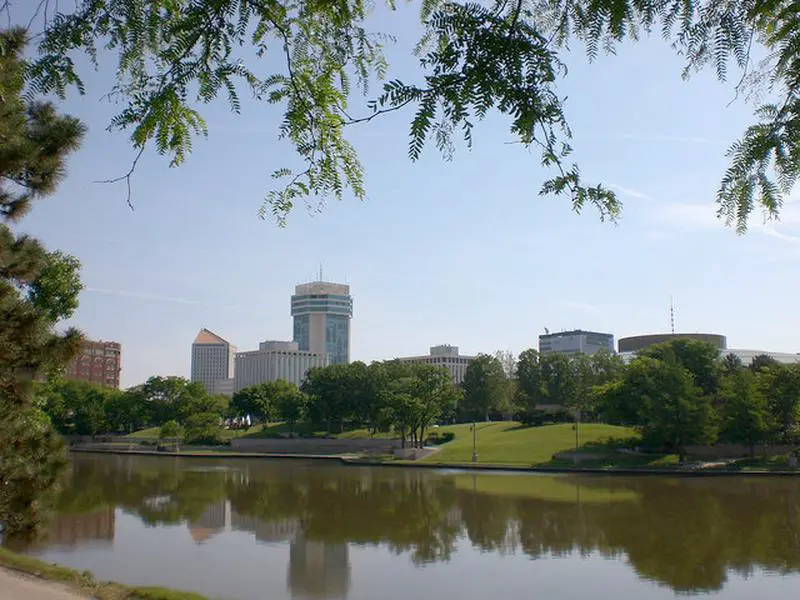
311.8 sunny days · 67.6 degree average high
Wichita is the largest city in the U.S. state of Kansas. Located in south-central Kansas on the Arkansas River, Wichita is the county seat of Sedgwick County and the principal city of the Wichita metropolitan area whose estimated population in 2015 was 644,610. As of 2016, the city of Wichita had an estimated population of 389,902.
Data | Crime | Cost of living | Movers | Compare
309.4 sunny days · 67.7 degree average high
Derby is a city in Sedgwick County, Kansas, United States and the largest suburb of Wichita. As of the 2010 census, the city population was 22,158.
Data | Crime | Cost of living | Movers
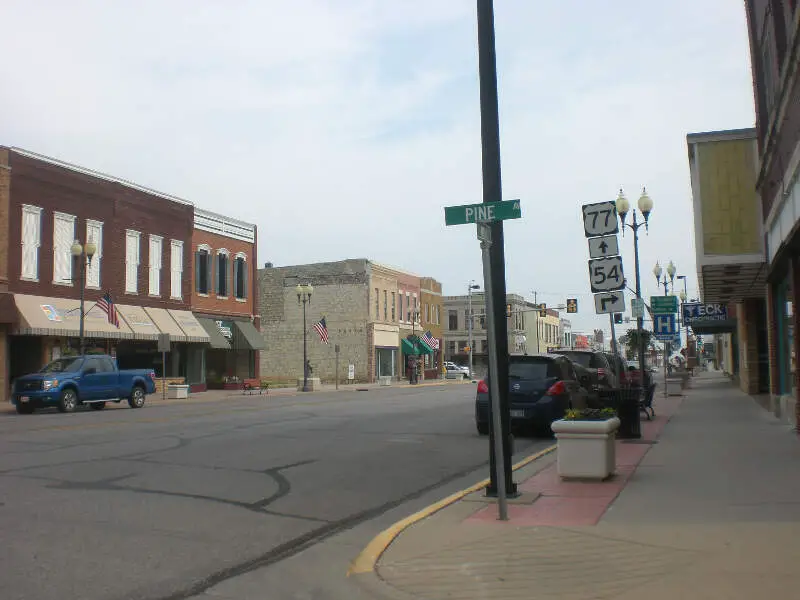
304.9 sunny days · 67.8 degree average high
El Dorado EL-d-RAY-doh) is city and county seat of Butler County, Kansas, United States. It is situated along the Walnut River in the central part of Butler County and located in south-central Kansas. As of the 2010 census, the city population was 13,021.
Data | Crime | Cost of living | Movers
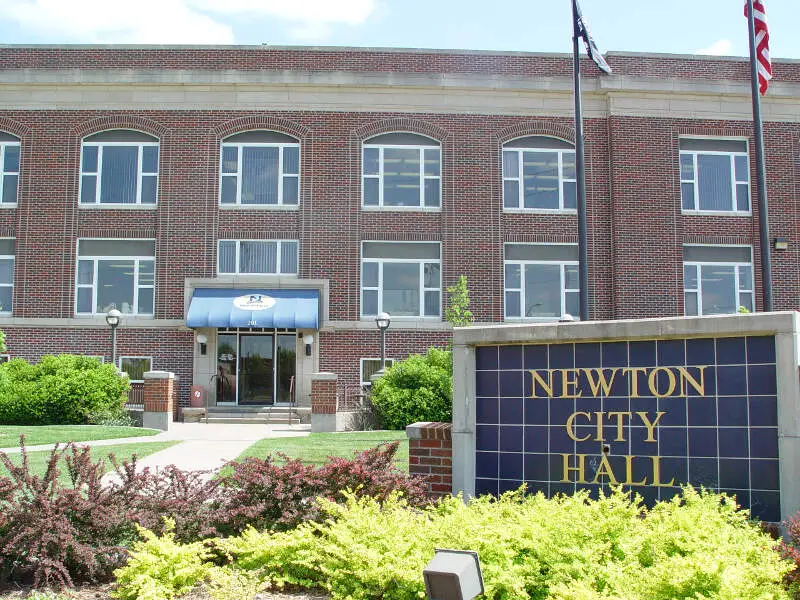
312.5 sunny days · 67.0 degree average high
Newton is a city in and the county seat of Harvey County, Kansas, United States. As of the 2010 census, the city population was 19,132. Newton is located 25 miles north of Wichita. The city of North Newton is located immediately north, existing as a separate political entity.
Data | Crime | Cost of living | Movers
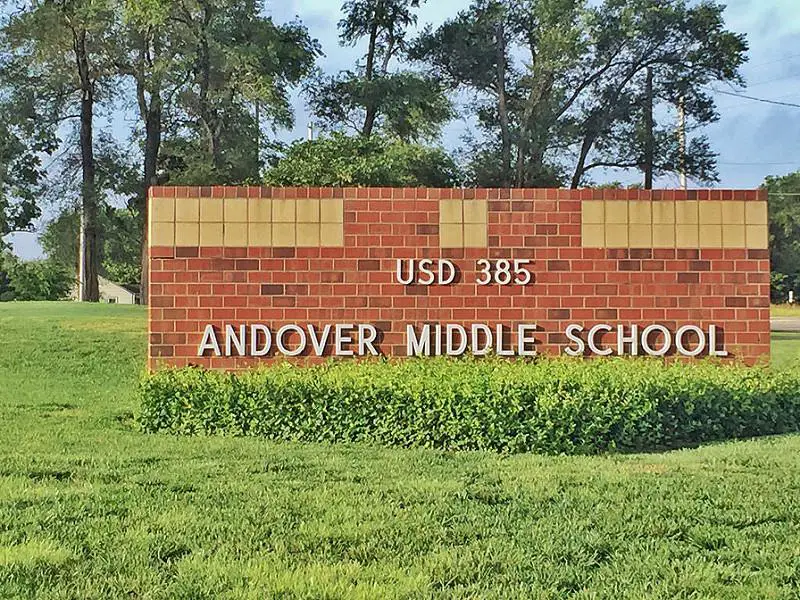
310.2 sunny days · 67.5 degree average high
Andover is a city in Butler County, Kansas, United States, and a suburb of Wichita. As of the 2010 census, the city population was 11,791.
Data | Crime | Cost of living | Movers
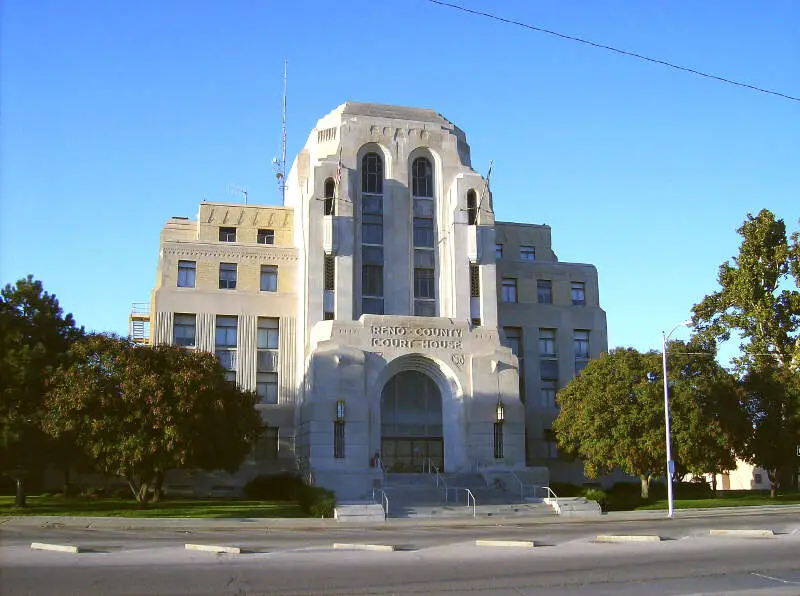
313.5 sunny days · 67.4 degree average high
Hutchinson is the largest city and county seat in Reno County, Kansas, United States, and located on the Arkansas River. It has been home to salt mines since 1887, thus its nickname of “Salt City”, but locals call it “Hutch”. As of the 2010 census, the city population was 42,080.
Data | Crime | Cost of living | Movers

328.0 sunny days · 70.3 degree average high
Liberal is the county seat of Seward County, Kansas, United States. As of the 2010 census, the city population was 20,525.
Data | Crime | Cost of living | Movers
The receipts
Compare the top ten
Pick a metric. The bars rescale. The red line is Kansas’s statewide median.
On the map
Where Kansas’s best weather is
Saturday Night Science
How We Determined The Cities In Kansas With The Best Weather
To rank the most fair weather cities in Kansas, we used Saturday Night Science and the National Oceanic and Atmospheric Administration (NOAA) database, to see which cities in the Sunflower State get the best weather.
We used the following criteria to find the best weather:
- Number of sunny days
- Highest average low
- Average high deviation from 70 degrees
- Least amount of rain
- Least amount of snow
We ranked each city of over 10,000 people in Kansas from best to worst on each criterion. We then averaged each ranking into a weather quality index. The city with the best index, Arkansas City, was anointed the city with the best weather in Kansas.
Before we get too far, here are the annual precipitation rates for major cities: Wichita (34.5 inches), Overland Park (40.9 inches), and Kansas City (40.1 inches).
The cities with the best weather in Kansas are Arkansas City, Winfield, Haysville, Wichita, Derby, El Dorado, Newton, Andover, Hutchinson, and Liberal.
There’s a complete chart at the bottom.
The full plate
Detailed List Of Places With The Best Weather In Kansas
Click any column to sort. Search by city name.
| Rank | City | Population | Sunny Days | Avg. High | Precipitation (Inches) | Snow (Inches) |
|---|---|---|---|---|---|---|
| 1 | Arkansas City | 12,253 | 307.8 | 69.9 | 38.2 | 5.3 |
| 2 | Winfield | 12,286 | 309.3 | 69.3 | 38.4 | 8.5 |
| 3 | Haysville | 11,234 | 311.1 | 68.0 | 34.7 | 13.1 |
| 4 | Wichita | 387,147 | 311.8 | 67.6 | 34.5 | 13.2 |
| 5 | Derby | 23,731 | 309.4 | 67.7 | 35.0 | 12.9 |
| 6 | El Dorado | 12,910 | 304.9 | 67.8 | 36.8 | 6.9 |
| 7 | Newton | 19,139 | 312.5 | 67.0 | 33.1 | 11.7 |
| 8 | Andover | 12,293 | 310.2 | 67.5 | 36.4 | 11.7 |
| 9 | Hutchinson | 41,808 | 313.5 | 67.4 | 31.1 | 13.5 |
| 10 | Liberal | 20,819 | 328.0 | 70.3 | 19.5 | 19.1 |
| 11 | Parsons | 10,223 | 305.0 | 67.6 | 43.4 | 9.2 |
| 12 | Hays | 20,992 | 319.7 | 67.1 | 23.8 | 13.5 |
| 13 | Garden City | 27,007 | 327.8 | 68.0 | 19.3 | 19.9 |
| 14 | Great Bend | 15,850 | 311.6 | 67.7 | 26.5 | 15.7 |
| 15 | Dodge City | 28,045 | 321.2 | 68.0 | 21.8 | 20.1 |
| 16 | McPherson | 13,212 | 317.6 | 67.5 | 32.0 | 16.3 |
| 17 | Salina | 47,840 | 309.8 | 67.5 | 30.8 | 16.8 |
| 18 | Pittsburg | 20,382 | 296.7 | 67.7 | 45.8 | 11.2 |
| 19 | Emporia | 24,739 | 309.1 | 66.2 | 37.5 | 13.8 |
| 20 | Ottawa | 12,487 | 301.9 | 66.3 | 39.7 | 12.2 |
| 21 | Junction City | 24,823 | 311.1 | 66.7 | 33.6 | 16.9 |
| 22 | Manhattan | 55,769 | 308.9 | 66.2 | 33.7 | 15.1 |
| 23 | Kansas City | 148,855 | 301.2 | 65.5 | 40.1 | 15.0 |
| 24 | Lawrence | 91,305 | 301.9 | 65.2 | 38.9 | 13.0 |
| 25 | Gardner | 20,466 | 303.5 | 65.1 | 40.7 | 11.6 |
| 26 | Topeka | 127,672 | 304.3 | 65.5 | 36.9 | 16.2 |
| 27 | Leawood | 33,339 | 299.2 | 65.4 | 40.7 | 14.5 |
| 28 | Prairie Village | 21,814 | 299.1 | 65.2 | 40.3 | 14.3 |
| 29 | Merriam | 11,232 | 300.3 | 65.2 | 40.6 | 14.5 |
| 30 | Olathe | 131,508 | 303.3 | 65.1 | 41.0 | 15.2 |
| 31 | Overland Park | 181,464 | 299.7 | 65.1 | 40.9 | 14.6 |
| 32 | Shawnee | 64,125 | 299.3 | 65.3 | 40.5 | 15.5 |
| 33 | Lansing | 11,623 | 301.7 | 65.2 | 39.6 | 17.2 |
| 34 | Lenexa | 50,412 | 301.0 | 65.1 | 40.6 | 15.5 |
| 35 | Leavenworth | 35,861 | 301.3 | 64.9 | 39.4 | 16.9 |
| 36 | Atchison | 10,858 | 300.3 | 64.9 | 36.9 | 17.9 |
Source: NOAA climate data. 36 Kansas cities with more than 10,000 residents.
Summary
Summary: The Cities With The Best Weather In Kansas For 2026
If you’re looking for the Kansas cities with the most sunny days, the least rain and snow, and highs closest to a perfect 70 degrees, this is an accurate list.
The cities with the best weather in Kansas are Arkansas City, Winfield, Haysville, Wichita, Derby, El Dorado, Newton, Andover, Hutchinson, and Liberal. Not sold on Kansas? Take the two-minute Find Your Place quiz and see which state actually fits you.
Questions and answers
Best Weather In Kansas FAQs
What city in Kansas has the best weather?
Arkansas City has the best weather of any city in Kansas for 2026, according to Saturday Night Science. Winfield and Haysville are next.
What are the Kansas cities with the best weather?
The best-weather cities in Kansas are Arkansas City, Winfield, Haysville, Wichita, Derby, El Dorado, Newton, Andover, Hutchinson, and Liberal. We ranked all 36 cities with more than 10,000 residents.
How do you score weather?
Weather quality blends sunny days, rainfall, snowfall, and how close the average high sits to a perfect 70 degrees, using NOAA data. The city closest to that mix, Arkansas City, wins.
How much rain do Kansas’s biggest cities get?
Wichita averages 34.5 inches of precipitation a year, Overland Park gets 40.9, and Kansas City gets 40.1. The ranking rewards the cities that dodge most of it.
Which Kansas city has the toughest weather?
Atchison ranks last for weather in Kansas — more rough days, fewer perfect ones. The locals would probably tell you it builds character.


