Before you decide to relocate to Colorado, it’s important to research the exact cost of living around the state. And that’s what we’re going to help you do.
These are the places in Colorado that cost a pretty penny — the most expensive cities in the state.
We used Saturday Night Science to compare the 2020-2024 American Community Survey on cost of living for the 76 places in Colorado with more than 5,000 people.
After we saved up for months and could finally afford it, we landed on this list of the ten most expensive cities in Colorado for 2026.
$250,001 median income · $3,182,803 median home · #2 home prices in Colorado
The City of Cherry Hills Village is a home rule municipality located in Arapahoe County, Colorado, United States. The city population was 5987 at the 2010 United States Census. Cherry Hills Village is a part of the Denver-Aurora-Lakewood, CO Metropolitan Statistical Area. It is one of the most affluent places in Colorado and the United States.
The city hosted two PGA Championships and the 2005 U.S. Women’s Open at the Cherry Hills Country Club.
The community was named for a grove of cherry trees near the original town site.
Data | Crime | Cost of living | Movers
$149,029 median income · $1,414,364 median home · #4 home prices in Colorado
The City of Greenwood Village is a Home Rule Municipality located in Arapahoe County, Colorado, United States. The city is a part of the Denver-Aurora-Lakewood, CO Metropolitan Statistical Area. As of 2010, the city has a total population of 13,925.
Data | Crime | Cost of living | Movers

$87,493 median income · $964,531 median home · #8 home prices in Colorado
Boulder is the home rule municipality that is the county seat and the most populous municipality of Boulder County, and the 11th most populous municipality in the U.S. state of Colorado. Boulder is located at the base of the foothills of the Rocky Mountains at an elevation of 5,430 feet above sea level. The city is 25 miles northwest of Denver.
Data | Crime | Cost of living | Movers | Compare
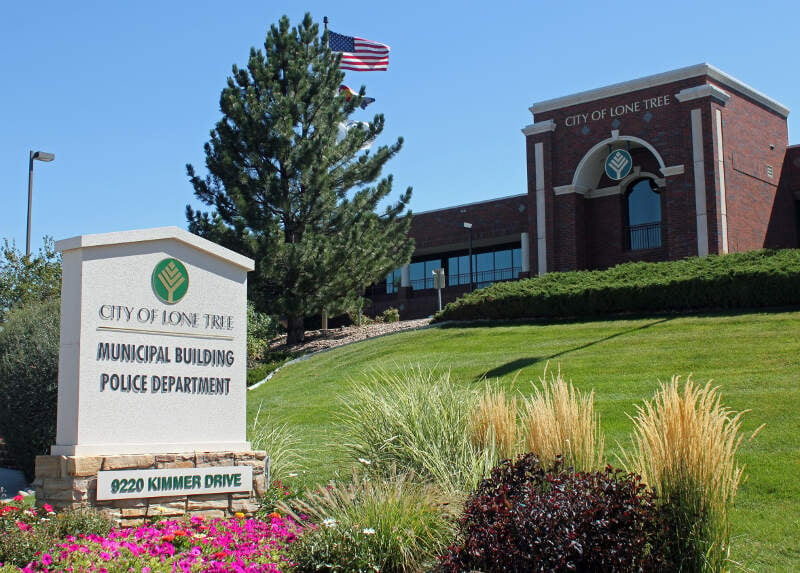
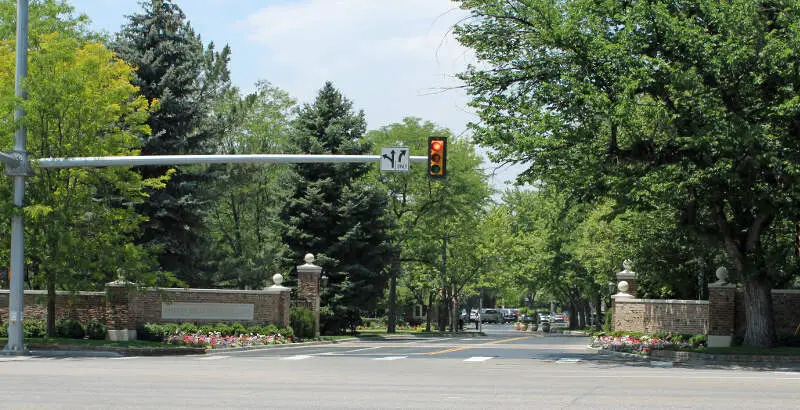
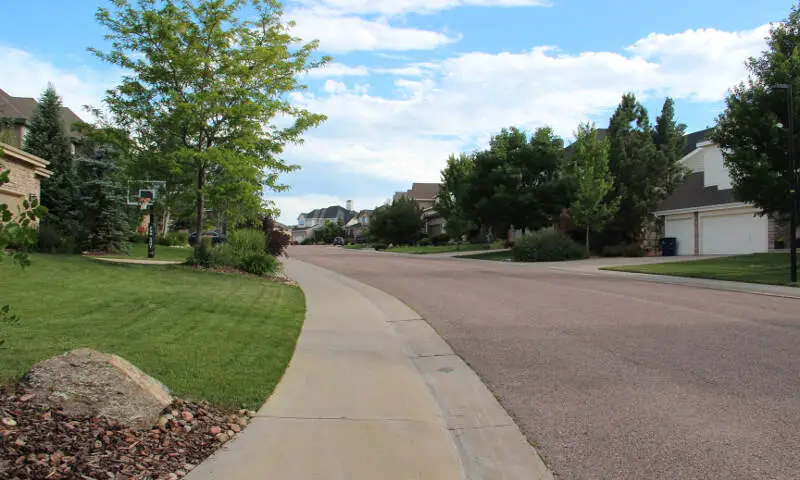
$123,741 median income · $894,853 median home · #10 home prices in Colorado
Data | Crime | Cost of living | Movers
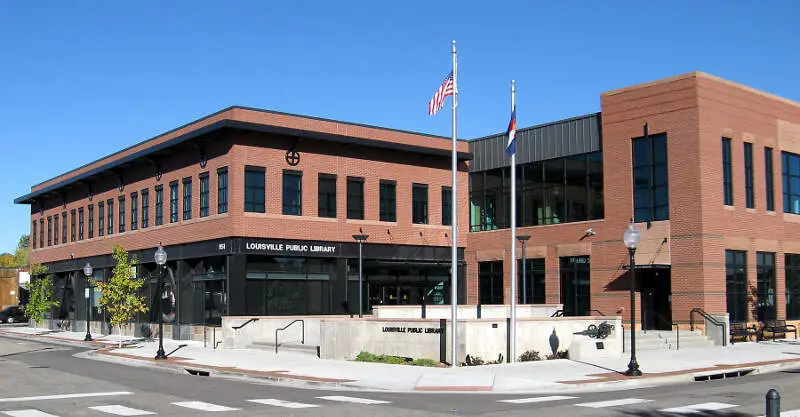
$147,319 median income · $837,473 median home · #13 home prices in Colorado
Louisville Colorado is a Home Rule Municipality in Boulder County, Colorado, United States. The city population was 18,376 at the 2010 United States Census. Louisville began as a rough mining community in 1877, suffered through a period of extraordinary labor violence early in the 20th century, and then, when the mines closed in the 1950s, made a transition to a suburban residential community. CNN/Money and Money magazine have consistently listed Louisville as one of the 100 best places to live in the United States, ranking it among the top 100 in 2007, 2009 2011, 2013, 2015, and 2017.
Data | Crime | Cost of living | Movers
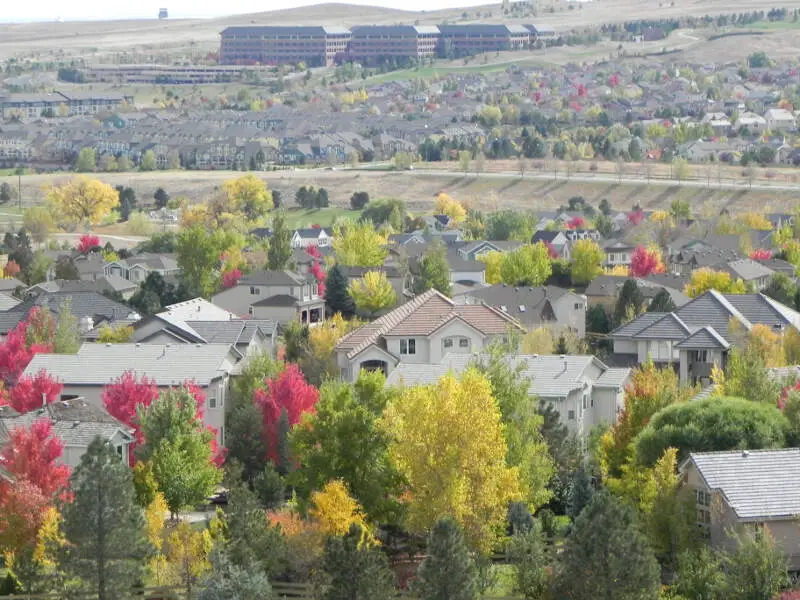
$191,229 median income · $895,088 median home · #9 home prices in Colorado
The City of Castle Pines is statutory city located in Douglas County, Colorado, United States. As of the 2010 census, the population of the city was 10,360. By 2013, the United States Census Bureau estimated the population to have increased to 10,726. The city is situated 19 miles south-southeast of the Colorado State Capitol in Denver. The city is located north of the Town of Castle Rock and south of the City of Lone Tree, Colorado.
Data | Crime | Cost of living | Movers
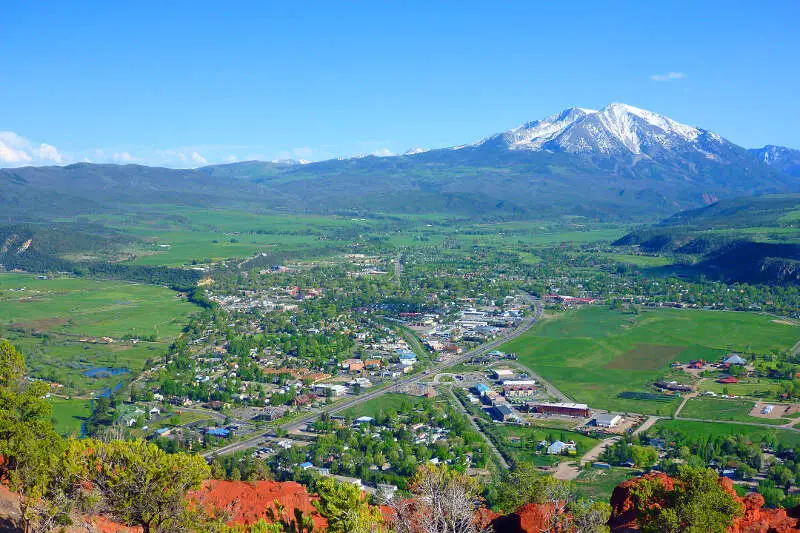
$108,324 median income · $1,437,953 median home · #3 home prices in Colorado
The Town of Carbondale is a Home Rule Municipality in Garfield County, Colorado, United States. The town population was 6427 at the 2010 United States Census. The town is located in the Roaring Fork Valley, downstream from Aspen and upstream from the mouth of the Roaring Fork River at Glenwood Springs. The town proper sits on the south bank of the river, at the confluence of the Crystal River. Carbondale’s horizon is dominated by the 12,953ft tall Mount Sopris several miles to the south of town.
Data | Crime | Cost of living | Movers
$159,434 median income · $833,348 median home · #14 home prices in Colorado
Superior is a Statutory Town in Boulder County in the U.S. state of Colorado, with a small, uninhabited segment of land area extending into Jefferson County. According to the 2010 census, the population of the city was 12,483.
Data | Crime | Cost of living | Movers
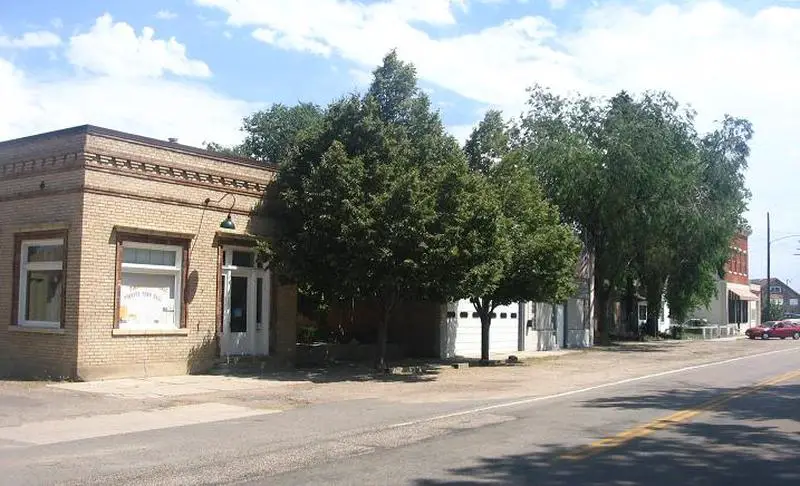
$178,257 median income · $675,535 median home · #23 home prices in Colorado
Data | Crime | Cost of living | Movers
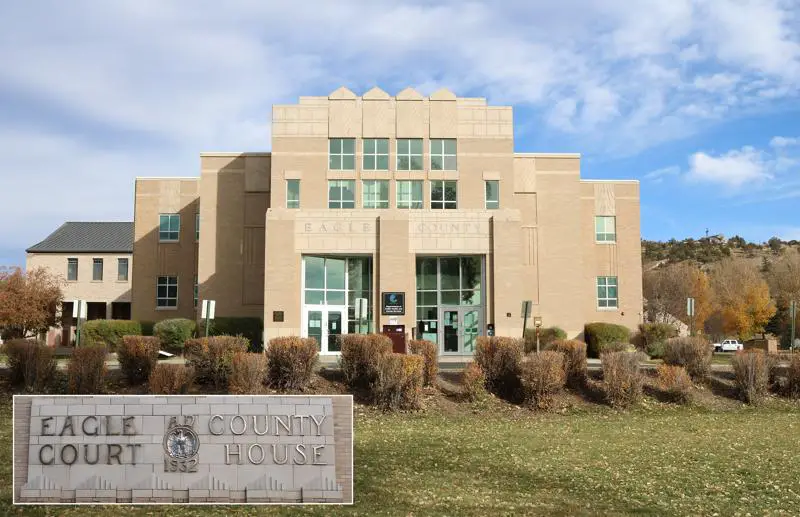
$110,398 median income · $1,028,575 median home · #7 home prices in Colorado
Eagle is a statutory town that is the county seat of Eagle County, Colorado, United States. The population was 6,508 at the 2010 census, up from 3,032 at the 2000 census.
Data | Crime | Cost of living | Movers
The receipts
Compare the top ten
Pick a metric. The bars rescale. The red line is Colorado’s statewide median.
Colorado statewide median: $541,842
Colorado statewide median: $95,470
On the map
Mapping the most expensive places in Colorado
Saturday Night Science
Methodology: How We Determined The Most Expensive Places To Live In The Centennial State For 2026
The two most important things to think about when it comes to being able to afford a city in Colorado are how much money you make and how much you have to spend to live there.
You need to understand your costs in the context of how much money you make.
For example, if the median household earns $100,000 and spends $40,000 on housing, it’s actually cheaper to live there than a place with a median income of $50,000 and housing costs of $21,000. You might spend more on housing, but you have more money overall to play with.
With that example in mind, we derived several statistics from the latest Census American Community Survey 2020-2024 around incomes and costs. They are:
- Overall Cost Of Living Index
- Median Home Price / Median Income (lower is better)
- Median Income / Median Rent (Higher is better)
- Median Home Price
You can then compare these metrics in each of the places in Colorado to figure out which is the most expensive.
You are left with a “Cost of Living Index” by taking the average rank of each of these metrics for each city.
So we used that cost of living index to rank all of the 76 places in Colorado that have more than 5,000 people.
The place with the highest cost of living in Colorado according to the data is Cherry Hills Village. We updated this article for 2026. This article is our eleventh time ranking the most expensive places to live in Colorado. The median Colorado home is 37 years old — old enough that it pays to compare home warranty plans before something expensive breaks.
The full plate
Most Expensive Cities In Colorado
Click any column to sort. Search by city name.
| Rank | City | Cost Of Living | Population | Median Income | Average Home Price | Home/Income Ratio |
|---|---|---|---|---|---|---|
| 1 | Cherry Hills Village | 315 | 6,354 | $250,001 | $3,182,803 | 12.7x |
| 2 | Greenwood Village | 201 | 15,420 | $149,029 | $1,414,364 | 9.5x |
| 3 | Boulder | 176 | 106,433 | $87,493 | $964,531 | 11.0x |
| 4 | Lone Tree | 170 | 14,147 | $123,741 | $894,853 | 7.2x |
| 5 | Louisville | 164 | 20,786 | $147,319 | $837,473 | 5.7x |
| 6 | Castle Pines | 164 | 13,388 | $191,229 | $895,088 | 4.7x |
| 7 | Carbondale | 163 | 6,637 | $108,324 | $1,437,953 | 13.3x |
| 8 | Superior | 162 | 13,305 | $159,434 | $833,348 | 5.2x |
| 9 | Timnath | 162 | 8,941 | $178,257 | $675,535 | 3.8x |
| 10 | Eagle | 157 | 7,442 | $110,398 | $1,028,575 | 9.3x |
| 11 | Aspen | 156 | 6,756 | $74,033 | $3,535,613 | 47.8x |
| 12 | Erie | 155 | 33,808 | $173,349 | $725,091 | 4.2x |
| 13 | Golden | 154 | 20,417 | $98,582 | $863,815 | 8.8x |
| 14 | Avon | 153 | 5,972 | $89,027 | $1,258,435 | 14.1x |
| 15 | Steamboat Springs | 149 | 13,433 | $104,964 | $1,310,883 | 12.5x |
| 16 | Centennial | 145 | 108,201 | $131,928 | $649,086 | 4.9x |
| 17 | Lafayette | 144 | 30,602 | $119,040 | $676,851 | 5.7x |
| 18 | Denver | 142 | 718,877 | $94,718 | $539,666 | 5.7x |
| 19 | Castle Rock | 142 | 79,123 | $145,197 | $672,107 | 4.6x |
| 20 | Broomfield | 141 | 76,304 | $123,874 | $632,201 | 5.1x |
| 21 | Parker | 141 | 61,783 | $133,369 | $688,178 | 5.2x |
| 22 | Arvada | 139 | 122,634 | $117,348 | $616,566 | 5.3x |
| 23 | Littleton | 139 | 44,710 | $98,839 | $634,610 | 6.4x |
| 24 | Durango | 138 | 19,411 | $78,602 | $747,772 | 9.5x |
| 25 | Monument | 138 | 11,735 | $128,816 | $755,938 | 5.9x |
| 26 | Windsor | 137 | 37,914 | $127,028 | $577,243 | 4.5x |
| 27 | Lakewood | 136 | 156,583 | $89,792 | $573,913 | 6.4x |
| 28 | Wheat Ridge | 136 | 32,070 | $90,564 | $606,404 | 6.7x |
| 29 | Glenwood Springs | 136 | 10,241 | $91,481 | $869,621 | 9.5x |
| 30 | Fort Collins | 135 | 170,229 | $85,070 | $563,815 | 6.6x |
| 31 | Longmont | 135 | 99,406 | $90,671 | $556,720 | 6.1x |
| 32 | Frederick | 135 | 16,651 | $129,460 | $544,142 | 4.2x |
| 33 | Gypsum | 135 | 8,941 | $115,564 | $699,183 | 6.1x |
| 34 | Firestone | 133 | 18,049 | $120,150 | $570,742 | 4.8x |
| 35 | Wellington | 133 | 11,798 | $107,017 | $470,775 | 4.4x |
| 36 | Estes Park | 133 | 5,844 | $85,956 | $684,046 | 8.0x |
| 37 | Westminster | 132 | 115,484 | $100,272 | $527,654 | 5.3x |
| 38 | Berthoud | 132 | 12,411 | $119,385 | $606,280 | 5.1x |
| 39 | Severance | 132 | 10,130 | $124,572 | $495,599 | 4.0x |
| 40 | Englewood | 130 | 34,129 | $86,800 | $516,657 | 6.0x |
| 41 | Woodland Park | 129 | 7,949 | $99,238 | $534,082 | 5.4x |
| 42 | Thornton | 128 | 144,187 | $103,088 | $502,945 | 4.9x |
| 43 | Loveland | 128 | 78,410 | $84,604 | $500,792 | 5.9x |
| 44 | Aurora | 127 | 394,432 | $88,368 | $463,081 | 5.2x |
| 45 | Commerce City | 127 | 66,445 | $111,972 | $490,702 | 4.4x |
| 46 | Northglenn | 126 | 38,014 | $84,030 | $463,886 | 5.5x |
| 47 | Brighton | 125 | 42,059 | $107,679 | $498,701 | 4.6x |
| 48 | Salida | 125 | 5,861 | $70,045 | $700,439 | 10.0x |
| 49 | Dacono | 124 | 6,530 | $104,559 | $502,451 | 4.8x |
| 50 | Mead | 124 | 5,919 | $125,357 | $556,278 | 4.4x |
| 51 | Colorado Springs | 122 | 487,887 | $84,818 | $449,452 | 5.3x |
| 52 | Milliken | 120 | 8,871 | $107,500 | $450,807 | 4.2x |
| 53 | Eaton | 120 | 5,867 | $106,294 | $466,373 | 4.4x |
| 54 | Fountain | 118 | 29,300 | $86,242 | $394,609 | 4.6x |
| 55 | Fort Lupton | 118 | 8,897 | $80,889 | $464,448 | 5.7x |
| 56 | Greeley | 116 | 110,806 | $69,881 | $420,464 | 6.0x |
| 57 | Fruita | 116 | 13,691 | $87,184 | $480,864 | 5.5x |
| 58 | Rifle | 116 | 10,570 | $80,000 | $497,317 | 6.2x |
| 59 | Lochbuie | 115 | 8,609 | $97,009 | $464,474 | 4.8x |
| 60 | Sheridan | 115 | 6,005 | $60,608 | $436,932 | 7.2x |
| 61 | Grand Junction | 114 | 68,142 | $70,080 | $422,320 | 6.0x |
| 62 | Evans | 114 | 22,396 | $75,563 | $394,719 | 5.2x |
| 63 | Gunnison | 114 | 6,766 | $62,189 | $620,585 | 10.0x |
| 64 | Montrose | 113 | 21,044 | $70,386 | $467,131 | 6.6x |
| 65 | Fort Morgan | 106 | 11,605 | $64,158 | $328,288 | 5.1x |
| 66 | Brush | 106 | 5,306 | $73,382 | $298,242 | 4.1x |
| 67 | Craig | 105 | 8,991 | $72,636 | $304,797 | 4.2x |
| 68 | Delta | 104 | 9,421 | $45,250 | $368,018 | 8.1x |
| 69 | Sterling | 100 | 13,172 | $43,283 | $244,759 | 5.7x |
| 70 | Pueblo | 99 | 111,561 | $56,664 | $283,603 | 5.0x |
| 71 | Alamosa | 97 | 9,879 | $49,688 | $314,612 | 6.3x |
| 72 | Trinidad | 96 | 8,286 | $52,273 | $230,018 | 4.4x |
| 73 | Cortez | 95 | 8,976 | $54,247 | $339,964 | 6.3x |
| 74 | Federal Heights | 94 | 14,125 | $56,597 | $399,108 | 7.1x |
| 75 | Lamar | 93 | 7,611 | $53,188 | $180,906 | 3.4x |
| 76 | La Junta | 91 | 7,140 | $52,315 | $158,563 | 3.0x |
Source: U.S. Census ACS 2020-2024, Zillow research. 76 places with more than 5,000 residents.
Summary
Summary: Taking A Chunk Out Of Your Paycheck In Colorado For 2026
Well, there you have it, the places in Colorado that have the highest cost of living, with Cherry Hills Village ranking as the most expensive city in the Centennial State.
The most expensive cities in Colorado are Cherry Hills Village, Greenwood Village, Boulder, Lone Tree, Louisville, Castle Pines, Carbondale, Superior, Timnath, and Eagle. Not sold on Colorado? Take the two-minute Find Your Place quiz and see which state actually fits you.
Questions and answers
Most Expensive Places In Colorado FAQs
What is the most expensive place to live in Colorado?
Cherry Hills Village is the most expensive place to live in Colorado for 2026. The median home there runs $3,182,803, and it posts the highest cost of living of the 76 places we scored.
What are the 10 most expensive cities in Colorado?
The ten most expensive cities in Colorado are Cherry Hills Village, Greenwood Village, Boulder, Lone Tree, Louisville, Castle Pines, Carbondale, Superior, Timnath, and Eagle. We ranked all 76 places with more than 5,000 residents on home prices, incomes, and an overall cost of living index.
How expensive are homes in Cherry Hills Village?
The median home value in Cherry Hills Village is $3,182,803, versus $541,842 across Colorado as a whole. Across the ten most expensive cities, the median home runs $929,810.
What salary do you need to live in the most expensive parts of Colorado?
The median household income in the ten most expensive Colorado cities starts at $87,493, and in Cherry Hills Village it is $250,001. If your paycheck is closer to the statewide median of $95,470, these places will squeeze your budget.
What is the cheapest place to live in Colorado?
La Junta is the cheapest of the 76 Colorado places we ranked on cost of living. It sits at the very bottom of the same index that put Cherry Hills Village on top.


