Fresnovs.Bakersfield Which City Is Right for You in 2026?
A head-to-head guide to cost of living, jobs, transportation, weather, crime, and quality of life — so you can decide where to live, work, or visit.
Updated 2026-05-26 · By HomeSnacks Editorial
Fresno vs. Bakersfield at a glance
If you're weighing Fresno, CA against Bakersfield, CA, you're really weighing two different versions of American life. Fresno is a city in the San Joaquin Valley of California, United States. It is the county seat of Fresno County and the largest city in the greater Central Valley region, as well as the most populated city in Central California. Bakersfield is a city in and the county seat of Kern County, California, United States. The city covers about 151 sq mi (390 km2) near the southern end of the San Joaquin Valley, which is located in the Central Valley region.
Cost of living is roughly comparable — Fresno comes in at 122 on the overall index and Bakersfield at 124 (100 = national average). The housing market diverges more sharply: median home values are $391,328 in Fresno and $396,047 in Bakersfield, against median household incomes of $70,991 and $80,540.
FBI crime data adds another wrinkle. Bakersfield reports 3,024 total crimes per 100,000 residents annually versus 4,007 in Fresno. Fresno is the more racially diverse of the two on a Herfindahl index basis — Fresno skews 51% Hispanic while Bakersfield skews 55% Hispanic. On HomeSnacks' overall SnackAbility score, Bakersfield edges ahead at 6/10 versus 5/10 for Fresno.
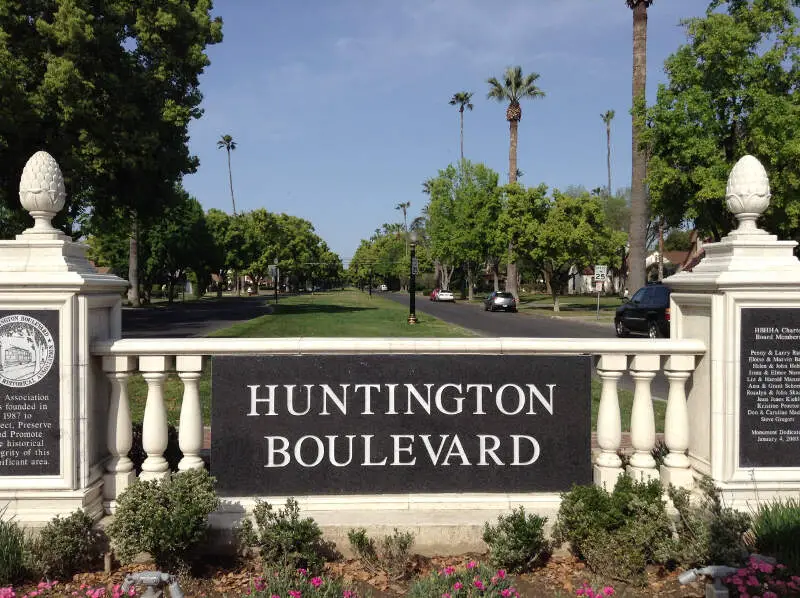
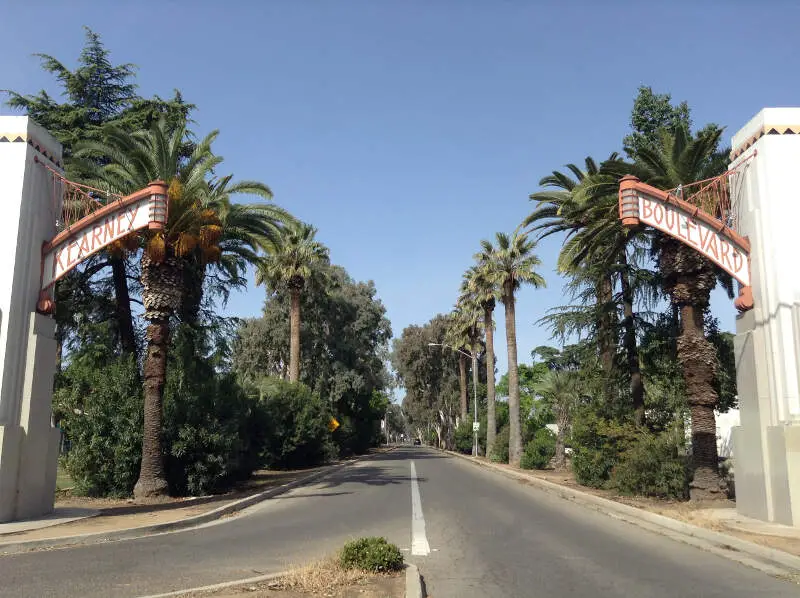
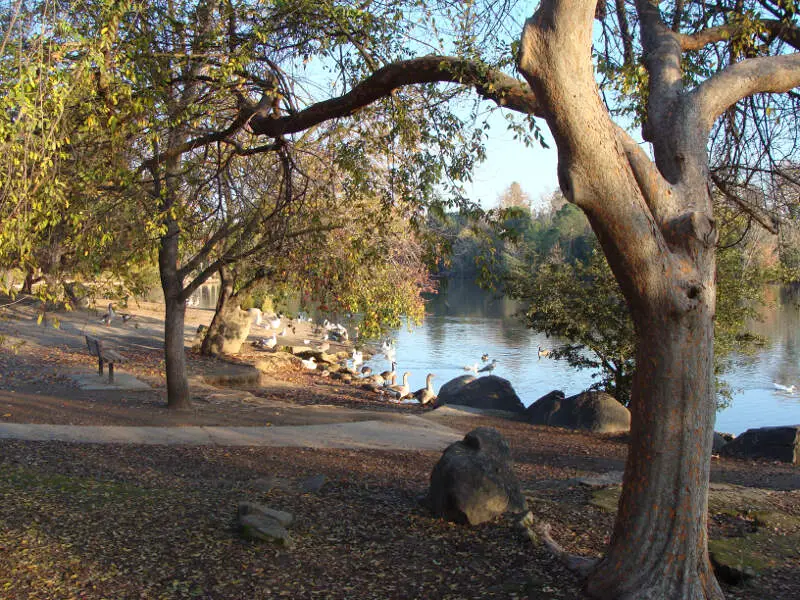
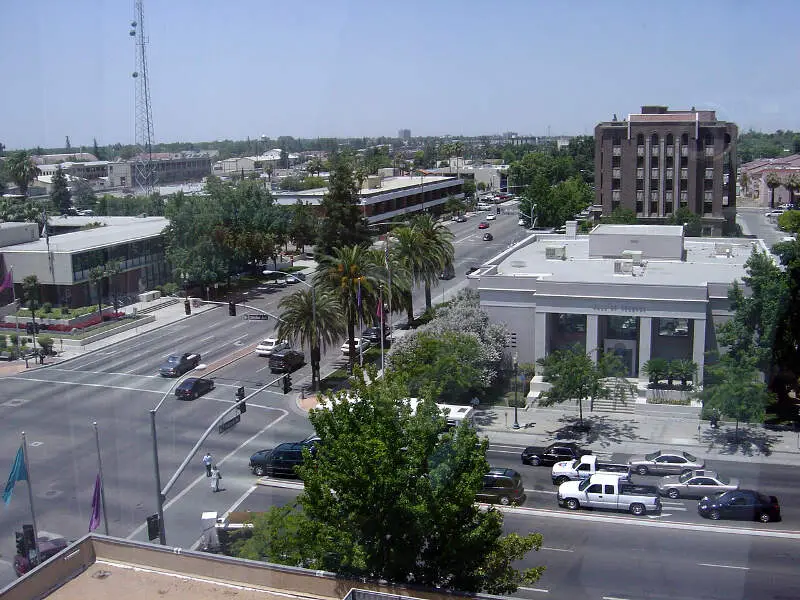
Fresno vs. Bakersfield in photos
A side-by-side look at each city.
Cost of living
Fresno is the cheaper city overall — 2% higher in Bakersfield than its rival. Index baseline: 100 = national average.
| Living expense | Fresno | Bakersfield | US average |
|---|---|---|---|
| Overall | 122 | 124 | 100 |
| Services | 115 | 113 | 100 |
| Groceries | 119 | 117 | 100 |
| Health | 130 | 137 | 100 |
| Housing | 119 | 121 | 100 |
| Transportation | 126 | 118 | 100 |
| Utilities | 119 | 122 | 100 |
Lower index = cheaper. 100 = U.S. national average. Bar inside each cell scales relative to the highest value in the table.
Sources: HomeSnacks Cost of Living indices, normalized so 100 = U.S. national average. Drill in: Fresno cost of living, Bakersfield cost of living, or the cheapest cities in America.
Housing breakdown
Home prices are higher in Bakersfield. Compare absolute price and price-to-income — a $500k home in a $100k-income city is very different from one in a $50k-income city.
| Metric | Fresno | Bakersfield | United States |
|---|---|---|---|
| Median Home Value | $391,328 | $396,047 | $332,700 |
| Median Rent | $1,421 | $1,472 | $1,413 |
| Median Income | $70,991 | $80,540 | $80,734 |
| Home Value To Income | 5.5x | 4.9x | 4.1x |
| Rent To Monthly Income | 0.24x | 0.22x | 0.21x |
Source: U.S. Census Bureau ACS 2020-2024. See also states with the highest rent in America.
Crime
Bakersfield is the safer city — total crime rate of 3,024 per 100k people vs 4,007 for Fresno. US average: 2,119.
| Crime (per 100k) | Fresno | Bakersfield | US average |
|---|---|---|---|
| Total crime | 4,007 | 3,024 | 2,119 |
| Murder | 6 | 7 | 5 |
| Robbery | 168 | 126 | 61 |
| Aggravated Assault | 517 | 381 | 256 |
| Violent Crime | 735 | 555 | 359 |
| Burglary | 396 | 538 | 229 |
| Larceny | 2,204 | 1,259 | 1,272 |
| Car Theft | 671 | 673 | 259 |
| Property Crime | 3,271 | 2,470 | 1,760 |
Lower = safer. Bar inside each cell scales relative to the highest crime rate in the table.
Source: FBI Uniform Crime Reporting (2024). All rates are per 100,000 people. City pages: Fresno crime, Bakersfield crime. See also: safest cities in America.
Diversity
Fresno is more racially diverse — lower HHI (closer to 0) means a more even mix across groups.
| Group | Fresno | Bakersfield | United States |
|---|---|---|---|
| White | 23.8% | 27.6% | 57.4% |
| African American | 6.5% | 5.7% | 11.9% |
| American Indian | 0.4% | 0.4% | 0.5% |
| Asian | 14.2% | 7.8% | 5.9% |
| Hawaiian | 0.2% | 0.1% | 0.2% |
| Other | 0.4% | 0.7% | 0.6% |
| Two Or More | 3.6% | 3.1% | 4.3% |
| Hispanic | 50.9% | 54.7% | 19.3% |
Source: U.S. Census ACS 2020-2024. Lower HHI = more even racial mix. See also: most diverse cities in America.
SnackAbility — overall quality of life
Bakersfield scores higher overall — 6/10 vs 5/10. SnackAbility is our 1–10 quality-of-life score; the median U.S. city scores a 7.
SnackAbility is a HomeSnacks proprietary 1–10 score blending jobs, housing, education, commute, amenities, affordability, crime, and diversity. Median U.S. city ≈ 7. Data: Census, BLS, FBI. See also: best places to live in America.
Getting around: Fresno vs. Bakersfield
How each city handles commuting, transit, walkability, and car culture — the day-to-day reality that shapes where you'd actually want to live.
Both Fresno and Bakersfield run along Highway 99, and both are fundamentally car cities. Expect sprawl, wide arterials, and commutes timed by traffic lights rather than transit schedules.
Fresno's public bus system is FAX (Fresno Area Express); Bakersfield runs Golden Empire Transit (GET). Neither will replace a car for most residents.
For regional rail, Fresno has a slight edge: Amtrak's San Joaquin line stops downtown, connecting you to Sacramento or Oakland. Bakersfield has its own San Joaquin stop on Truxtun Avenue, so that perk is roughly a wash.
Fresno Yosemite International (FAT) offers more nonstop routes than Bakersfield's Meadows Field (BFL), which is quite small. If you fly frequently, Fresno wins.
Both cities sit about 3 hours from Los Angeles via the 99 or I-5, though Bakersfield's position at the southern end of the Valley shaves a few miles off a southbound drive.
Jobs and careers in Fresno vs. Bakersfield
The local job market, dominant industries, and which city to choose based on your career.
Bakersfield's median household income is $80,540, compared to $70,991 in Fresno, despite having the smaller population (about 412,000 versus 546,000). The gap comes largely from oil. Kern County sits on some of California's most productive fields, and companies like Aera Energy and California Resources Corporation anchor a well-paying industrial base that Fresno doesn't have.
If you work in petroleum engineering, refining, or oilfield services, Bakersfield is your city.
Fresno's economy runs on healthcare (Community Medical Centers, Kaiser, Valley Children's Hospital), higher education (Fresno State, Fresno City College), and a large public-sector base of county government and schools. Agriculture drives both cities at the regional level. Fresno's greater size supports a more varied services sector, a broader tech-adjacent startup scene, and more corporate back-office work — and if you're in education, social services, or regional retail management, it offers more openings at that scale.
Weather and climate
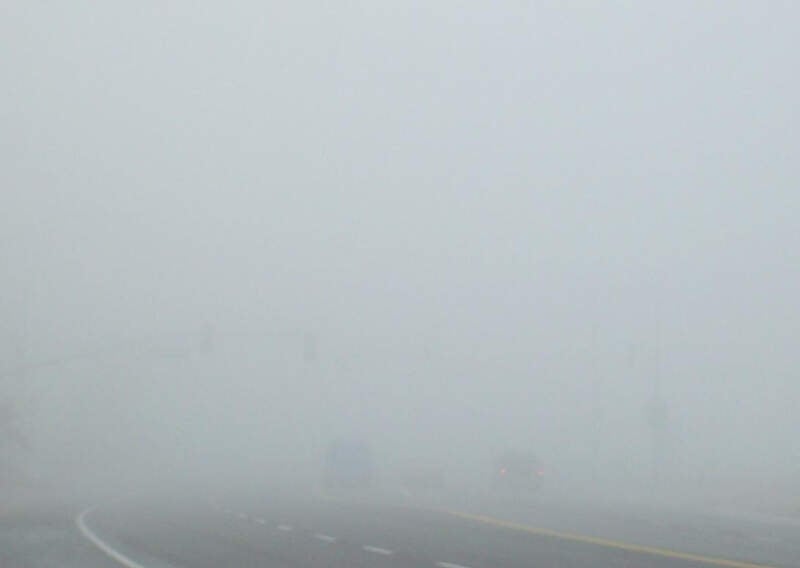
What to expect day-to-day — sun, fog, heat, rain, and the seasonal extremes that shape the lifestyle.
Fresno and Bakersfield share nearly identical climates. Summers are long and dry, with July and August regularly pushing above 100°F in both cities.
Winter brings the other Valley signature: tule fog. This dense ground fog can snarl Highway 99 for days and drop visibility to near zero. Neither city gets meaningful rain; both average under 12 inches annually, and snow is essentially nonexistent at valley floor elevation.
The differences are marginal. Bakersfield, positioned farther south at slightly lower elevation, runs a degree or two warmer on summer peaks and rarely dips below freezing in winter. Fresno's winters are marginally cooler.
Both cities carry a risk of Valley Fever (coccidioidomycosis), a fungal infection from disturbed soil worth knowing about if you're moving from outside California.
Whichever you choose, expect the same experience: hot, foggy, and dry. Plan your outdoor life around mornings and the October-through-April shoulder seasons.
Culture, nightlife, and entertainment
Food, music, neighborhoods, and the city vibe that gives each place its personality.
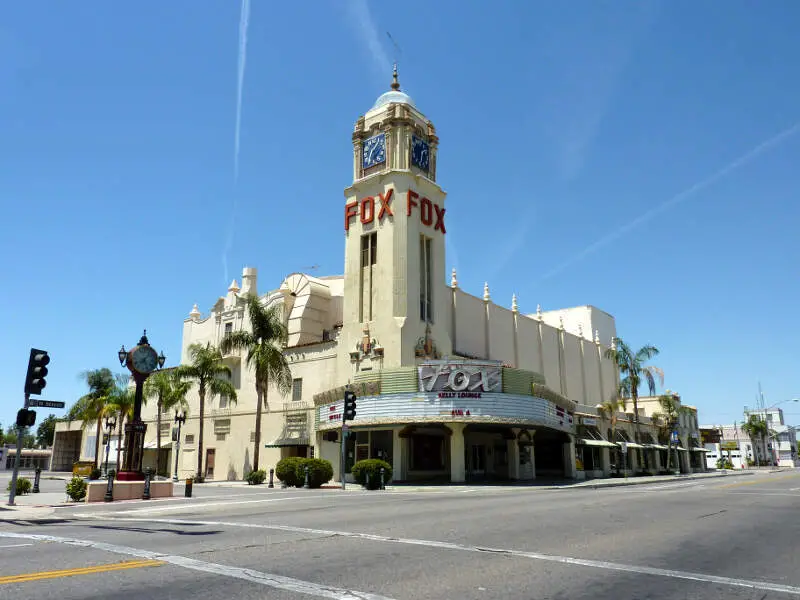
Fresno's larger population gives it a denser cultural calendar. The Tower District, a walkable strip of mid-century storefronts north of downtown, has independent bars, the Tower Theatre for live performances, and a concentration of restaurants that feel genuinely urban.
The Fresno Art Museum, a revitalized downtown core along Fulton Street, and the Fresno Grizzlies at Chukchansi Park round out a scene with more going on than a city this size usually gets credit for. Nightlife isn't San Francisco, but the options are real.
Bakersfield punches well above its weight in one specific lane: country music. The "Bakersfield Sound," the raw honky-tonk style developed by Buck Owens and Merle Haggard, is a genuine piece of American musical history. The Buck Owens Crystal Palace on Buck Owens Boulevard keeps that tradition alive with live performances and memorabilia.
Mechanics Bank Arena hosts larger touring acts. The food scene skews toward unpretentious Basque restaurants, a legacy of Basque sheepherders, and excellent taquerias.
If you want musical heritage and no-frills authenticity, Bakersfield delivers; for more variety across arts, dining, and nightlife, Fresno is the stronger pick.
Outdoor activities and day trips
Parks, beaches, hikes, and the weekend escapes that define life outside the city limits.
Fresno's location is hard to beat for outdoor access. Kings Canyon and Sequoia National Parks are about 60 miles away; Yosemite Valley is roughly 90. A Saturday drive gets you to giant sequoias, granite peaks above 14,000 feet, and world-class hiking trails.
Woodward Park along the San Joaquin River handles daily runs and accessible green space closer to home.
Bakersfield's outdoor picture is solid but more modest. Lake Isabella and the Kern River canyon, about 45 minutes northeast in the Sequoia National Forest, draw kayakers, rafters, and campers.
The Tehachapi Mountains to the southeast offer hiking and some of California's best wind-energy landscapes. Wind Wolves Preserve, a large Nature Conservancy property southwest of the city, is underrated for wildflower season.
If day trips to the Sierra Nevada are a deciding factor, Fresno is the stronger base. It's one of the best gateway cities to national park wilderness in the country.
Bottom line: which city is right for you?
Based on the head-to-head data above, here's the short version — pick the city that lines up with what you actually care about.
Choose Fresno if you prioritize…
- a lower cost of living (cheaper groceries, services, and day-to-day expenses).
- a more racially diverse community (lower HHI on Census data).
Choose Bakersfield if you prioritize…
- lower crime — a safer place to live, work, and raise a family.
- more affordable housing relative to Fresno.
- a higher overall SnackAbility quality-of-life score.
Methodology: winners are picked from public data — U.S. Census Bureau ACS (income, home value, rent, race/HHI), FBI Uniform Crime Reporting (crime rates per 100k), and HomeSnacks' proprietary SnackAbility quality-of-life score, which blends Bureau of Labor Statistics data with the above.
More about California

Best Places To Live In California
Photo: Public domain
Cheapest Places To Live In California
Photo: Public domain
Most Dangerous Cities In California
Photo: Public domain
Best Places To Raise A Family In California
Photo: Public domain
Best Places To Retire In California
Photo: Public domain
Richest Cities In California
Photo: Public domain
Safest Places In California
Photo: Public domain
Worst Places To Live In California
Photo: Public domain