Senoia, GA
Demographics And Statistics
Living In Senoia, Georgia Summary
Life in Senoia research summary. HomeSnacks has been using Saturday Night Science to research the quality of life in Senoia over the past nine years using Census, FBI, Zillow, and other primary data sources. Based on the most recently available data, we found the following about life in Senoia:
The population in Senoia is 5,353.
The median home value in Senoia is $517,331.
The median income in Senoia is $121,505.
The unemployment rate in Senoia is 2.3%.
The poverty rate in Senoia is 3.5%.
The average high in Senoia is 72.6° and the average low is 50.0°.
Table Of Contents
Senoia SnackAbility
Overall SnackAbility
Senoia, GA Weather
The average high in Senoia is 72.6° and the average low is 50.0°.
There are 75.4 days of precipitation each year.
Expect an average of 49.4 inches of precipitation each year with 1.1 inches of snow.
| Stat | Senoia |
|---|---|
| Average Annual High | 72.6 |
| Average Annual Low | 50.0 |
| Annual Precipitation Days | 75.4 |
| Average Annual Precipitation | 49.4 |
| Average Annual Snowfall | 1.1 |
Average High
Days of Rain
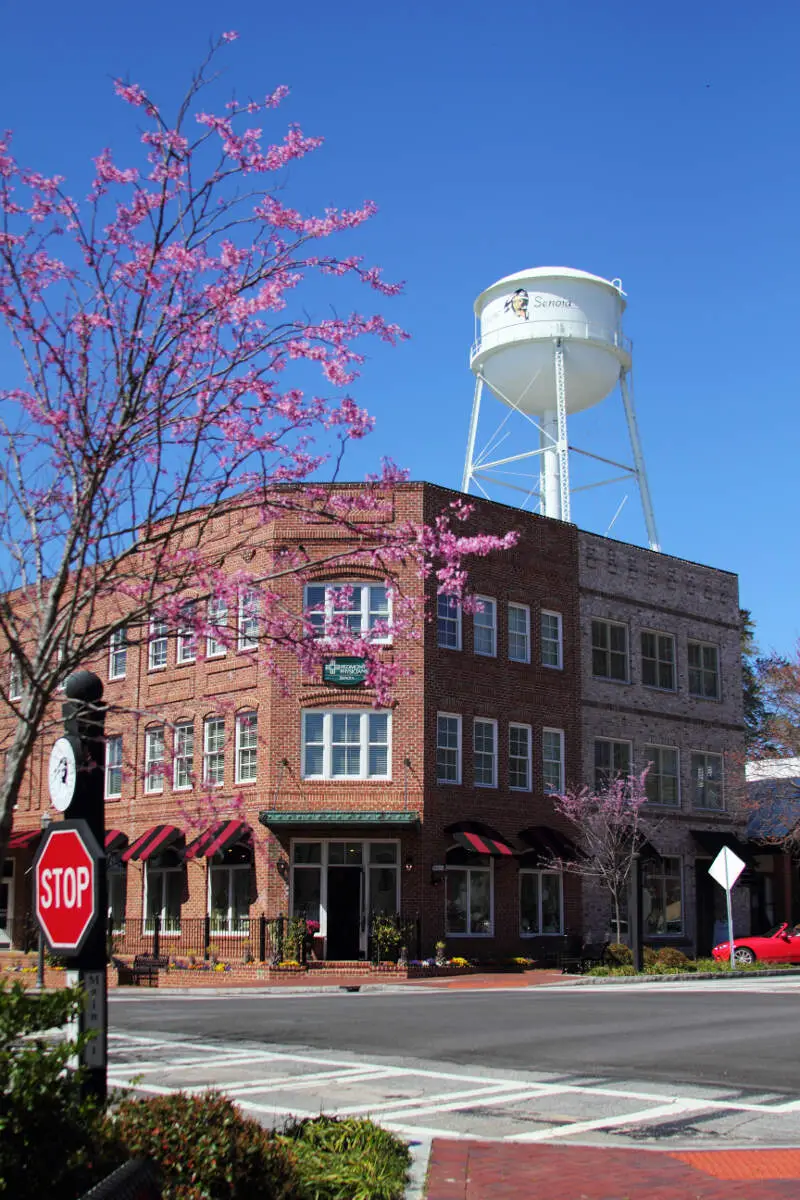
Senoia, GA Photos
Rankings for Senoia in Georgia


Locations Around Senoia
Map Of Senoia, GA
Best Places Around Senoia
Fayetteville, GA
Population 19,364
Tyrone, GA
Population 7,803
Hampton, GA
Population 8,491
Newnan, GA
Population 43,510
Irondale, GA
Population 8,722
Fairburn, GA
Population 16,609
Riverdale, GA
Population 14,866
Griffin, GA
Population 23,650
Lovejoy, GA
Population 10,967
Senoia Demographics And Statistics
Population over time in Senoia
The current population in Senoia is 5,353. The population has increased 74.8% from 2010.
| Year | Population | % Change |
|---|---|---|
| 2023 | 5,353 | 4.7% |
| 2022 | 5,115 | 5.2% |
| 2021 | 4,862 | 10.9% |
| 2020 | 4,386 | 3.1% |
| 2019 | 4,256 | 2.3% |
| 2018 | 4,160 | 3.3% |
| 2017 | 4,027 | 3.5% |
| 2016 | 3,889 | 3.1% |
| 2015 | 3,773 | 4.0% |
| 2014 | 3,627 | 4.3% |
| 2013 | 3,479 | 4.1% |
| 2012 | 3,343 | 5.3% |
| 2011 | 3,174 | 3.7% |
| 2010 | 3,062 | - |
Race / Ethnicity in Senoia
Senoia is:
72.5% White with 3,883 White residents.
16.8% African American with 898 African American residents.
0.0% American Indian with 0 American Indian residents.
1.0% Asian with 54 Asian residents.
0.0% Hawaiian with 0 Hawaiian residents.
0.0% Other with 0 Other residents.
5.2% Two Or More with 278 Two Or More residents.
4.5% Hispanic with 240 Hispanic residents.
| Race | Senoia | GA | USA |
|---|---|---|---|
| White | 72.5% | 49.8% | 58.2% |
| African American | 16.8% | 31.0% | 12.0% |
| American Indian | 0.0% | 0.1% | 0.5% |
| Asian | 1.0% | 4.3% | 5.7% |
| Hawaiian | 0.0% | 0.1% | 0.2% |
| Other | 0.0% | 0.5% | 0.5% |
| Two Or More | 5.2% | 3.5% | 3.9% |
| Hispanic | 4.5% | 10.7% | 19.0% |
Gender in Senoia
Senoia is 51.0% female with 2,731 female residents.
Senoia is 49.0% male with 2,622 male residents.
| Gender | Senoia | GA | USA |
|---|---|---|---|
| Female | 51.0% | 51.2% | 50.5% |
| Male | 49.0% | 48.8% | 49.5% |
Highest level of educational attainment in Senoia for adults over 25
1.0% of adults in Senoia completed < 9th grade.
1.0% of adults in Senoia completed 9-12th grade.
15.0% of adults in Senoia completed high school / ged.
27.0% of adults in Senoia completed some college.
7.0% of adults in Senoia completed associate's degree.
33.0% of adults in Senoia completed bachelor's degree.
12.0% of adults in Senoia completed master's degree.
3.0% of adults in Senoia completed professional degree.
1.0% of adults in Senoia completed doctorate degree.
| Education | Senoia | GA | USA |
|---|---|---|---|
| < 9th Grade | 1.0% | 3.0% | 5.0% |
| 9-12th Grade | 1.0% | 7.0% | 6.0% |
| High School / GED | 15.0% | 27.0% | 26.0% |
| Some College | 27.0% | 20.0% | 19.0% |
| Associate's Degree | 7.0% | 8.0% | 9.0% |
| Bachelor's Degree | 33.0% | 21.0% | 21.0% |
| Master's Degree | 12.0% | 10.0% | 10.0% |
| Professional Degree | 3.0% | 2.0% | 2.0% |
| Doctorate Degree | 1.0% | 2.0% | 2.0% |
Household Income For Senoia, Georgia
2.9% of households in Senoia earn Less than $10,000.
0.7% of households in Senoia earn $10,000 to $14,999.
1.7% of households in Senoia earn $15,000 to $24,999.
1.6% of households in Senoia earn $25,000 to $34,999.
6.7% of households in Senoia earn $35,000 to $49,999.
7.5% of households in Senoia earn $50,000 to $74,999.
11.3% of households in Senoia earn $75,000 to $99,999.
32.8% of households in Senoia earn $100,000 to $149,999.
16.8% of households in Senoia earn $150,000 to $199,999.
17.9% of households in Senoia earn $200,000 or more.
| Income | Senoia | GA | USA |
|---|---|---|---|
| Less than $10,000 | 2.9% | 5.3% | 4.9% |
| $10,000 to $14,999 | 0.7% | 3.6% | 3.6% |
| $15,000 to $24,999 | 1.7% | 7.0% | 6.6% |
| $25,000 to $34,999 | 1.6% | 7.2% | 6.8% |
| $35,000 to $49,999 | 6.7% | 11.0% | 10.4% |
| $50,000 to $74,999 | 7.5% | 16.2% | 15.7% |
| $75,000 to $99,999 | 11.3% | 13.1% | 12.7% |
| $100,000 to $149,999 | 32.8% | 17.0% | 17.4% |
| $150,000 to $199,999 | 16.8% | 8.7% | 9.3% |
| $200,000 or more | 17.9% | 11.0% | 12.6% |


