Welcome to the happiest places in New Jersey.
Using Saturday Night Science and data, we determined the cities and towns with the most rainbows, butterflies, puppies, and unicorns.
You know, the places where people have jobs, white-picked fences, and friendly neighbors – unicorn cities.
After analyzing the 266 largest cities, we happily present the happiest cities in the Garden State.
Table Of Contents: Top Ten | Methodology | Summary | Table
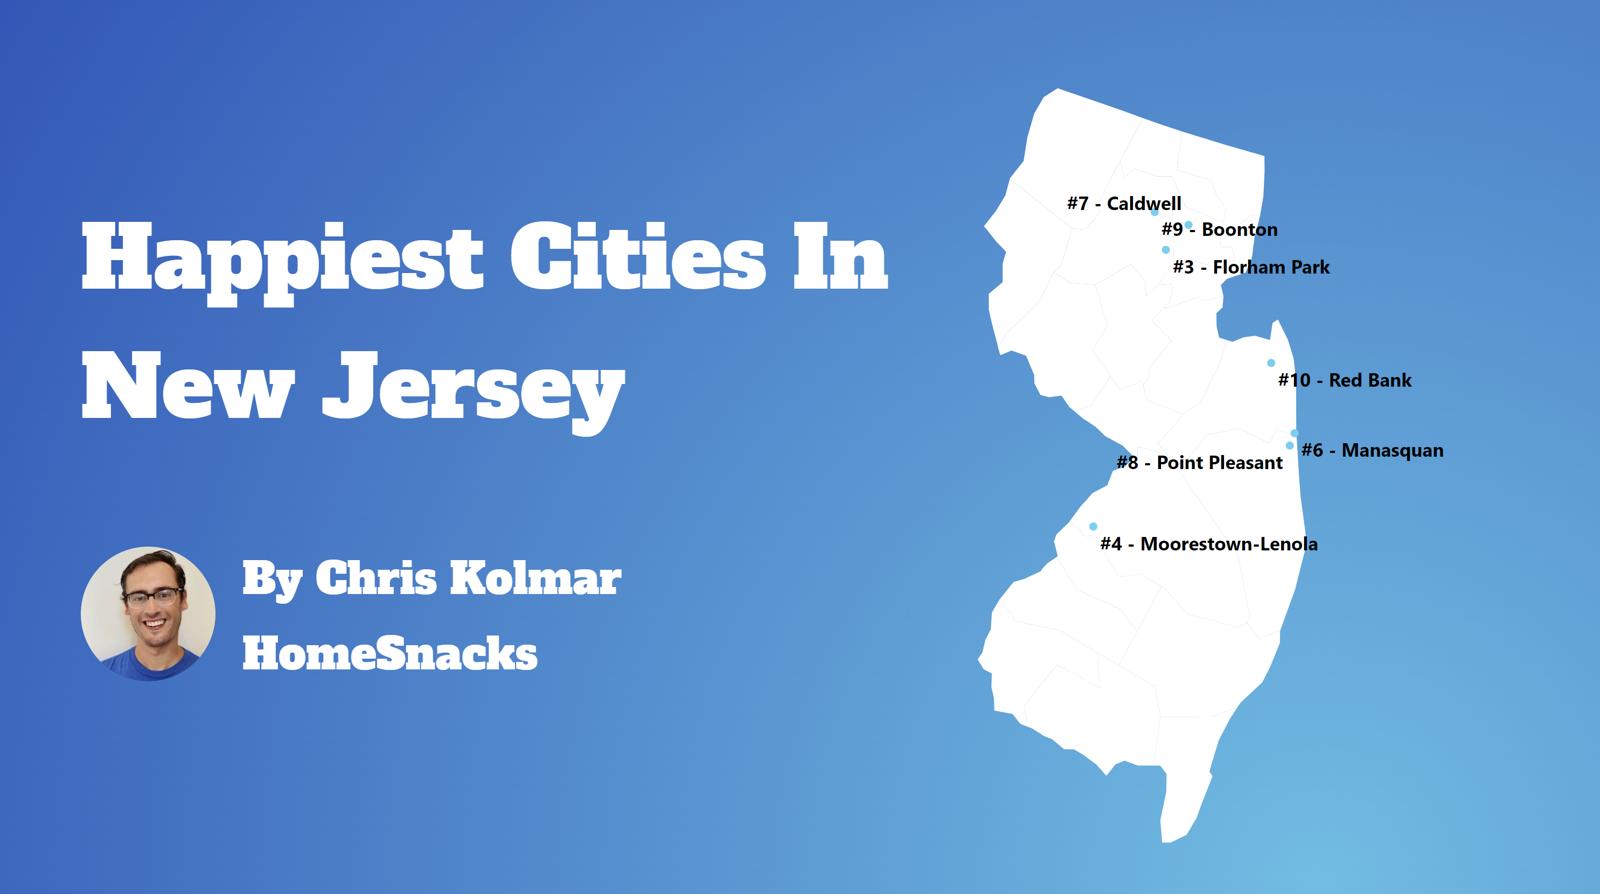
The 10 Happiest Places In New Jersey
- Ocean City
- Florham Park
- Raritan
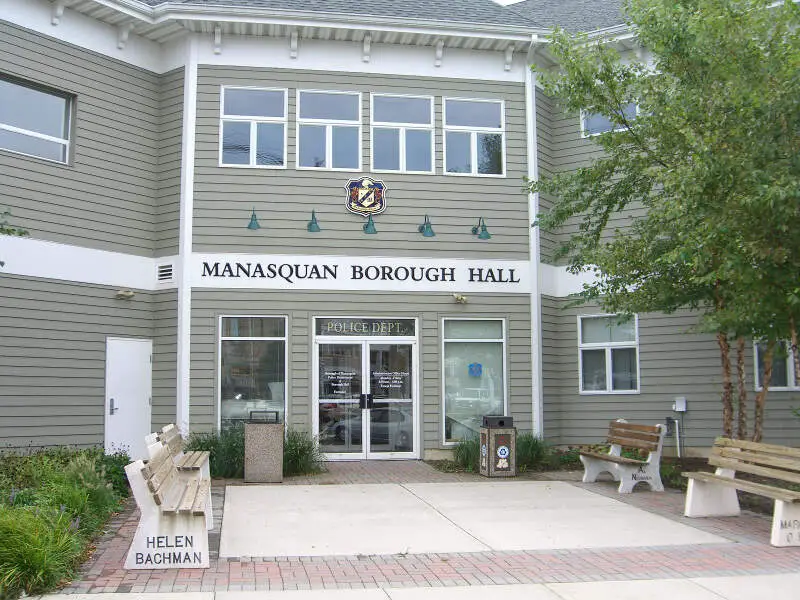
- Manasquan
- Point Pleasant
- Margate City
- Beach Haven West
- Franklin Center
- Bloomingdale
- Caldwell
Read on below to see how we crunched the numbers and how your town ranked. If you have a smile on your face, you probably live in one of these cities.
Oh, and by the way, Fort Dix is the most miserable place in New Jersey.
For more New Jersey reading, check out:
The 10 Happiest Places In New Jersey For 2026
/10
Population: 11,261
Poverty Level: 9.8%
Median Home Price $1,099,876
Married Households 17.0%
Households With Kids 16.56%
More on Ocean City: Data | Crime | Cost Of Living | Movers
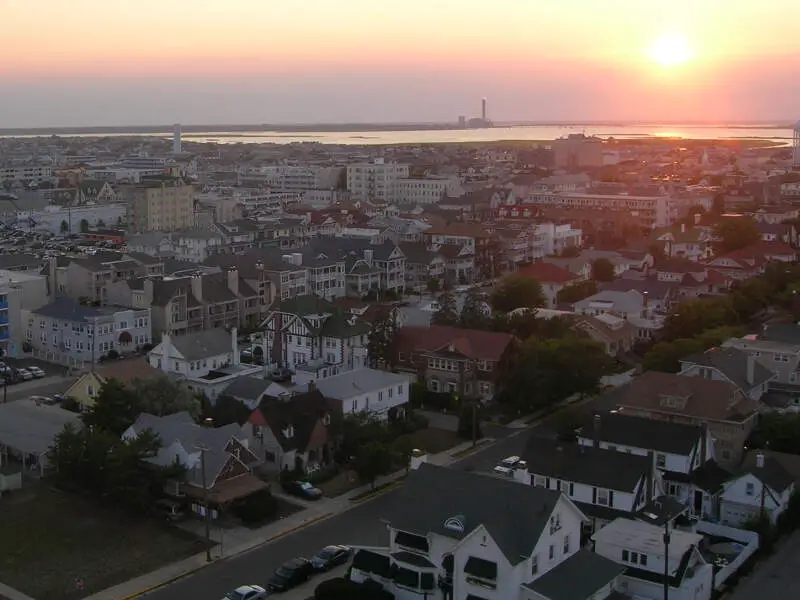
Ocean City is by far the happiest place in the state of New Jersey. Let’s see why.
First off, having a solid family life is a good indication of how happy someone is. Lots of the residents of Ocean City aren’t missing out on love; more than 17% of them are married. Plus, the average commute time here is only about 27 minutes each way. That means a lot more time with the spouse and kids.

/10
Population: 13,564
Poverty Level: 8.7%
Median Home Price $1,025,255
Married Households 24.0%
Households With Kids 27.29%
More on Florham Park: Data | Crime | Cost Of Living | Movers
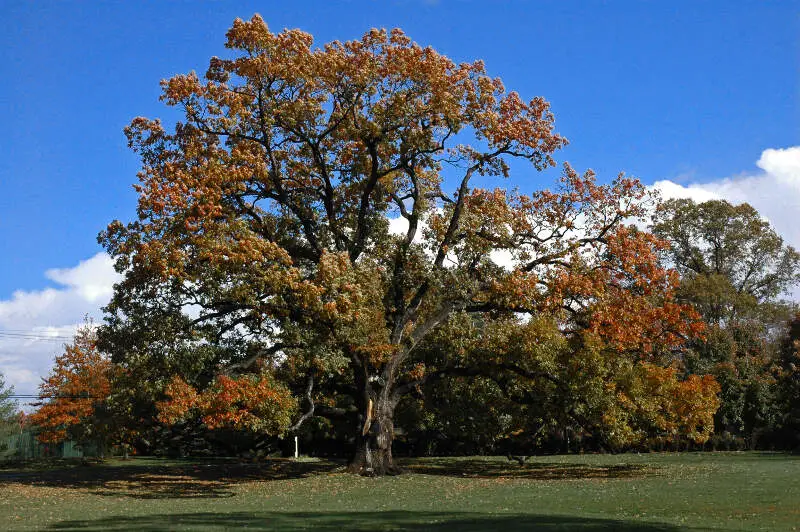
Things look to be pretty pleasant in Florham Park. Crime is really low here, and the percentage of married residents (24%) mean there’s lots of stability at home.
In addition to those factors, there is a thriving amount of community involvement. Studies have shown that a key factor to happiness is when people volunteer, especially in their own neighborhoods.

/10
Population: 8,368
Poverty Level: 8.0%
Median Home Price $545,696
Married Households 24.0%
Households With Kids 20.6%
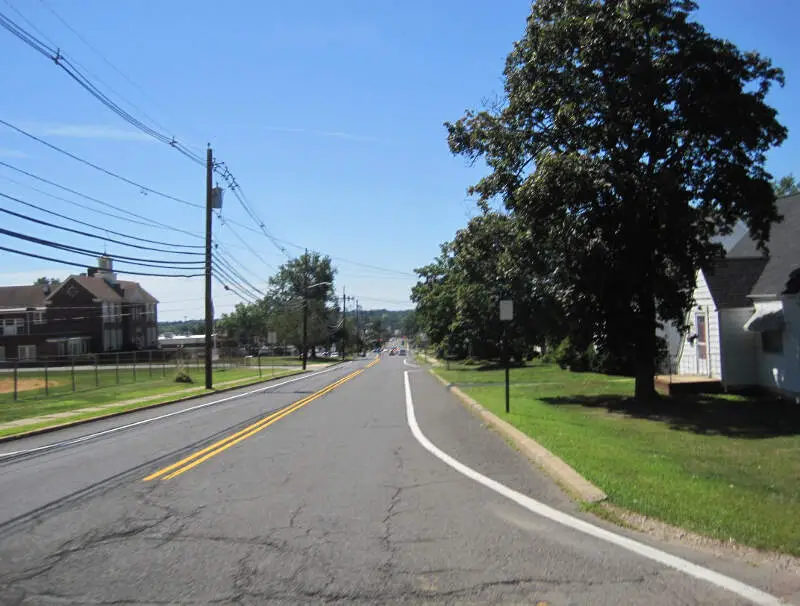
More on Raritan: Data | Crime | Cost Of Living | Movers
The people who live in Raritan have a lot going for them. 44% of them have college degrees, and they command some of the highest salaries in NJ. 24% of the people here are married.
Most of these all tops in the entire state.

/10
Population: 5,922
Poverty Level: 3.0%
Median Home Price $1,158,873
Married Households 37.0%
Households With Kids 23.97%
More on Manasquan: Data | Crime | Cost Of Living | Movers
Manasquan is where you can bet there are lots of smiley and happy people all over town. Crime is essentially something that just doesn’t happen here very often. And when you can let your guard down and relax a little, the lack of stress really makes a difference.
Same goes on the job front. Only 2.7% of residents here are out of work. Sounds like there are jobs for just about everyone who wants one. Which must be a good feeling to have.

/10
Population: 19,334
Poverty Level: 4.5%
Median Home Price $733,629
Married Households 38.0%
Households With Kids 28.96%
More on Point Pleasant: Data | Crime | Cost Of Living | Movers
If you want to see a bunch of happy people, go to Point Pleasant. It seriously looks like something out of a commercial.
They have a 29 minute commute time, which means lots more time with the kids.
/10
Population: 5,234
Poverty Level: 6.3%
Median Home Price $1,097,066
Married Households 14.0%
Households With Kids 14.86%
More on Margate City: Data | Crime | Cost Of Living | Movers
For those who say that money doesn’t buy happiness, you’re half right. Studies have shown that people are happy up to a certain point when it comes to annual salaries, somewhere around $72,000 a year. After that, it doesn’t matter how much you make, you’re not going to be much happier.
The residents of Margate City have that covered. Plus about 14% of households are married.
7. Beach Haven West
/10
Population: 5,120
Poverty Level: 3.4%
Median Home Price $804,117
Married Households 29.0%
Households With Kids 11.55%
More on Beach Haven West: Movers
Most of the people in Beach Haven West have to be âplum’ happy. True happiness is âHome Sweet Home’ with your kids and spouse, being reminded to do chores, run errands and fold the clothes right.
/10
Population: 6,646
Poverty Level: 7.3%
Median Home Price $766,900
Married Households 16.0%
Households With Kids 20.72%
More on Franklin Center: Data | Cost Of Living | Movers
Less than 4.6% of the residents in Franklin Center are jobless, which is just about as low as you’ll see.
Incomes are steady, and commute times are really low as well. That really takes away the stress factors that stop folks from relaxing and enjoying their âdown time’ to do the little things that matter: Walks in the park, time alone with a book and extra face time with the children.

/10
Population: 7,716
Poverty Level: 11.9%
Median Home Price $547,973
Married Households 25.0%
Households With Kids 22.77%
More on Bloomingdale: Data | Crime | Cost Of Living | Movers
About 38% of residents in Bloomingdale, NJ have a college degree. While we’ve all heard the saying, âIgnorance is bliss,’ our argument is: Ignorance is also broke.
Not only are most of the residents of Bloomingdale smart, they’re safe, too.

/10
Population: 9,003
Poverty Level: 8.0%
Median Home Price $724,634
Married Households 21.0%
Households With Kids 26.06%
More on Caldwell: Data | Crime | Cost Of Living | Movers
In Caldwell, most of the population is married, and most own their own homes.
The commute times (29 minutes each way) might eventually start to turn the corners of those smiles sideways.
But for now, it’s all roses in Caldwell.
Methodology: How We Measured The Happiest Cities In The Garden State
To rank the happiest places in New Jersey, we had to determine what criteria make people happy. It isn’t a stretch to assume that happy people earn great salaries, are relatively stress-free, and have a stable home life.
So we went to the Census’s American Community Survey 2020-2024 report for the happy criteria, added some Saturday Night Science, and generated the answer.
Here are the criteria we used to measure happiness:
- Percentage of residents with a college degree
- Average commute times
- Unemployment rates
- Cost of living
- % of married couples
- % of families with kids
- Poverty rate
After we decided on the criteria, we gathered the data for the 266 places in New Jersey with over 5,000 people.
We then ranked each place from one to 266 for each of the seven criteria, with a score of one being the happiest.
Next, we averaged the seven rankings into a Happy Index for each place with the lowest overall Happy Index “earning” the title “Happiest City In New Jersey.”
If you’d like to see the complete list of cities, happiest to saddest, scroll to the bottom of this post to see the unabridged chart.
We updated this article for 2026, and it’s our eleventh time ranking the happiest cities in New Jersey.
There You Have It – The Happiest Cities In New Jersey
As we said earlier, trying to determine the most miserable cities in New Jersey is usually a subjective matter.
But if you’re analyzing cities where people are not stable, where you’re stuck in traffic, and no one spent the time to go to college, then this is an accurate list.
The happiest cities in New Jersey are Ocean City, Florham Park, Raritan, Manasquan, Point Pleasant, Margate City, Beach Haven West, Franklin Center, Bloomingdale, and Caldwell.
If you’re curious enough, here are the most miserable cities in New Jersey, according to science:
- Fort Dix
- East Franklin
- Newark
For more New Jersey reading, check out:
- Best Places To Live In New Jersey
- Cheapest Places To Live In New Jersey
- Most Dangerous Cities In New Jersey
- Richest Cities In New Jersey
- Safest Places In New Jersey
- Worst Places To Live In New Jersey
- Most Expensive Places To Live In New Jersey
Happiest Cities In New Jersey For 2026
| Rank | City | Population | Poverty Level | Median Home Value | % Married | % Kids |
|---|---|---|---|---|---|---|
| 1 | Ocean City, NJ | 11,261 | 9.8% | $1,099,876 | 17.0% | 16.56% |
| 2 | Florham Park, NJ | 13,564 | 8.7% | $1,025,255 | 24.0% | 27.29% |
| 3 | Raritan, NJ | 8,368 | 8.0% | $545,696 | 24.0% | 20.6% |
| 4 | Manasquan, NJ | 5,922 | 3.0% | $1,158,873 | 37.0% | 23.97% |
| 5 | Point Pleasant, NJ | 19,334 | 4.5% | $733,629 | 38.0% | 28.96% |
| 6 | Margate City, NJ | 5,234 | 6.3% | $1,097,066 | 14.0% | 14.86% |
| 7 | Beach Haven West, NJ | 5,120 | 3.4% | $804,117 | 29.0% | 11.55% |
| 8 | Franklin Center, NJ | 6,646 | 7.3% | $766,900 | 16.0% | 20.72% |
| 9 | Bloomingdale, NJ | 7,716 | 11.9% | $547,973 | 25.0% | 22.77% |
| 10 | Caldwell, NJ | 9,003 | 8.0% | $724,634 | 21.0% | 26.06% |
| 11 | Asbury Park, NJ | 15,295 | 21.9% | $686,057 | 13.0% | 19.03% |
| 12 | Morris Plains, NJ | 6,315 | 3.2% | $727,185 | 30.0% | 28.6% |
| 13 | Boonton, NJ | 8,854 | 8.1% | $667,779 | 29.0% | 30.59% |
| 14 | Morristown, NJ | 20,453 | 7.8% | $887,261 | 11.0% | 24.66% |
| 15 | Westwood, NJ | 11,283 | 7.1% | $755,182 | 21.0% | 33.09% |
| 16 | Middlesex, NJ | 14,645 | 11.3% | $536,277 | 27.0% | 30.54% |
| 17 | Brigantine, NJ | 7,674 | 9.4% | $697,787 | 18.0% | 9.37% |
| 18 | Pompton Lakes, NJ | 11,047 | 8.4% | $548,025 | 31.0% | 31.05% |
| 19 | Belmar, NJ | 5,869 | 7.7% | $1,009,846 | 23.0% | 13.45% |
| 20 | Park Ridge, NJ | 9,406 | 1.5% | $845,037 | 24.0% | 30.89% |
| 21 | Tinton Falls, NJ | 19,361 | 6.7% | $624,718 | 29.0% | 22.85% |
| 22 | Red Bank, NJ | 12,862 | 8.7% | $693,364 | 17.0% | 20.89% |
| 23 | Somerville, NJ | 13,410 | 5.9% | $542,519 | 21.0% | 25.72% |
| 24 | Barrington, NJ | 7,076 | 7.4% | $364,663 | 28.0% | 18.93% |
| 25 | Hillsdale, NJ | 10,144 | 2.2% | $843,787 | 28.0% | 35.42% |
| 26 | Hoboken, NJ | 58,668 | 7.8% | $855,399 | 10.0% | 18.41% |
| 27 | Carlstadt, NJ | 6,378 | 9.0% | $656,613 | 27.0% | 18.87% |
| 28 | Hamilton Square, NJ | 11,622 | 2.2% | $497,482 | 38.0% | 26.87% |
| 29 | Haddon Heights, NJ | 7,516 | 2.5% | $493,148 | 29.0% | 26.56% |
| 30 | Bernardsville, NJ | 7,916 | 1.1% | $1,003,866 | 33.0% | 36.52% |
| 31 | Northfield, NJ | 8,456 | 4.6% | $388,519 | 28.0% | 29.57% |
| 32 | Midland Park, NJ | 7,019 | 2.8% | $732,464 | 34.0% | 24.41% |
| 33 | Butler, NJ | 8,133 | 8.7% | $549,895 | 26.0% | 27.54% |
| 34 | Waldwick, NJ | 10,164 | 1.4% | $738,299 | 29.0% | 37.93% |
| 35 | Totowa, NJ | 10,959 | 4.1% | $659,952 | 28.0% | 35.04% |
| 36 | Little Silver, NJ | 6,105 | 1.2% | $1,110,499 | 38.0% | 33.63% |
| 37 | Cape May Court House, NJ | 5,628 | 17.0% | $446,405 | 28.0% | 23.19% |
| 38 | Highland Park, NJ | 15,121 | 7.5% | $585,368 | 9.0% | 23.01% |
| 39 | Roseland, NJ | 6,268 | 2.5% | $819,879 | 29.0% | 28.93% |
| 40 | Hawthorne, NJ | 19,628 | 4.0% | $629,473 | 26.0% | 30.31% |
| 41 | Manville, NJ | 10,921 | 11.7% | $476,360 | 20.0% | 24.55% |
| 42 | Rockaway, NJ | 6,613 | 6.2% | $561,516 | 34.0% | 28.22% |
| 43 | Wildwood, NJ | 5,130 | 13.7% | $630,656 | 20.0% | 21.05% |
| 44 | Collingswood, NJ | 14,205 | 9.5% | $448,585 | 18.0% | 23.98% |
| 45 | Golden Triangle, NJ | 5,765 | 8.0% | $401,494 | 12.0% | 21.28% |
| 46 | Moorestown-Lenola, NJ | 14,625 | 7.1% | $728,931 | 24.0% | 35.0% |
| 47 | Mountainside, NJ | 7,049 | 3.7% | $1,043,568 | 32.0% | 38.28% |
| 48 | North Caldwell, NJ | 6,656 | 1.7% | $1,133,695 | 36.0% | 37.06% |
| 49 | Franklin Lakes, NJ | 11,084 | 3.4% | $1,557,852 | 25.0% | 41.2% |
| 50 | Smithville, NJ | 9,545 | 9.8% | $349,867 | 16.0% | 16.39% |
| 51 | West Long Branch, NJ | 8,586 | 3.4% | $959,619 | 26.0% | 29.64% |
| 52 | Mercerville, NJ | 13,535 | 3.2% | $449,363 | 37.0% | 30.99% |
| 53 | Ramsey, NJ | 14,805 | 4.3% | $863,403 | 19.0% | 35.47% |
| 54 | Mount Arlington, NJ | 5,935 | 4.9% | $529,938 | 24.0% | 17.65% |
| 55 | Eato, NJ | 13,575 | 4.4% | $617,029 | 21.0% | 23.68% |
| 56 | Haddonfield, NJ | 12,595 | 3.1% | $830,376 | 24.0% | 50.05% |
| 57 | Martinsville, NJ | 11,559 | 1.4% | $902,737 | 31.0% | 37.15% |
| 58 | Wanaque, NJ | 11,206 | 5.9% | $507,937 | 21.0% | 21.68% |
| 59 | Green Knoll, NJ | 6,789 | 3.3% | $748,229 | 23.0% | 35.47% |
| 60 | Audubon, NJ | 8,730 | 2.9% | $376,496 | 28.0% | 27.82% |
| 61 | Palisades Park, NJ | 20,290 | 9.4% | $987,742 | 4.0% | 23.97% |
| 62 | Long Branch, NJ | 32,530 | 15.5% | $795,839 | 15.0% | 25.67% |
| 63 | East Rutherford, NJ | 10,313 | 7.4% | $635,545 | 17.0% | 31.33% |
| 64 | Oradell, NJ | 8,235 | 3.6% | $975,411 | 22.0% | 44.81% |
| 65 | Oakland, NJ | 12,768 | 3.1% | $750,020 | 31.0% | 36.83% |
| 66 | Echelon, NJ | 13,284 | 10.6% | $411,770 | 13.0% | 27.32% |
| 67 | Ringwood, NJ | 11,657 | 2.5% | $596,571 | 32.0% | 26.59% |
| 68 | White Horse, NJ | 10,507 | 2.6% | $386,207 | 31.0% | 25.93% |
| 69 | Ashland, NJ | 9,320 | 6.4% | $421,294 | 24.0% | 26.69% |
| 70 | Wood-Ridge, NJ | 10,218 | 6.9% | $709,508 | 21.0% | 30.64% |
| 71 | Marlton, NJ | 10,922 | 3.7% | $427,434 | 18.0% | 22.1% |
| 72 | Emerson, NJ | 7,305 | 3.1% | $780,189 | 29.0% | 32.66% |
| 73 | Oceanport, NJ | 6,195 | 4.1% | $910,435 | 37.0% | 30.29% |
| 74 | North Haledon, NJ | 8,778 | 3.3% | $712,134 | 30.0% | 31.94% |
| 75 | Beckett, NJ | 5,017 | 8.7% | $392,723 | 19.0% | 31.4% |
| 76 | Rumson, NJ | 7,241 | 3.2% | $2,183,827 | 27.0% | 38.43% |
| 77 | Succasunna, NJ | 9,799 | 2.2% | $650,100 | 32.0% | 33.54% |
| 78 | Dumont, NJ | 18,279 | 6.6% | $666,364 | 18.0% | 30.95% |
| 79 | Ventnor City, NJ | 9,265 | 10.1% | $633,017 | 13.0% | 15.29% |
| 80 | Hight, NJ | 5,920 | 2.1% | $429,313 | 25.0% | 26.23% |
| 81 | Woodland Park, NJ | 13,355 | 3.8% | $648,175 | 17.0% | 29.36% |
| 82 | Ridgewood, NJ | 26,308 | 4.2% | $1,200,488 | 18.0% | 43.65% |
| 83 | Madison, NJ | 16,447 | 3.2% | $990,722 | 18.0% | 36.11% |
| 84 | Millville, NJ | 27,511 | 12.5% | $252,660 | 28.0% | 24.85% |
| 85 | Mystic Island, NJ | 8,259 | 16.1% | $402,873 | 27.0% | 21.24% |
| 86 | Fanwood, NJ | 7,799 | 1.0% | $791,728 | 23.0% | 32.52% |
| 87 | Morganville, NJ | 5,902 | 3.5% | $851,869 | 12.0% | 30.09% |
| 88 | Beachwood, NJ | 11,088 | 4.5% | $462,368 | 32.0% | 28.8% |
| 89 | Matawan, NJ | 9,710 | 10.5% | $645,511 | 21.0% | 31.91% |
| 90 | Colonia, NJ | 18,587 | 7.4% | $635,209 | 25.0% | 32.51% |
| 91 | Roselle Park, NJ | 14,093 | 6.6% | $538,084 | 16.0% | 28.75% |
| 92 | Rutherford, NJ | 18,894 | 5.5% | $738,683 | 20.0% | 34.66% |
| 93 | Newton, NJ | 8,369 | 15.1% | $437,913 | 27.0% | 27.96% |
| 94 | Toms River, NJ | 94,956 | 5.8% | $456,691 | 27.0% | 29.09% |
| 95 | West Freehold, NJ | 14,883 | 4.0% | $662,892 | 20.0% | 34.21% |
| 96 | New Providence, NJ | 13,727 | 2.1% | $990,084 | 20.0% | 37.71% |
| 97 | Norwood, NJ | 5,724 | 2.8% | $898,893 | 14.0% | 36.93% |
| 98 | Bellmawr, NJ | 11,737 | 9.6% | $310,585 | 21.0% | 29.39% |
| 99 | Clementon, NJ | 5,410 | 10.8% | $309,206 | 27.0% | 25.96% |
| 100 | Absecon, NJ | 9,170 | 7.9% | $343,433 | 26.0% | 31.99% |


