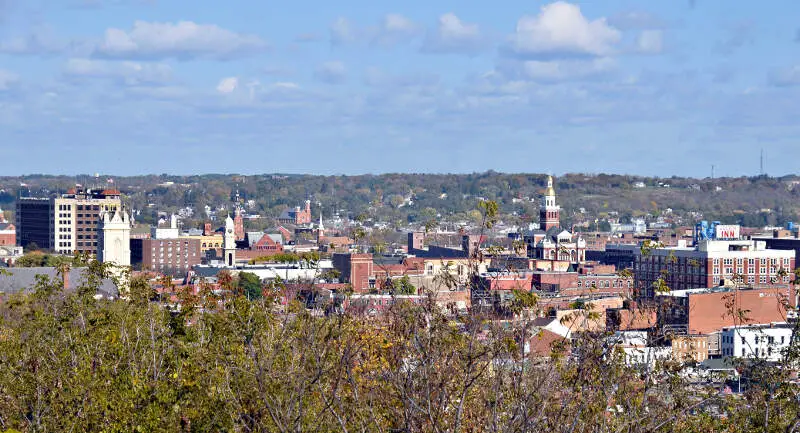
Dubuque, IA
Demographics And Statistics
Living In Dubuque, Iowa Summary
Life in Dubuque research summary. HomeSnacks has been using Saturday Night Science to research the quality of life in Dubuque over the past nine years using Census, FBI, Zillow, and other primary data sources. Based on the most recently available data, we found the following about life in Dubuque:
The population in Dubuque is 59,271.
The median home value in Dubuque is $243,017.
The median income in Dubuque is $64,985.
The cost of living in Dubuque is 92 which is 0.9x lower than the national average.
The median rent in Dubuque is $943.
The unemployment rate in Dubuque is 4.4%.
The poverty rate in Dubuque is 12.2%.
The average high in Dubuque is 57.7° and the average low is 38.1°.
Dubuque SnackAbility
Overall SnackAbility
Dubuque, IA Crime Report
Crime in Dubuque summary. We use data from the FBI to determine the crime rates in Dubuque. Key points include:
There were 1,076 total crimes in Dubuque in the last reporting year.
The overall crime rate per 100,000 people in Dubuque is 1,835.6 / 100k people.
The violent crime rate per 100,000 people in Dubuque is 400.9 / 100k people.
The property crime rate per 100,000 people in Dubuque is 1,434.7 / 100k people.
Overall, crime in Dubuque is -13.39% below the national average.
Total Crimes
Below National Average
Crime In Dubuque Comparison Table
| Statistic | Count Raw |
Dubuque / 100k People |
Iowa / 100k People |
National / 100k People |
|---|---|---|---|---|
| Total Crimes Per 100K | 1,076 | 1,835.6 | 1,540.0 | 2,119.2 |
| Violent Crime | 235 | 400.9 | 243.3 | 359.0 |
| Murder | 1 | 1.7 | 2.1 | 5.0 |
| Robbery | 14 | 23.9 | 18.7 | 61.0 |
| Aggravated Assault | 173 | 295.1 | 187.2 | 256.0 |
| Property Crime | 841 | 1,434.7 | 1,296.8 | 1,760.0 |
| Burglary | 134 | 228.6 | 199.1 | 229.0 |
| Larceny | 652 | 1,112.2 | 962.6 | 1,272.0 |
| Car Theft | 55 | 93.8 | 135.1 | 259.0 |
Dubuque, IA Cost Of Living
Cost of living in Dubuque summary. We use data on the cost of living to determine how expensive it is to live in Dubuque. Real estate prices drive most of the variance in cost of living around Iowa. Key points include:
The cost of living in Dubuque is 92 with 100 being average.
The cost of living in Dubuque is 0.9x lower than the national average.
The median home value in Dubuque is $243,017.
The median income in Dubuque is $64,985.
Dubuque's Overall Cost Of Living
Lower Than The National Average
Cost Of Living In Dubuque Comparison Table
| Living Expense | Dubuque | Iowa | National Average | |
|---|---|---|---|---|
| Overall | 92 | 90 | 100 | |
| Services | 98 | 96 | 100 | |
| Groceries | 99 | 97 | 100 | |
| Health | 89 | 99 | 100 | |
| Housing | 82 | 75 | 100 | |
| Transportation | 105 | 99 | 100 | |
| Utilities | 96 | 94 | 100 | |
Dubuque, IA Weather
The average high in Dubuque is 57.7° and the average low is 38.1°.
There are 69.8 days of precipitation each year.
Expect an average of 36.2 inches of precipitation each year with 37.5 inches of snow.
| Stat | Dubuque |
|---|---|
| Average Annual High | 57.7 |
| Average Annual Low | 38.1 |
| Annual Precipitation Days | 69.8 |
| Average Annual Precipitation | 36.2 |
| Average Annual Snowfall | 37.5 |
Average High
Days of Rain
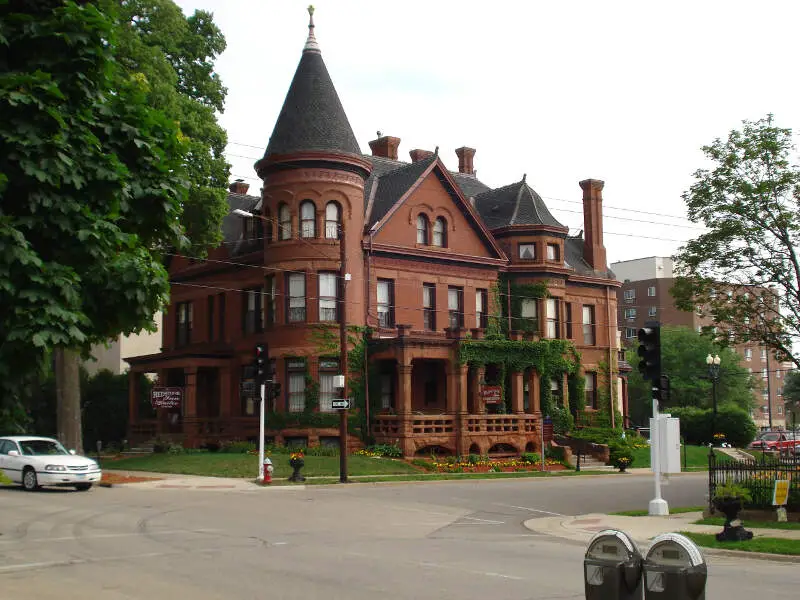
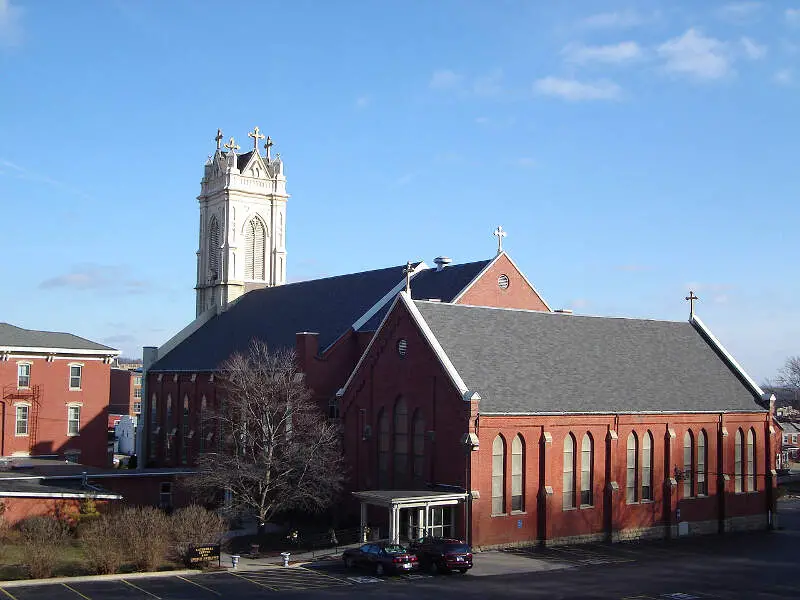
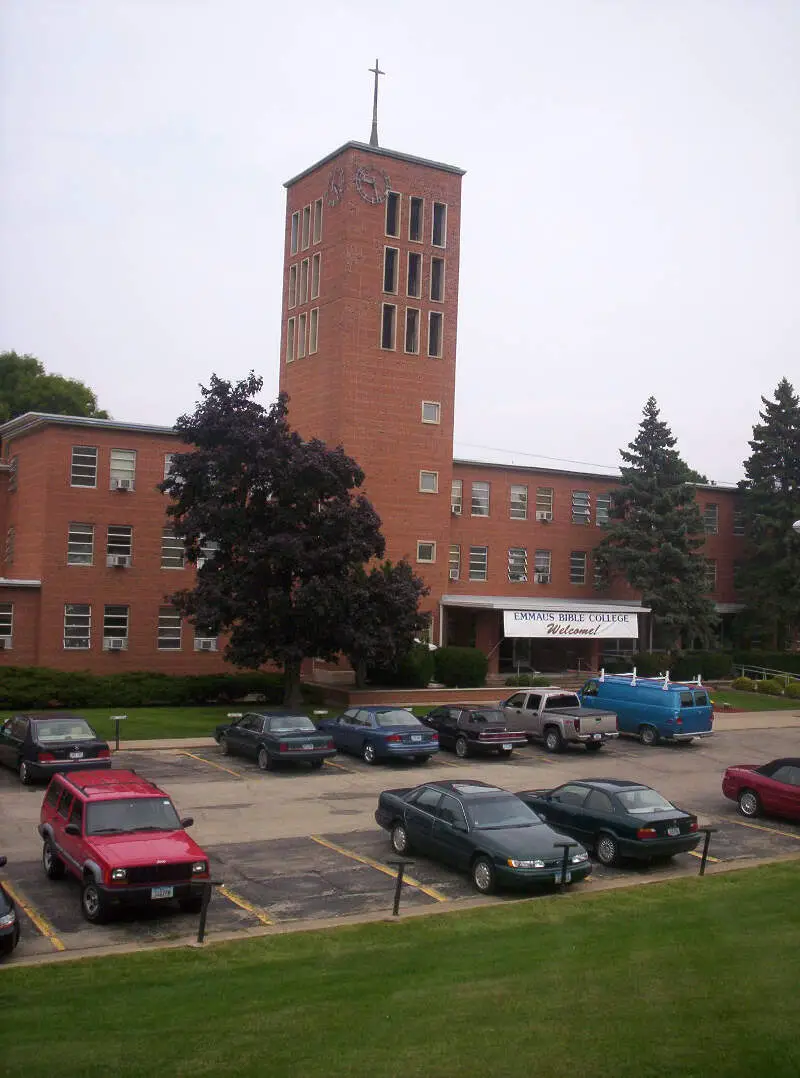
Dubuque, IA Photos


1 Reviews & Comments About Dubuque
/5

HomeSnacks User - 2018-09-06 02:15:26.811278
Dubuque is an all around perfect weather town. It is right on the Mississippi river and you can access 2 other states within miles of each other.
The river has so many things to do while there and the restaurants are amazing.
Rankings for Dubuque in Iowa


Locations Around Dubuque
Map Of Dubuque, IA
Best Places Around Dubuque
Platteville, WI
Population 11,421
Central, LA
Population 29,603
Anamosa, IA
Population 5,553
Manchester, IA
Population 5,144
Prairie du Chien, WI
Population 5,471
Maquoketa, IA
Population 6,105
Dubuque Demographics And Statistics
Population over time in Dubuque
The current population in Dubuque is 59,271. The population has increased 3.1% from 2010.
| Year | Population | % Change |
|---|---|---|
| 2023 | 59,271 | -0.1% |
| 2022 | 59,315 | -0.1% |
| 2021 | 59,379 | 2.3% |
| 2020 | 58,052 | -0.2% |
| 2019 | 58,196 | -0.2% |
| 2018 | 58,340 | -0.1% |
| 2017 | 58,410 | -0.2% |
| 2016 | 58,535 | 0.2% |
| 2015 | 58,409 | 0.6% |
| 2014 | 58,068 | 0.4% |
| 2013 | 57,826 | 0.2% |
| 2012 | 57,727 | 0.1% |
| 2011 | 57,679 | 0.3% |
| 2010 | 57,504 | - |
Race / Ethnicity in Dubuque
Dubuque is:
85.4% White with 50,620 White residents.
4.2% African American with 2,475 African American residents.
0.2% American Indian with 94 American Indian residents.
1.4% Asian with 859 Asian residents.
1.2% Hawaiian with 729 Hawaiian residents.
0.1% Other with 76 Other residents.
4.0% Two Or More with 2,378 Two Or More residents.
3.4% Hispanic with 2,040 Hispanic residents.
| Race | Dubuque | IA | USA |
|---|---|---|---|
| White | 85.4% | 83.1% | 58.2% |
| African American | 4.2% | 3.8% | 12.0% |
| American Indian | 0.2% | 0.2% | 0.5% |
| Asian | 1.4% | 2.4% | 5.7% |
| Hawaiian | 1.2% | 0.1% | 0.2% |
| Other | 0.1% | 0.2% | 0.5% |
| Two Or More | 4.0% | 3.2% | 3.9% |
| Hispanic | 3.4% | 7.0% | 19.0% |
Gender in Dubuque
Dubuque is 50.7% female with 30,074 female residents.
Dubuque is 49.3% male with 29,197 male residents.
| Gender | Dubuque | IA | USA |
|---|---|---|---|
| Female | 50.7% | 49.9% | 50.5% |
| Male | 49.3% | 50.1% | 49.5% |
Highest level of educational attainment in Dubuque for adults over 25
2.0% of adults in Dubuque completed < 9th grade.
4.0% of adults in Dubuque completed 9-12th grade.
31.0% of adults in Dubuque completed high school / ged.
19.0% of adults in Dubuque completed some college.
10.0% of adults in Dubuque completed associate's degree.
22.0% of adults in Dubuque completed bachelor's degree.
9.0% of adults in Dubuque completed master's degree.
2.0% of adults in Dubuque completed professional degree.
1.0% of adults in Dubuque completed doctorate degree.
| Education | Dubuque | IA | USA |
|---|---|---|---|
| < 9th Grade | 2.0% | 3.0% | 5.0% |
| 9-12th Grade | 4.0% | 4.0% | 6.0% |
| High School / GED | 31.0% | 30.0% | 26.0% |
| Some College | 19.0% | 20.0% | 19.0% |
| Associate's Degree | 10.0% | 12.0% | 9.0% |
| Bachelor's Degree | 22.0% | 21.0% | 21.0% |
| Master's Degree | 9.0% | 7.0% | 10.0% |
| Professional Degree | 2.0% | 2.0% | 2.0% |
| Doctorate Degree | 1.0% | 1.0% | 2.0% |
Household Income For Dubuque, Iowa
5.4% of households in Dubuque earn Less than $10,000.
4.6% of households in Dubuque earn $10,000 to $14,999.
6.8% of households in Dubuque earn $15,000 to $24,999.
7.2% of households in Dubuque earn $25,000 to $34,999.
14.1% of households in Dubuque earn $35,000 to $49,999.
19.2% of households in Dubuque earn $50,000 to $74,999.
14.6% of households in Dubuque earn $75,000 to $99,999.
16.3% of households in Dubuque earn $100,000 to $149,999.
6.4% of households in Dubuque earn $150,000 to $199,999.
5.4% of households in Dubuque earn $200,000 or more.
| Income | Dubuque | IA | USA |
|---|---|---|---|
| Less than $10,000 | 5.4% | 4.0% | 4.9% |
| $10,000 to $14,999 | 4.6% | 3.4% | 3.6% |
| $15,000 to $24,999 | 6.8% | 7.0% | 6.6% |
| $25,000 to $34,999 | 7.2% | 7.3% | 6.8% |
| $35,000 to $49,999 | 14.1% | 11.7% | 10.4% |
| $50,000 to $74,999 | 19.2% | 17.8% | 15.7% |
| $75,000 to $99,999 | 14.6% | 14.1% | 12.7% |
| $100,000 to $149,999 | 16.3% | 18.4% | 17.4% |
| $150,000 to $199,999 | 6.4% | 8.4% | 9.3% |
| $200,000 or more | 5.4% | 8.0% | 12.6% |


