Barrington, IL
Demographics And Statistics
Living In Barrington, Illinois Summary
Life in Barrington research summary. HomeSnacks has been using Saturday Night Science to research the quality of life in Barrington over the past nine years using Census, FBI, Zillow, and other primary data sources. Based on the most recently available data, we found the following about life in Barrington:
The population in Barrington is 11,049.
The median home value in Barrington is $602,846.
The median income in Barrington is $150,714.
The cost of living in Barrington is 141 which is 1.4x higher than the national average.
The median rent in Barrington is $1,886.
The unemployment rate in Barrington is 3.4%.
The poverty rate in Barrington is 4.8%.
The average high in Barrington is 59.1° and the average low is 42.0°.
Barrington SnackAbility
Overall SnackAbility
Barrington, IL Crime Report
Crime in Barrington summary. We use data from the FBI to determine the crime rates in Barrington. Key points include:
There were 96 total crimes in Barrington in the last reporting year.
The overall crime rate per 100,000 people in Barrington is 922.9 / 100k people.
The violent crime rate per 100,000 people in Barrington is 105.7 / 100k people.
The property crime rate per 100,000 people in Barrington is 817.2 / 100k people.
Overall, crime in Barrington is -56.45% below the national average.
Total Crimes
Below National Average
Crime In Barrington Comparison Table
| Statistic | Count Raw |
Barrington / 100k People |
Illinois / 100k People |
National / 100k People |
|---|---|---|---|---|
| Total Crimes Per 100K | 96 | 922.9 | 2,004.4 | 2,119.2 |
| Violent Crime | 11 | 105.7 | 289.2 | 359.0 |
| Murder | 1 | 9.6 | 5.8 | 5.0 |
| Robbery | 2 | 19.2 | 90.2 | 61.0 |
| Aggravated Assault | 4 | 38.5 | 146.3 | 256.0 |
| Property Crime | 85 | 817.2 | 1,715.2 | 1,760.0 |
| Burglary | 20 | 192.3 | 290.5 | 229.0 |
| Larceny | 54 | 519.1 | 1,134.4 | 1,272.0 |
| Car Theft | 11 | 105.7 | 290.4 | 259.0 |
Barrington, IL Cost Of Living
Cost of living in Barrington summary. We use data on the cost of living to determine how expensive it is to live in Barrington. Real estate prices drive most of the variance in cost of living around Illinois. Key points include:
The cost of living in Barrington is 141 with 100 being average.
The cost of living in Barrington is 1.4x higher than the national average.
The median home value in Barrington is $602,846.
The median income in Barrington is $150,714.
Barrington's Overall Cost Of Living
Higher Than The National Average
Cost Of Living In Barrington Comparison Table
| Living Expense | Barrington | Illinois | National Average | |
|---|---|---|---|---|
| Overall | 141 | 97 | 100 | |
| Services | 108 | 95 | 100 | |
| Groceries | 103 | 99 | 100 | |
| Health | 109 | 93 | 100 | |
| Housing | 223 | 95 | 100 | |
| Transportation | 108 | 102 | 100 | |
| Utilities | 90 | 91 | 100 | |
Barrington, IL Weather
The average high in Barrington is 59.1° and the average low is 42.0°.
There are 72.6 days of precipitation each year.
Expect an average of 38.2 inches of precipitation each year with 34.2 inches of snow.
| Stat | Barrington |
|---|---|
| Average Annual High | 59.1 |
| Average Annual Low | 42.0 |
| Annual Precipitation Days | 72.6 |
| Average Annual Precipitation | 38.2 |
| Average Annual Snowfall | 34.2 |
Average High
Days of Rain
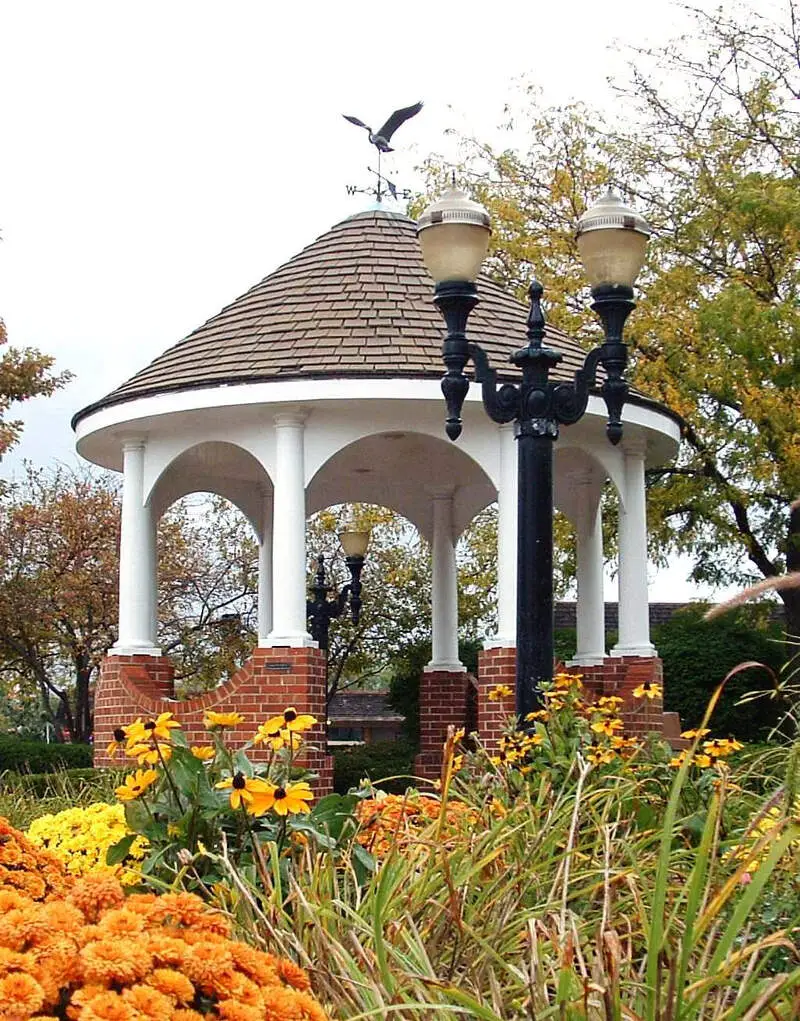
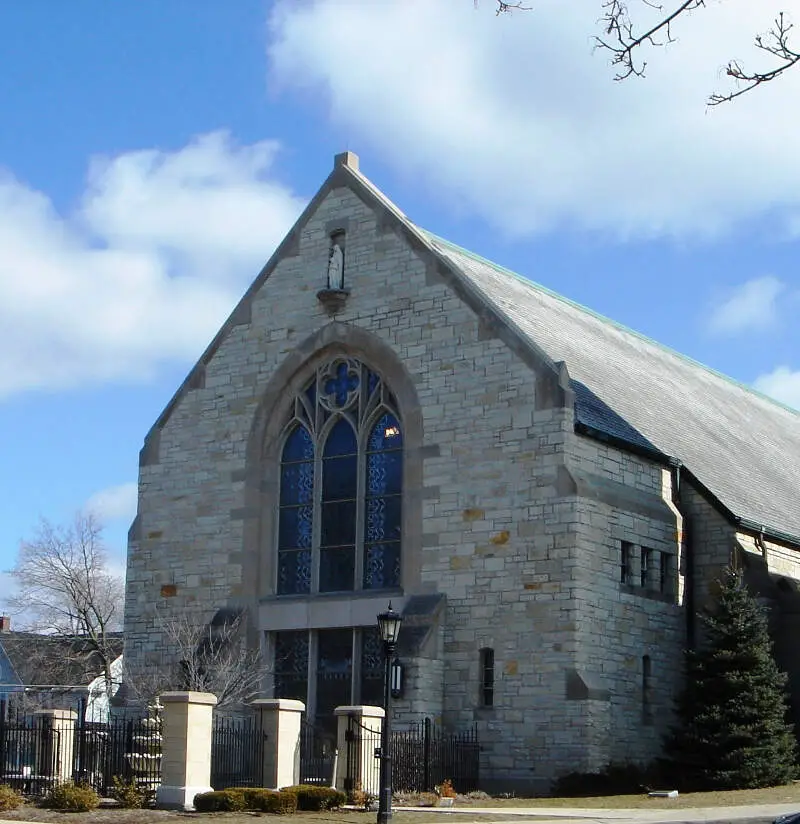
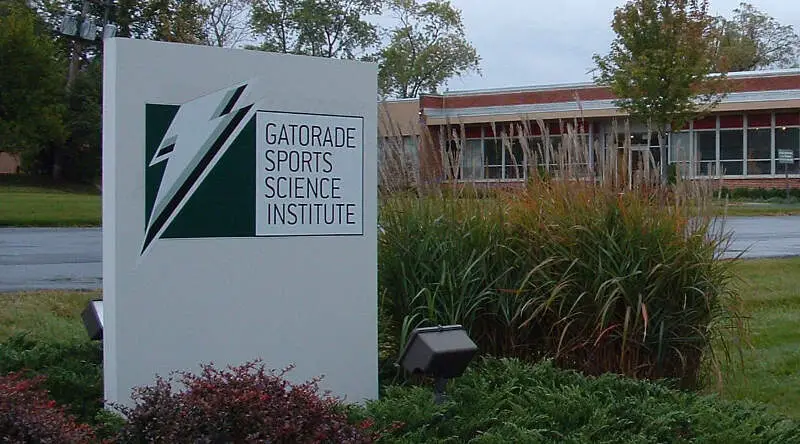
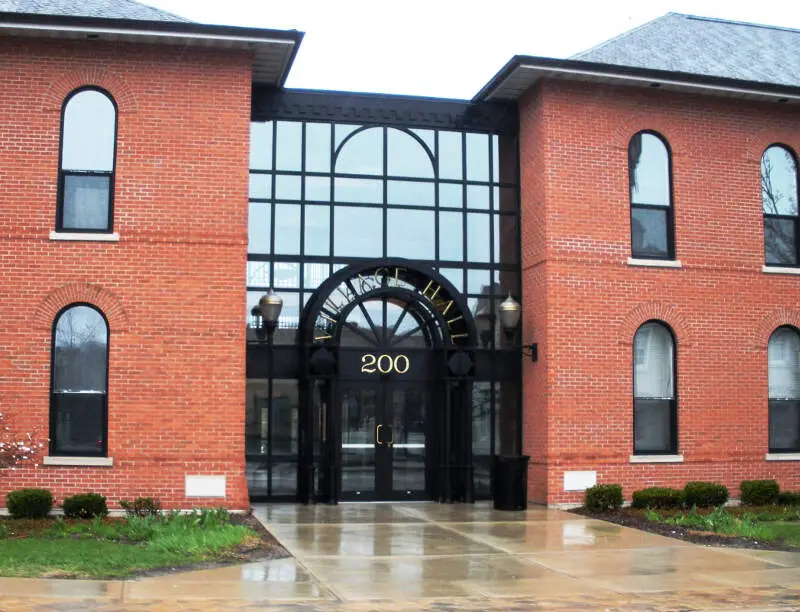
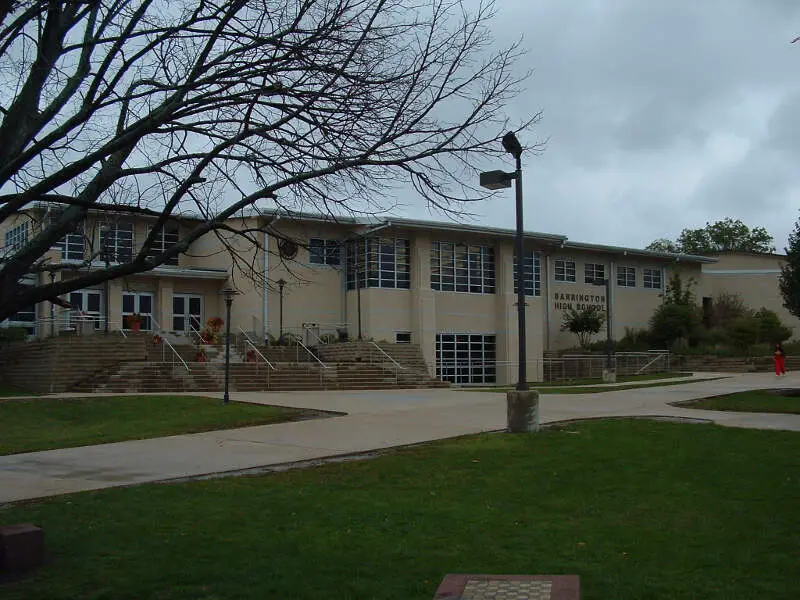
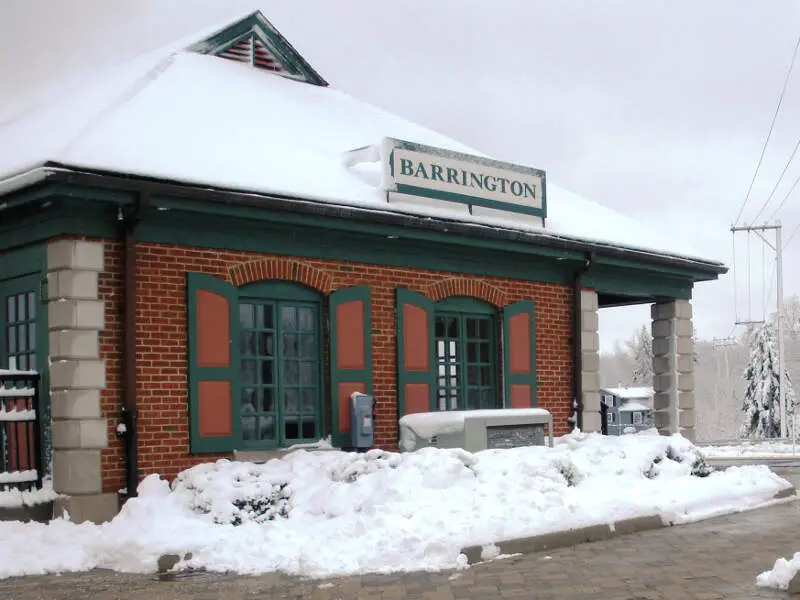
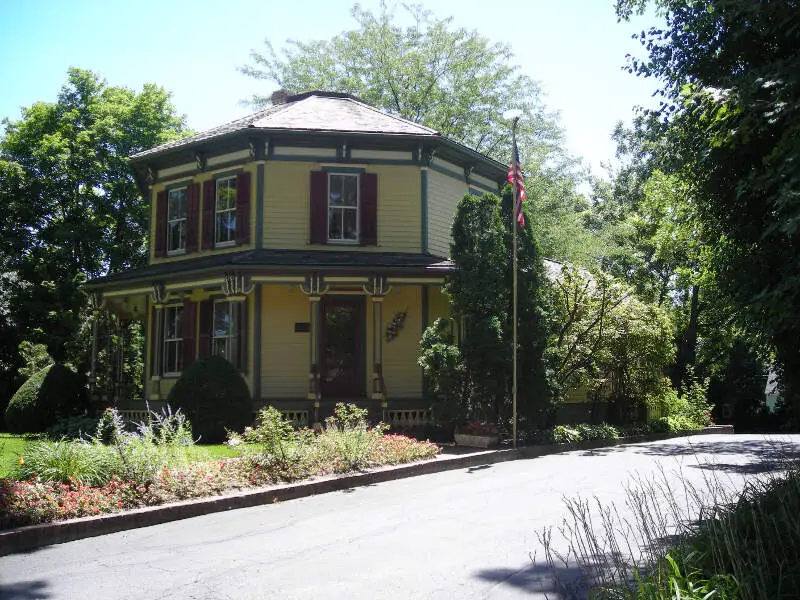
Barrington, IL Photos


Rankings for Barrington in Illinois


Locations Around Barrington
Map Of Barrington, IL
Best Places Around Barrington
Highland Park, IL
Population 30,229
Buffalo Grove, IL
Population 42,824
Deerfield, IL
Population 19,185
Northbrook, IL
Population 34,642
Elmhurst, IL
Population 45,538
Glenview, IL
Population 47,682
Park Ridge, IL
Population 39,241
Winfield, IL
Population 9,982
Lake Bluff, IL
Population 5,834
Lake Zurich, IL
Population 19,727
Barrington Demographics And Statistics
Population over time in Barrington
The current population in Barrington is 11,049. The population has increased 3.6% from 2010.
| Year | Population | % Change |
|---|---|---|
| 2023 | 11,049 | -1.7% |
| 2022 | 11,244 | 0.6% |
| 2021 | 11,174 | 7.0% |
| 2020 | 10,442 | 1.5% |
| 2019 | 10,290 | -0.1% |
| 2018 | 10,304 | -1.4% |
| 2017 | 10,455 | 0.1% |
| 2016 | 10,449 | -1.2% |
| 2015 | 10,576 | -2.3% |
| 2014 | 10,830 | 1.6% |
| 2013 | 10,662 | -0.7% |
| 2012 | 10,739 | 1.0% |
| 2011 | 10,636 | -0.2% |
| 2010 | 10,662 | - |
Race / Ethnicity in Barrington
Barrington is:
81.4% White with 8,991 White residents.
1.2% African American with 138 African American residents.
0.0% American Indian with 0 American Indian residents.
9.4% Asian with 1,034 Asian residents.
0.0% Hawaiian with 0 Hawaiian residents.
1.1% Other with 125 Other residents.
4.0% Two Or More with 444 Two Or More residents.
2.9% Hispanic with 317 Hispanic residents.
| Race | Barrington | IL | USA |
|---|---|---|---|
| White | 81.4% | 58.7% | 58.2% |
| African American | 1.2% | 13.6% | 12.0% |
| American Indian | 0.0% | 0.1% | 0.5% |
| Asian | 9.4% | 5.8% | 5.7% |
| Hawaiian | 0.0% | 0.0% | 0.2% |
| Other | 1.1% | 0.3% | 0.5% |
| Two Or More | 4.0% | 3.0% | 3.9% |
| Hispanic | 2.9% | 18.5% | 19.0% |
Gender in Barrington
Barrington is 51.8% female with 5,718 female residents.
Barrington is 48.2% male with 5,331 male residents.
| Gender | Barrington | IL | USA |
|---|---|---|---|
| Female | 51.8% | 50.6% | 50.5% |
| Male | 48.2% | 49.4% | 49.5% |
Highest level of educational attainment in Barrington for adults over 25
-0.0% of adults in Barrington completed < 9th grade.
3.0% of adults in Barrington completed 9-12th grade.
7.0% of adults in Barrington completed high school / ged.
13.0% of adults in Barrington completed some college.
4.0% of adults in Barrington completed associate's degree.
47.0% of adults in Barrington completed bachelor's degree.
20.0% of adults in Barrington completed master's degree.
5.0% of adults in Barrington completed professional degree.
1.0% of adults in Barrington completed doctorate degree.
| Education | Barrington | IL | USA |
|---|---|---|---|
| < 9th Grade | -0.0% | 5.0% | 5.0% |
| 9-12th Grade | 3.0% | 5.0% | 6.0% |
| High School / GED | 7.0% | 25.0% | 26.0% |
| Some College | 13.0% | 20.0% | 19.0% |
| Associate's Degree | 4.0% | 8.0% | 9.0% |
| Bachelor's Degree | 47.0% | 22.0% | 21.0% |
| Master's Degree | 20.0% | 11.0% | 10.0% |
| Professional Degree | 5.0% | 2.0% | 2.0% |
| Doctorate Degree | 1.0% | 2.0% | 2.0% |
Household Income For Barrington, Illinois
6.4% of households in Barrington earn Less than $10,000.
0.1% of households in Barrington earn $10,000 to $14,999.
0.6% of households in Barrington earn $15,000 to $24,999.
5.3% of households in Barrington earn $25,000 to $34,999.
4.8% of households in Barrington earn $35,000 to $49,999.
11.8% of households in Barrington earn $50,000 to $74,999.
9.0% of households in Barrington earn $75,000 to $99,999.
11.7% of households in Barrington earn $100,000 to $149,999.
11.8% of households in Barrington earn $150,000 to $199,999.
38.3% of households in Barrington earn $200,000 or more.
| Income | Barrington | IL | USA |
|---|---|---|---|
| Less than $10,000 | 6.4% | 5.2% | 4.9% |
| $10,000 to $14,999 | 0.1% | 3.4% | 3.6% |
| $15,000 to $24,999 | 0.6% | 6.2% | 6.6% |
| $25,000 to $34,999 | 5.3% | 6.5% | 6.8% |
| $35,000 to $49,999 | 4.8% | 9.9% | 10.4% |
| $50,000 to $74,999 | 11.8% | 15.1% | 15.7% |
| $75,000 to $99,999 | 9.0% | 12.7% | 12.7% |
| $100,000 to $149,999 | 11.7% | 17.9% | 17.4% |
| $150,000 to $199,999 | 11.8% | 9.9% | 9.3% |
| $200,000 or more | 38.3% | 13.1% | 12.6% |


