Elgin, IL
Demographics And Statistics
Living In Elgin, Illinois Summary
Life in Elgin research summary. HomeSnacks has been using Saturday Night Science to research the quality of life in Elgin over the past nine years using Census, FBI, Zillow, and other primary data sources. Based on the most recently available data, we found the following about life in Elgin:
The population in Elgin is 114,106.
The median home value in Elgin is $323,555.
The median income in Elgin is $88,316.
The cost of living in Elgin is 107 which is 1.1x higher than the national average.
The median rent in Elgin is $1,260.
The unemployment rate in Elgin is 6.3%.
The poverty rate in Elgin is 10.4%.
The average high in Elgin is 58.7° and the average low is 38.6°.
Elgin SnackAbility
Overall SnackAbility
Elgin, IL Crime Report
Crime in Elgin summary. We use data from the FBI to determine the crime rates in Elgin. Key points include:
There were 1,545 total crimes in Elgin in the last reporting year.
The overall crime rate per 100,000 people in Elgin is 1,368.7 / 100k people.
The violent crime rate per 100,000 people in Elgin is 266.7 / 100k people.
The property crime rate per 100,000 people in Elgin is 1,102.1 / 100k people.
Overall, crime in Elgin is -35.41% below the national average.
Total Crimes
Below National Average
Crime In Elgin Comparison Table
| Statistic | Count Raw |
Elgin / 100k People |
Illinois / 100k People |
National / 100k People |
|---|---|---|---|---|
| Total Crimes Per 100K | 1,545 | 1,368.7 | 2,004.4 | 2,119.2 |
| Violent Crime | 301 | 266.7 | 289.2 | 359.0 |
| Murder | 5 | 4.4 | 5.8 | 5.0 |
| Robbery | 35 | 31.0 | 90.2 | 61.0 |
| Aggravated Assault | 188 | 166.6 | 146.3 | 256.0 |
| Property Crime | 1,244 | 1,102.1 | 1,715.2 | 1,760.0 |
| Burglary | 239 | 211.7 | 290.5 | 229.0 |
| Larceny | 908 | 804.4 | 1,134.4 | 1,272.0 |
| Car Theft | 97 | 85.9 | 290.4 | 259.0 |
Elgin, IL Cost Of Living
Cost of living in Elgin summary. We use data on the cost of living to determine how expensive it is to live in Elgin. Real estate prices drive most of the variance in cost of living around Illinois. Key points include:
The cost of living in Elgin is 107 with 100 being average.
The cost of living in Elgin is 1.1x higher than the national average.
The median home value in Elgin is $323,555.
The median income in Elgin is $88,316.
Elgin's Overall Cost Of Living
Higher Than The National Average
Cost Of Living In Elgin Comparison Table
| Living Expense | Elgin | Illinois | National Average | |
|---|---|---|---|---|
| Overall | 107 | 97 | 100 | |
| Services | 107 | 95 | 100 | |
| Groceries | 105 | 99 | 100 | |
| Health | 109 | 93 | 100 | |
| Housing | 107 | 95 | 100 | |
| Transportation | 108 | 102 | 100 | |
| Utilities | 90 | 91 | 100 | |
Elgin, IL Weather
The average high in Elgin is 58.7° and the average low is 38.6°.
There are 70.7 days of precipitation each year.
Expect an average of 36.8 inches of precipitation each year with 31.2 inches of snow.
| Stat | Elgin |
|---|---|
| Average Annual High | 58.7 |
| Average Annual Low | 38.6 |
| Annual Precipitation Days | 70.7 |
| Average Annual Precipitation | 36.8 |
| Average Annual Snowfall | 31.2 |
Average High
Days of Rain
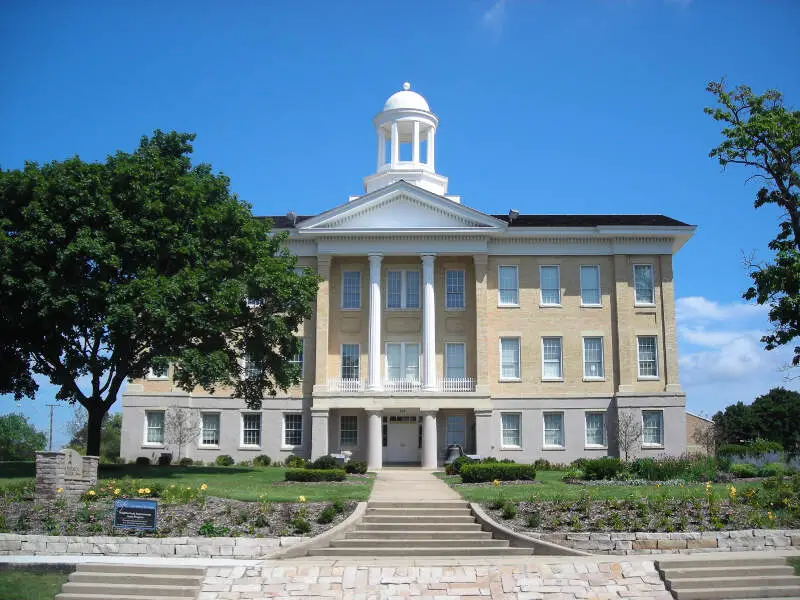
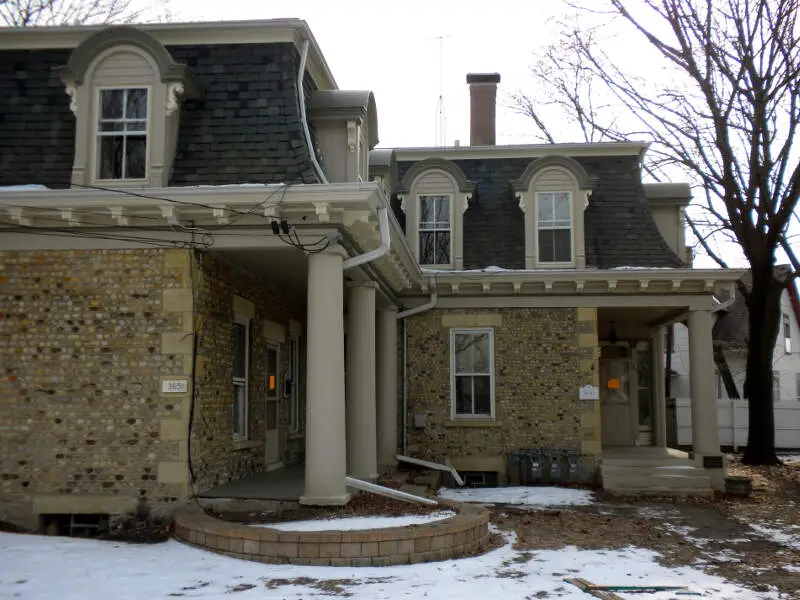
Elgin, IL Photos

Rankings for Elgin in Illinois


Locations Around Elgin
Map Of Elgin, IL
Best Places Around Elgin
Winfield, IL
Population 9,982
Glen Ellyn, IL
Population 28,270
Lake Zurich, IL
Population 19,727
Wheaton, IL
Population 53,453
Arlington Heights, IL
Population 76,220
Bartlett, IL
Population 40,531
Hawthorn Woods, IL
Population 9,145
Mount Prospect, IL
Population 55,648
Hoffman Estates, IL
Population 51,186
Long Grove, IL
Population 8,266
Elgin Demographics And Statistics
Population over time in Elgin
The current population in Elgin is 114,106. The population has increased 6.8% from 2010.
| Year | Population | % Change |
|---|---|---|
| 2023 | 114,106 | -0.1% |
| 2022 | 114,190 | 0.0% |
| 2021 | 114,156 | 1.9% |
| 2020 | 112,062 | -0.5% |
| 2019 | 112,653 | -0.3% |
| 2018 | 113,023 | 0.4% |
| 2017 | 112,628 | 0.6% |
| 2016 | 111,919 | -0.2% |
| 2015 | 112,105 | 1.1% |
| 2014 | 110,906 | 1.0% |
| 2013 | 109,825 | 0.3% |
| 2012 | 109,513 | 0.8% |
| 2011 | 108,681 | 1.7% |
| 2010 | 106,837 | - |
Race / Ethnicity in Elgin
Elgin is:
36.3% White with 41,369 White residents.
4.9% African American with 5,594 African American residents.
0.3% American Indian with 306 American Indian residents.
5.9% Asian with 6,751 Asian residents.
0.0% Hawaiian with 0 Hawaiian residents.
0.6% Other with 679 Other residents.
3.6% Two Or More with 4,156 Two Or More residents.
48.4% Hispanic with 55,251 Hispanic residents.
| Race | Elgin | IL | USA |
|---|---|---|---|
| White | 36.3% | 58.7% | 58.2% |
| African American | 4.9% | 13.6% | 12.0% |
| American Indian | 0.3% | 0.1% | 0.5% |
| Asian | 5.9% | 5.8% | 5.7% |
| Hawaiian | 0.0% | 0.0% | 0.2% |
| Other | 0.6% | 0.3% | 0.5% |
| Two Or More | 3.6% | 3.0% | 3.9% |
| Hispanic | 48.4% | 18.5% | 19.0% |
Gender in Elgin
Elgin is 49.3% female with 56,280 female residents.
Elgin is 50.7% male with 57,825 male residents.
| Gender | Elgin | IL | USA |
|---|---|---|---|
| Female | 49.3% | 50.6% | 50.5% |
| Male | 50.7% | 49.4% | 49.5% |
Highest level of educational attainment in Elgin for adults over 25
11.0% of adults in Elgin completed < 9th grade.
8.0% of adults in Elgin completed 9-12th grade.
26.0% of adults in Elgin completed high school / ged.
21.0% of adults in Elgin completed some college.
8.0% of adults in Elgin completed associate's degree.
17.0% of adults in Elgin completed bachelor's degree.
7.0% of adults in Elgin completed master's degree.
1.0% of adults in Elgin completed professional degree.
1.0% of adults in Elgin completed doctorate degree.
| Education | Elgin | IL | USA |
|---|---|---|---|
| < 9th Grade | 11.0% | 5.0% | 5.0% |
| 9-12th Grade | 8.0% | 5.0% | 6.0% |
| High School / GED | 26.0% | 25.0% | 26.0% |
| Some College | 21.0% | 20.0% | 19.0% |
| Associate's Degree | 8.0% | 8.0% | 9.0% |
| Bachelor's Degree | 17.0% | 22.0% | 21.0% |
| Master's Degree | 7.0% | 11.0% | 10.0% |
| Professional Degree | 1.0% | 2.0% | 2.0% |
| Doctorate Degree | 1.0% | 2.0% | 2.0% |
Household Income For Elgin, Illinois
2.6% of households in Elgin earn Less than $10,000.
2.8% of households in Elgin earn $10,000 to $14,999.
4.6% of households in Elgin earn $15,000 to $24,999.
6.6% of households in Elgin earn $25,000 to $34,999.
10.1% of households in Elgin earn $35,000 to $49,999.
14.5% of households in Elgin earn $50,000 to $74,999.
16.1% of households in Elgin earn $75,000 to $99,999.
22.1% of households in Elgin earn $100,000 to $149,999.
10.8% of households in Elgin earn $150,000 to $199,999.
9.8% of households in Elgin earn $200,000 or more.
| Income | Elgin | IL | USA |
|---|---|---|---|
| Less than $10,000 | 2.6% | 5.2% | 4.9% |
| $10,000 to $14,999 | 2.8% | 3.4% | 3.6% |
| $15,000 to $24,999 | 4.6% | 6.2% | 6.6% |
| $25,000 to $34,999 | 6.6% | 6.5% | 6.8% |
| $35,000 to $49,999 | 10.1% | 9.9% | 10.4% |
| $50,000 to $74,999 | 14.5% | 15.1% | 15.7% |
| $75,000 to $99,999 | 16.1% | 12.7% | 12.7% |
| $100,000 to $149,999 | 22.1% | 17.9% | 17.4% |
| $150,000 to $199,999 | 10.8% | 9.9% | 9.3% |
| $200,000 or more | 9.8% | 13.1% | 12.6% |


