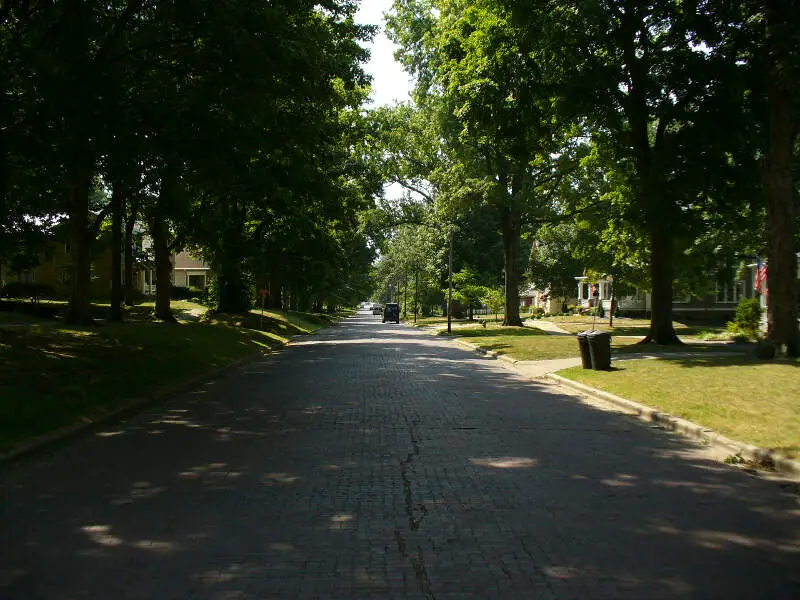
Mount Carmel, IL
Demographics And Statistics
Living In Mount Carmel, Illinois Summary
Life in Mount Carmel research summary. HomeSnacks has been using Saturday Night Science to research the quality of life in Mount Carmel over the past nine years using Census, FBI, Zillow, and other primary data sources. Based on the most recently available data, we found the following about life in Mount Carmel:
The population in Mount Carmel is 6,892.
The median home value in Mount Carmel is $110,676.
The median income in Mount Carmel is $45,884.
The cost of living in Mount Carmel is 86 which is 0.9x lower than the national average.
The median rent in Mount Carmel is $750.
The unemployment rate in Mount Carmel is 4.8%.
The poverty rate in Mount Carmel is 15.9%.
The average high in Mount Carmel is 65.7° and the average low is 45.0°.
Mount Carmel SnackAbility
Overall SnackAbility
Mount Carmel, IL Crime Report
Crime in Mount Carmel summary. We use data from the FBI to determine the crime rates in Mount Carmel. Key points include:
There were 40 total crimes in Mount Carmel in the last reporting year.
The overall crime rate per 100,000 people in Mount Carmel is 599.2 / 100k people.
The violent crime rate per 100,000 people in Mount Carmel is 134.8 / 100k people.
The property crime rate per 100,000 people in Mount Carmel is 464.3 / 100k people.
Overall, crime in Mount Carmel is -71.73% below the national average.
Total Crimes
Below National Average
Crime In Mount Carmel Comparison Table
| Statistic | Count Raw |
Mount Carmel / 100k People |
Illinois / 100k People |
National / 100k People |
|---|---|---|---|---|
| Total Crimes Per 100K | 40 | 599.2 | 2,004.4 | 2,119.2 |
| Violent Crime | 9 | 134.8 | 289.2 | 359.0 |
| Murder | 0 | 0.0 | 5.8 | 5.0 |
| Robbery | 0 | 0.0 | 90.2 | 61.0 |
| Aggravated Assault | 6 | 89.9 | 146.3 | 256.0 |
| Property Crime | 31 | 464.3 | 1,715.2 | 1,760.0 |
| Burglary | 3 | 44.9 | 290.5 | 229.0 |
| Larceny | 28 | 419.4 | 1,134.4 | 1,272.0 |
| Car Theft | 0 | 0.0 | 290.4 | 259.0 |
Mount Carmel, IL Cost Of Living
Cost of living in Mount Carmel summary. We use data on the cost of living to determine how expensive it is to live in Mount Carmel. Real estate prices drive most of the variance in cost of living around Illinois. Key points include:
The cost of living in Mount Carmel is 86 with 100 being average.
The cost of living in Mount Carmel is 0.9x lower than the national average.
The median home value in Mount Carmel is $110,676.
The median income in Mount Carmel is $45,884.
Mount Carmel's Overall Cost Of Living
Lower Than The National Average
Cost Of Living In Mount Carmel Comparison Table
| Living Expense | Mount Carmel | Illinois | National Average | |
|---|---|---|---|---|
| Overall | 86 | 97 | 100 | |
| Services | 101 | 95 | 100 | |
| Groceries | 93 | 99 | 100 | |
| Health | 89 | 93 | 100 | |
| Housing | 51 | 95 | 100 | |
| Transportation | 90 | 102 | 100 | |
| Utilities | 122 | 91 | 100 | |
Mount Carmel, IL Weather
The average high in Mount Carmel is 65.7° and the average low is 45.0°.
There are 72.9 days of precipitation each year.
Expect an average of 45.7 inches of precipitation each year with 9.2 inches of snow.
| Stat | Mount Carmel |
|---|---|
| Average Annual High | 65.7 |
| Average Annual Low | 45.0 |
| Annual Precipitation Days | 72.9 |
| Average Annual Precipitation | 45.7 |
| Average Annual Snowfall | 9.2 |
Average High
Days of Rain
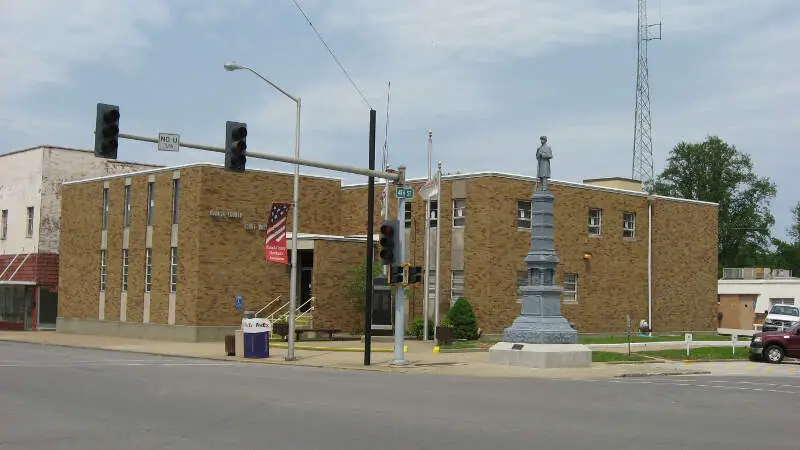
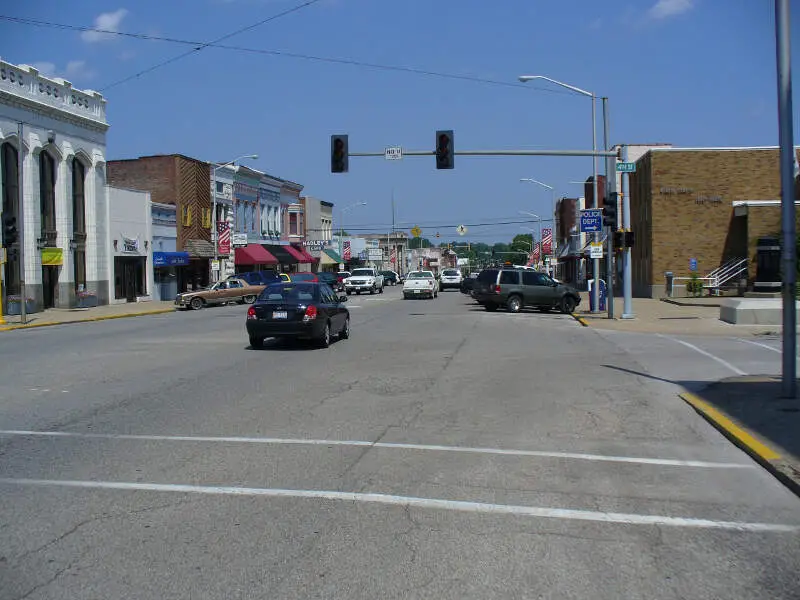
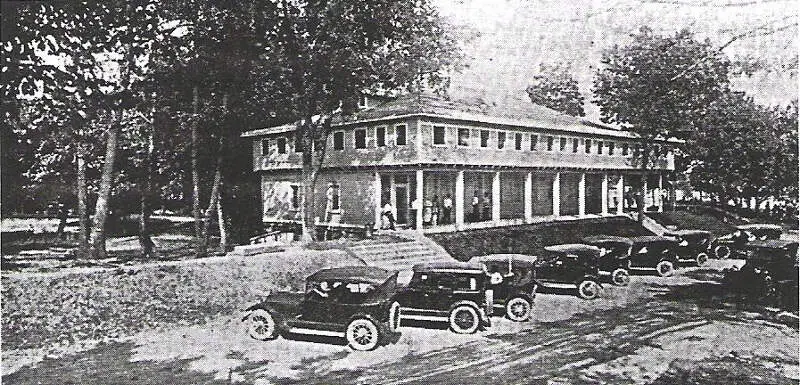
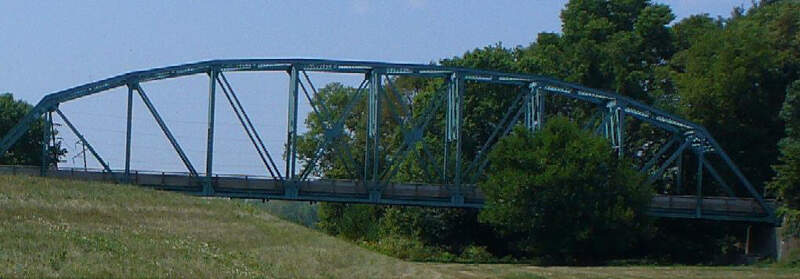
Mount Carmel, IL Photos
1 Reviews & Comments About Mount Carmel
/5

Kat - None
I'm originally from Seattle Washington and I live in Mount Vernon Illinois right now I used to live in Mount Carmel and hands down Mount Carmel is the worst place I have ever been
Rankings for Mount Carmel in Illinois


Locations Around Mount Carmel
Map Of Mount Carmel, IL
Best Places Around Mount Carmel
Carmi, IL
Population 4,879
Jasper, IN
Population 16,421
Robinson, IL
Population 7,005
Mount Vernon, IN
Population 6,431
Huntingburg, IN
Population 6,504
Washington, IN
Population 12,192
Henderson, KY
Population 27,994
Vincennes, IN
Population 16,676
Mount Carmel Demographics And Statistics
Population over time in Mount Carmel
The current population in Mount Carmel is 6,892. The population has decreased -7.3% from 2010.
| Year | Population | % Change |
|---|---|---|
| 2023 | 6,892 | -1.2% |
| 2022 | 6,978 | 0.6% |
| 2021 | 6,937 | 0.2% |
| 2020 | 6,922 | -1.4% |
| 2019 | 7,019 | -0.3% |
| 2018 | 7,040 | 0.1% |
| 2017 | 7,032 | -0.2% |
| 2016 | 7,048 | -0.7% |
| 2015 | 7,098 | -0.8% |
| 2014 | 7,155 | -1.0% |
| 2013 | 7,228 | -0.7% |
| 2012 | 7,276 | -1.2% |
| 2011 | 7,362 | -1.0% |
| 2010 | 7,437 | - |
Race / Ethnicity in Mount Carmel
Mount Carmel is:
92.1% White with 6,347 White residents.
1.4% African American with 99 African American residents.
0.0% American Indian with 1 American Indian residents.
1.6% Asian with 107 Asian residents.
0.0% Hawaiian with 0 Hawaiian residents.
0.0% Other with 0 Other residents.
2.6% Two Or More with 179 Two Or More residents.
2.3% Hispanic with 159 Hispanic residents.
| Race | Mount Carmel | IL | USA |
|---|---|---|---|
| White | 92.1% | 58.7% | 58.2% |
| African American | 1.4% | 13.6% | 12.0% |
| American Indian | 0.0% | 0.1% | 0.5% |
| Asian | 1.6% | 5.8% | 5.7% |
| Hawaiian | 0.0% | 0.0% | 0.2% |
| Other | 0.0% | 0.3% | 0.5% |
| Two Or More | 2.6% | 3.0% | 3.9% |
| Hispanic | 2.3% | 18.5% | 19.0% |
Gender in Mount Carmel
Mount Carmel is 52.1% female with 3,589 female residents.
Mount Carmel is 47.9% male with 3,302 male residents.
| Gender | Mount Carmel | IL | USA |
|---|---|---|---|
| Female | 52.1% | 50.6% | 50.5% |
| Male | 47.9% | 49.4% | 49.5% |
Highest level of educational attainment in Mount Carmel for adults over 25
2.0% of adults in Mount Carmel completed < 9th grade.
6.0% of adults in Mount Carmel completed 9-12th grade.
34.0% of adults in Mount Carmel completed high school / ged.
21.0% of adults in Mount Carmel completed some college.
20.0% of adults in Mount Carmel completed associate's degree.
12.0% of adults in Mount Carmel completed bachelor's degree.
4.0% of adults in Mount Carmel completed master's degree.
0.0% of adults in Mount Carmel completed professional degree.
1.0% of adults in Mount Carmel completed doctorate degree.
| Education | Mount Carmel | IL | USA |
|---|---|---|---|
| < 9th Grade | 2.0% | 5.0% | 5.0% |
| 9-12th Grade | 6.0% | 5.0% | 6.0% |
| High School / GED | 34.0% | 25.0% | 26.0% |
| Some College | 21.0% | 20.0% | 19.0% |
| Associate's Degree | 20.0% | 8.0% | 9.0% |
| Bachelor's Degree | 12.0% | 22.0% | 21.0% |
| Master's Degree | 4.0% | 11.0% | 10.0% |
| Professional Degree | 0.0% | 2.0% | 2.0% |
| Doctorate Degree | 1.0% | 2.0% | 2.0% |
Household Income For Mount Carmel, Illinois
7.6% of households in Mount Carmel earn Less than $10,000.
5.3% of households in Mount Carmel earn $10,000 to $14,999.
16.7% of households in Mount Carmel earn $15,000 to $24,999.
7.4% of households in Mount Carmel earn $25,000 to $34,999.
16.7% of households in Mount Carmel earn $35,000 to $49,999.
13.7% of households in Mount Carmel earn $50,000 to $74,999.
9.8% of households in Mount Carmel earn $75,000 to $99,999.
13.8% of households in Mount Carmel earn $100,000 to $149,999.
4.4% of households in Mount Carmel earn $150,000 to $199,999.
4.6% of households in Mount Carmel earn $200,000 or more.
| Income | Mount Carmel | IL | USA |
|---|---|---|---|
| Less than $10,000 | 7.6% | 5.2% | 4.9% |
| $10,000 to $14,999 | 5.3% | 3.4% | 3.6% |
| $15,000 to $24,999 | 16.7% | 6.2% | 6.6% |
| $25,000 to $34,999 | 7.4% | 6.5% | 6.8% |
| $35,000 to $49,999 | 16.7% | 9.9% | 10.4% |
| $50,000 to $74,999 | 13.7% | 15.1% | 15.7% |
| $75,000 to $99,999 | 9.8% | 12.7% | 12.7% |
| $100,000 to $149,999 | 13.8% | 17.9% | 17.4% |
| $150,000 to $199,999 | 4.4% | 9.9% | 9.3% |
| $200,000 or more | 4.6% | 13.1% | 12.6% |


