Orland Park, IL
Demographics And Statistics
Living In Orland Park, Illinois Summary
Life in Orland Park research summary. HomeSnacks has been using Saturday Night Science to research the quality of life in Orland Park over the past nine years using Census, FBI, Zillow, and other primary data sources. Based on the most recently available data, we found the following about life in Orland Park:
The population in Orland Park is 57,961.
The median home value in Orland Park is $395,067.
The median income in Orland Park is $98,979.
The cost of living in Orland Park is 113 which is 1.1x higher than the national average.
The median rent in Orland Park is $1,415.
The unemployment rate in Orland Park is 4.7%.
The poverty rate in Orland Park is 6.6%.
The average high in Orland Park is 59.5° and the average low is 41.1°.
Orland Park SnackAbility
Overall SnackAbility
Orland Park, IL Crime Report
Crime in Orland Park summary. We use data from the FBI to determine the crime rates in Orland Park. Key points include:
There were 637 total crimes in Orland Park in the last reporting year.
The overall crime rate per 100,000 people in Orland Park is 1,125.6 / 100k people.
The violent crime rate per 100,000 people in Orland Park is 28.3 / 100k people.
The property crime rate per 100,000 people in Orland Park is 1,097.3 / 100k people.
Overall, crime in Orland Park is -46.89% below the national average.
Total Crimes
Below National Average
Crime In Orland Park Comparison Table
| Statistic | Count Raw |
Orland Park / 100k People |
Illinois / 100k People |
National / 100k People |
|---|---|---|---|---|
| Total Crimes Per 100K | 637 | 1,125.6 | 2,004.4 | 2,119.2 |
| Violent Crime | 16 | 28.3 | 289.2 | 359.0 |
| Murder | 1 | 1.8 | 5.8 | 5.0 |
| Robbery | 7 | 12.4 | 90.2 | 61.0 |
| Aggravated Assault | 7 | 12.4 | 146.3 | 256.0 |
| Property Crime | 621 | 1,097.3 | 1,715.2 | 1,760.0 |
| Burglary | 129 | 227.9 | 290.5 | 229.0 |
| Larceny | 443 | 782.8 | 1,134.4 | 1,272.0 |
| Car Theft | 49 | 86.6 | 290.4 | 259.0 |
Orland Park, IL Cost Of Living
Cost of living in Orland Park summary. We use data on the cost of living to determine how expensive it is to live in Orland Park. Real estate prices drive most of the variance in cost of living around Illinois. Key points include:
The cost of living in Orland Park is 113 with 100 being average.
The cost of living in Orland Park is 1.1x higher than the national average.
The median home value in Orland Park is $395,067.
The median income in Orland Park is $98,979.
Orland Park's Overall Cost Of Living
Higher Than The National Average
Cost Of Living In Orland Park Comparison Table
| Living Expense | Orland Park | Illinois | National Average | |
|---|---|---|---|---|
| Overall | 113 | 97 | 100 | |
| Services | 105 | 95 | 100 | |
| Groceries | 99 | 99 | 100 | |
| Health | 99 | 93 | 100 | |
| Housing | 148 | 95 | 100 | |
| Transportation | 112 | 102 | 100 | |
| Utilities | 82 | 91 | 100 | |
Orland Park, IL Weather
The average high in Orland Park is 59.5° and the average low is 41.1°.
There are 74.9 days of precipitation each year.
Expect an average of 38.8 inches of precipitation each year with 31.0 inches of snow.
| Stat | Orland Park |
|---|---|
| Average Annual High | 59.5 |
| Average Annual Low | 41.1 |
| Annual Precipitation Days | 74.9 |
| Average Annual Precipitation | 38.8 |
| Average Annual Snowfall | 31.0 |
Average High
Days of Rain
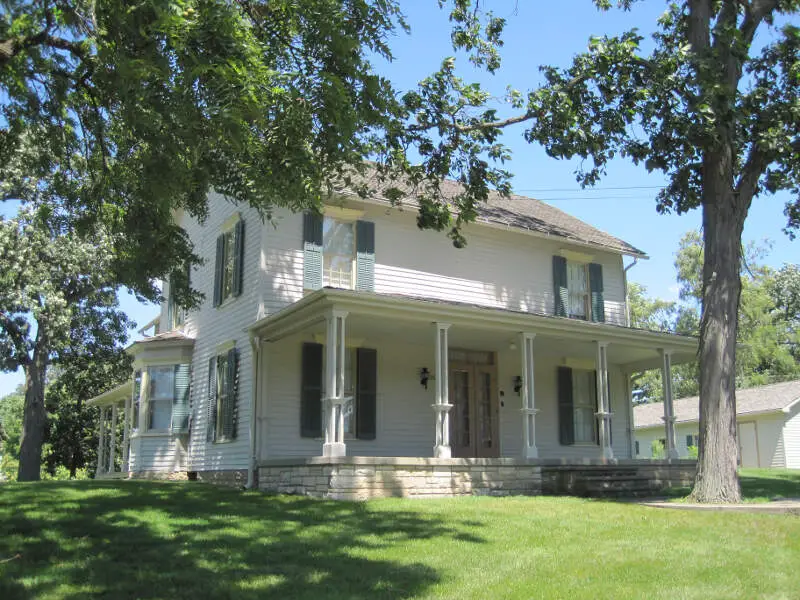
Orland Park, IL Photos
1 Reviews & Comments About Orland Park
/5

HomeSnacks User - 2018-08-03 19:05:17.933336
I love Orland Park. The community is beautiful with plenty of shopping. There are trees and well kept homes throughout. It is about 20 miles to downtown Chicago and there is plenty of public transportation to get you there.
The Orland Park Mall is one of my favorites. This mall has everything you want, but, if you can't find what you are looking for here, there is plenty more. Each block along the main routes have shopping centers filled with specialty stores.
Rankings for Orland Park in Illinois


Locations Around Orland Park
Map Of Orland Park, IL
Best Places Around Orland Park
Hinsdale, IL
Population 17,155
Clarendon Hills, IL
Population 8,642
Burr Ridge, IL
Population 11,119
Naperville, IL
Population 149,424
Darien, IL
Population 21,855
Lisle, IL
Population 23,413
La Grange, IL
Population 15,999
Western Springs, IL
Population 13,353
Downers Grove, IL
Population 49,867
Tinley Park, IL
Population 55,007
Orland Park Demographics And Statistics
Population over time in Orland Park
The current population in Orland Park is 57,961. The population has increased 5.2% from 2010.
| Year | Population | % Change |
|---|---|---|
| 2023 | 57,961 | -0.7% |
| 2022 | 58,345 | -0.5% |
| 2021 | 58,622 | 0.4% |
| 2020 | 58,380 | -0.6% |
| 2019 | 58,749 | -0.6% |
| 2018 | 59,100 | -0.1% |
| 2017 | 59,161 | 0.9% |
| 2016 | 58,612 | 0.6% |
| 2015 | 58,273 | 0.8% |
| 2014 | 57,802 | 1.1% |
| 2013 | 57,194 | 1.0% |
| 2012 | 56,607 | 1.1% |
| 2011 | 55,985 | 1.6% |
| 2010 | 55,098 | - |
Race / Ethnicity in Orland Park
Orland Park is:
79.4% White with 46,031 White residents.
3.7% African American with 2,159 African American residents.
0.0% American Indian with 0 American Indian residents.
6.0% Asian with 3,489 Asian residents.
0.2% Hawaiian with 90 Hawaiian residents.
0.3% Other with 197 Other residents.
1.2% Two Or More with 718 Two Or More residents.
9.1% Hispanic with 5,277 Hispanic residents.
| Race | Orland Park | IL | USA |
|---|---|---|---|
| White | 79.4% | 58.7% | 58.2% |
| African American | 3.7% | 13.6% | 12.0% |
| American Indian | 0.0% | 0.1% | 0.5% |
| Asian | 6.0% | 5.8% | 5.7% |
| Hawaiian | 0.2% | 0.0% | 0.2% |
| Other | 0.3% | 0.3% | 0.5% |
| Two Or More | 1.2% | 3.0% | 3.9% |
| Hispanic | 9.1% | 18.5% | 19.0% |
Gender in Orland Park
Orland Park is 50.0% female with 28,959 female residents.
Orland Park is 50.0% male with 29,001 male residents.
| Gender | Orland Park | IL | USA |
|---|---|---|---|
| Female | 50.0% | 50.6% | 50.5% |
| Male | 50.0% | 49.4% | 49.5% |
Highest level of educational attainment in Orland Park for adults over 25
3.0% of adults in Orland Park completed < 9th grade.
3.0% of adults in Orland Park completed 9-12th grade.
21.0% of adults in Orland Park completed high school / ged.
18.0% of adults in Orland Park completed some college.
10.0% of adults in Orland Park completed associate's degree.
27.0% of adults in Orland Park completed bachelor's degree.
13.0% of adults in Orland Park completed master's degree.
3.0% of adults in Orland Park completed professional degree.
2.0% of adults in Orland Park completed doctorate degree.
| Education | Orland Park | IL | USA |
|---|---|---|---|
| < 9th Grade | 3.0% | 5.0% | 5.0% |
| 9-12th Grade | 3.0% | 5.0% | 6.0% |
| High School / GED | 21.0% | 25.0% | 26.0% |
| Some College | 18.0% | 20.0% | 19.0% |
| Associate's Degree | 10.0% | 8.0% | 9.0% |
| Bachelor's Degree | 27.0% | 22.0% | 21.0% |
| Master's Degree | 13.0% | 11.0% | 10.0% |
| Professional Degree | 3.0% | 2.0% | 2.0% |
| Doctorate Degree | 2.0% | 2.0% | 2.0% |
Household Income For Orland Park, Illinois
2.7% of households in Orland Park earn Less than $10,000.
1.7% of households in Orland Park earn $10,000 to $14,999.
5.0% of households in Orland Park earn $15,000 to $24,999.
7.0% of households in Orland Park earn $25,000 to $34,999.
9.5% of households in Orland Park earn $35,000 to $49,999.
12.5% of households in Orland Park earn $50,000 to $74,999.
12.3% of households in Orland Park earn $75,000 to $99,999.
20.7% of households in Orland Park earn $100,000 to $149,999.
11.5% of households in Orland Park earn $150,000 to $199,999.
17.2% of households in Orland Park earn $200,000 or more.
| Income | Orland Park | IL | USA |
|---|---|---|---|
| Less than $10,000 | 2.7% | 5.2% | 4.9% |
| $10,000 to $14,999 | 1.7% | 3.4% | 3.6% |
| $15,000 to $24,999 | 5.0% | 6.2% | 6.6% |
| $25,000 to $34,999 | 7.0% | 6.5% | 6.8% |
| $35,000 to $49,999 | 9.5% | 9.9% | 10.4% |
| $50,000 to $74,999 | 12.5% | 15.1% | 15.7% |
| $75,000 to $99,999 | 12.3% | 12.7% | 12.7% |
| $100,000 to $149,999 | 20.7% | 17.9% | 17.4% |
| $150,000 to $199,999 | 11.5% | 9.9% | 9.3% |
| $200,000 or more | 17.2% | 13.1% | 12.6% |


