Oswego, IL
Demographics And Statistics
Living In Oswego, Illinois Summary
Life in Oswego research summary. HomeSnacks has been using Saturday Night Science to research the quality of life in Oswego over the past nine years using Census, FBI, Zillow, and other primary data sources. Based on the most recently available data, we found the following about life in Oswego:
The population in Oswego is 35,463.
The median home value in Oswego is $412,547.
The median income in Oswego is $119,881.
The cost of living in Oswego is 115 which is 1.1x higher than the national average.
The median rent in Oswego is $1,823.
The unemployment rate in Oswego is 2.7%.
The poverty rate in Oswego is 2.3%.
The average high in Oswego is 59.3° and the average low is 39.1°.
Oswego SnackAbility
Overall SnackAbility
Oswego, IL Crime Report
Crime in Oswego summary. We use data from the FBI to determine the crime rates in Oswego. Key points include:
There were 222 total crimes in Oswego in the last reporting year.
The overall crime rate per 100,000 people in Oswego is 585.9 / 100k people.
The violent crime rate per 100,000 people in Oswego is 34.3 / 100k people.
The property crime rate per 100,000 people in Oswego is 551.6 / 100k people.
Overall, crime in Oswego is -72.36% below the national average.
Total Crimes
Below National Average
Crime In Oswego Comparison Table
| Statistic | Count Raw |
Oswego / 100k People |
Illinois / 100k People |
National / 100k People |
|---|---|---|---|---|
| Total Crimes Per 100K | 222 | 585.9 | 2,004.4 | 2,119.2 |
| Violent Crime | 13 | 34.3 | 289.2 | 359.0 |
| Murder | 0 | 0.0 | 5.8 | 5.0 |
| Robbery | 0 | 0.0 | 90.2 | 61.0 |
| Aggravated Assault | 2 | 5.3 | 146.3 | 256.0 |
| Property Crime | 209 | 551.6 | 1,715.2 | 1,760.0 |
| Burglary | 33 | 87.1 | 290.5 | 229.0 |
| Larceny | 160 | 422.2 | 1,134.4 | 1,272.0 |
| Car Theft | 16 | 42.2 | 290.4 | 259.0 |
Oswego, IL Cost Of Living
Cost of living in Oswego summary. We use data on the cost of living to determine how expensive it is to live in Oswego. Real estate prices drive most of the variance in cost of living around Illinois. Key points include:
The cost of living in Oswego is 115 with 100 being average.
The cost of living in Oswego is 1.1x higher than the national average.
The median home value in Oswego is $412,547.
The median income in Oswego is $119,881.
Oswego's Overall Cost Of Living
Higher Than The National Average
Cost Of Living In Oswego Comparison Table
| Living Expense | Oswego | Illinois | National Average | |
|---|---|---|---|---|
| Overall | 115 | 97 | 100 | |
| Services | 107 | 95 | 100 | |
| Groceries | 98 | 99 | 100 | |
| Health | 99 | 93 | 100 | |
| Housing | 145 | 95 | 100 | |
| Transportation | 115 | 102 | 100 | |
| Utilities | 78 | 91 | 100 | |
Oswego, IL Weather
The average high in Oswego is 59.3° and the average low is 39.1°.
There are 72.3 days of precipitation each year.
Expect an average of 36.4 inches of precipitation each year with 26.4 inches of snow.
| Stat | Oswego |
|---|---|
| Average Annual High | 59.3 |
| Average Annual Low | 39.1 |
| Annual Precipitation Days | 72.3 |
| Average Annual Precipitation | 36.4 |
| Average Annual Snowfall | 26.4 |
Average High
Days of Rain
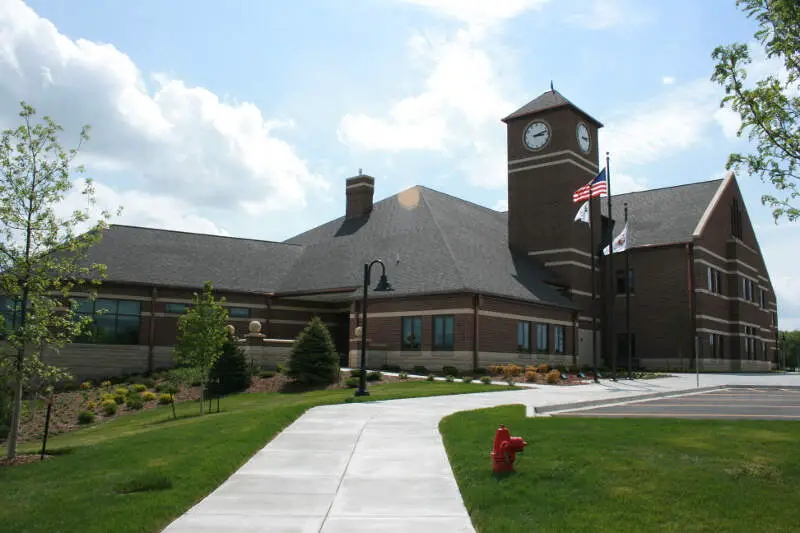
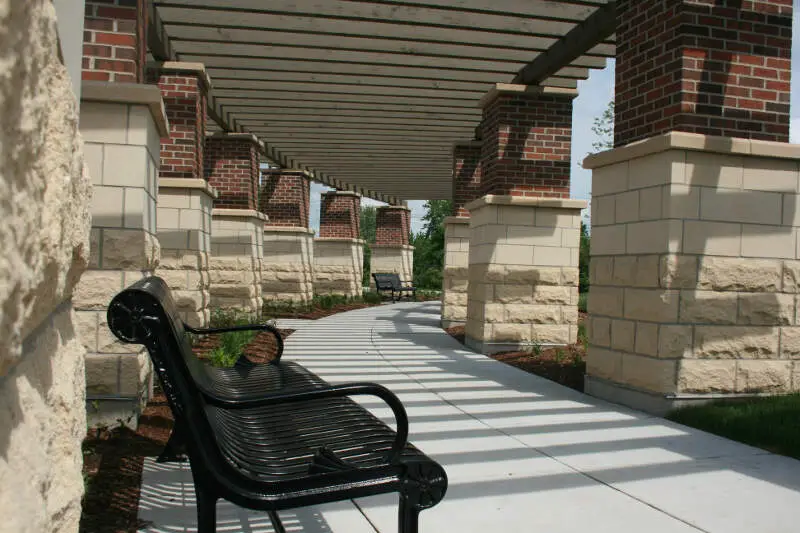
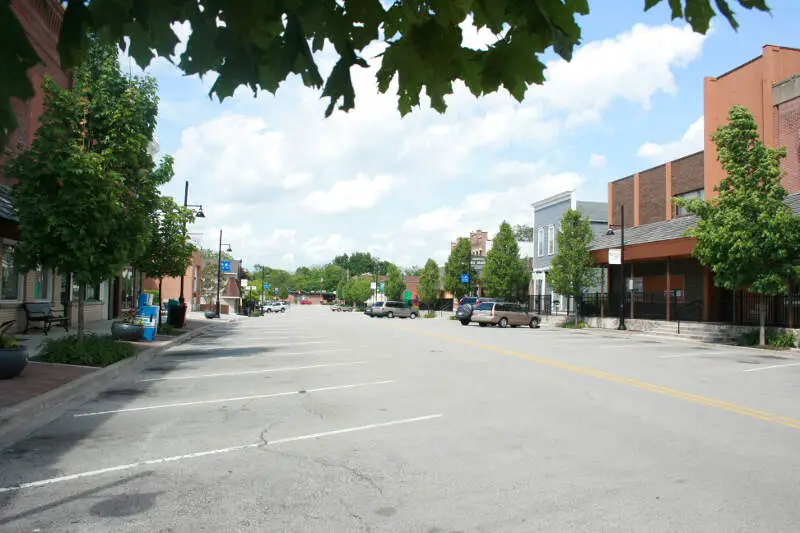
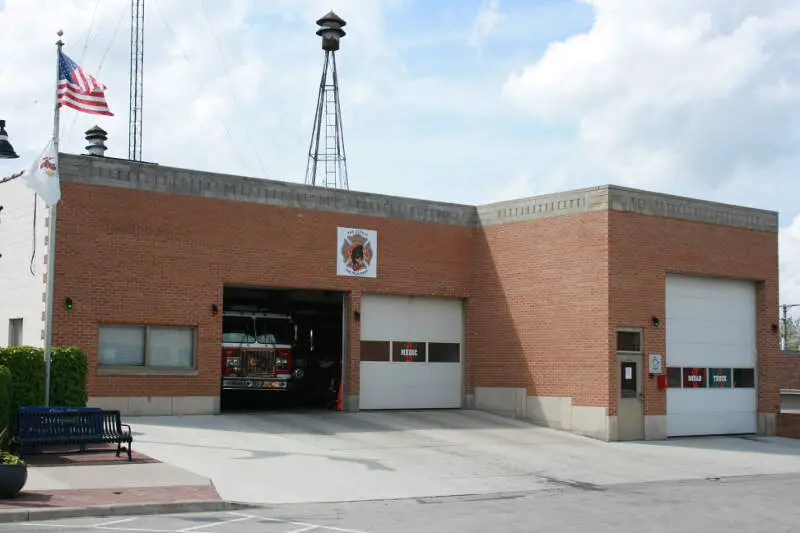
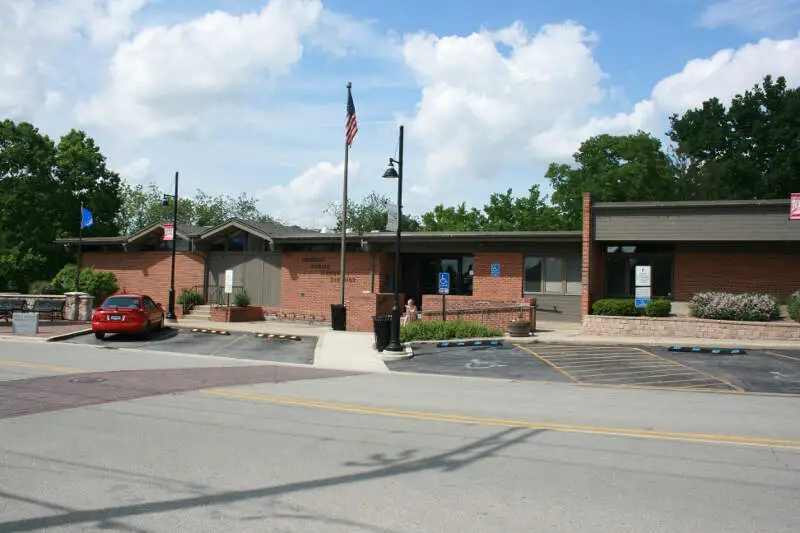
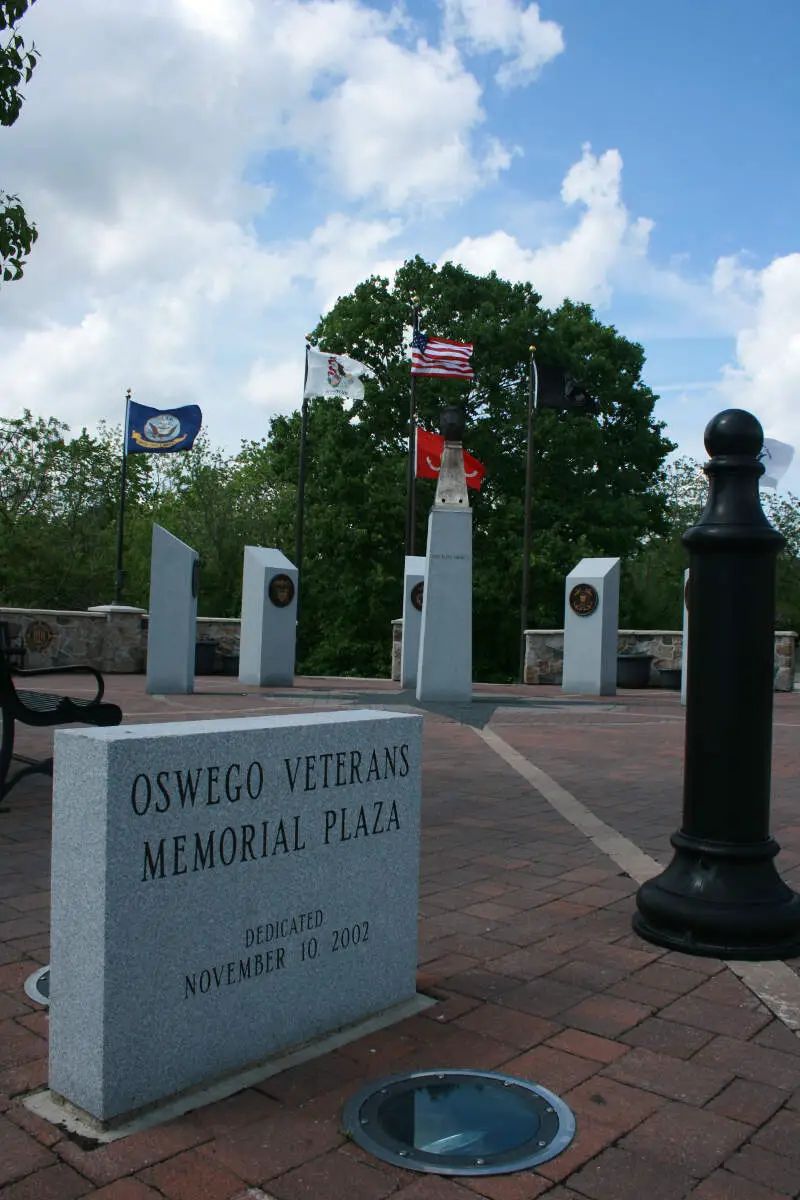
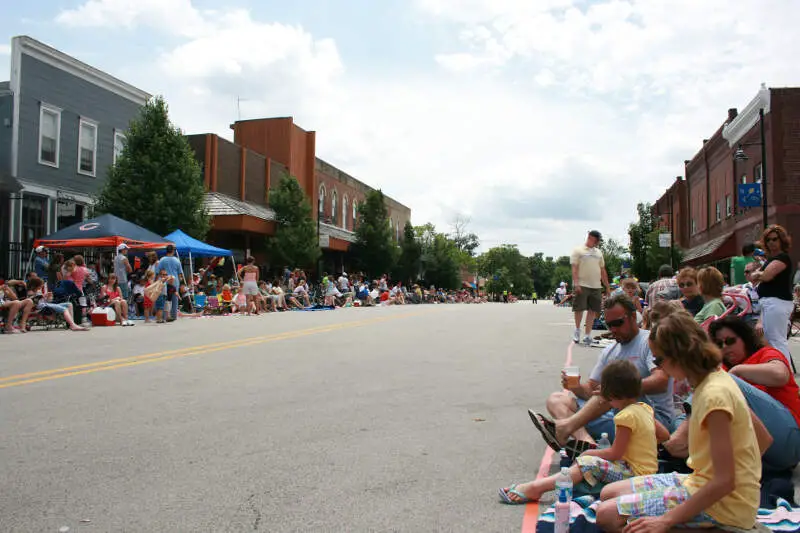
Oswego, IL Photos


Rankings for Oswego in Illinois


Locations Around Oswego
Map Of Oswego, IL
Best Places Around Oswego
Winfield, IL
Population 9,982
Glen Ellyn, IL
Population 28,270
Wheaton, IL
Population 53,453
Naperville, IL
Population 149,424
Darien, IL
Population 21,855
Lisle, IL
Population 23,413
Carol Stream, IL
Population 39,427
Downers Grove, IL
Population 49,867
Woodridge, IL
Population 33,889
Lemont, IL
Population 17,643
Oswego Demographics And Statistics
Population over time in Oswego
The current population in Oswego is 35,463. The population has increased 27.9% from 2010.
| Year | Population | % Change |
|---|---|---|
| 2023 | 35,463 | 1.9% |
| 2022 | 34,810 | 1.4% |
| 2021 | 34,324 | -3.2% |
| 2020 | 35,470 | 1.5% |
| 2019 | 34,933 | 1.6% |
| 2018 | 34,383 | 1.8% |
| 2017 | 33,759 | 1.5% |
| 2016 | 33,245 | 2.4% |
| 2015 | 32,468 | 2.3% |
| 2014 | 31,723 | 2.2% |
| 2013 | 31,036 | 2.4% |
| 2012 | 30,302 | 3.9% |
| 2011 | 29,174 | 5.2% |
| 2010 | 27,719 | - |
Race / Ethnicity in Oswego
Oswego is:
63.0% White with 22,329 White residents.
11.8% African American with 4,171 African American residents.
0.0% American Indian with 10 American Indian residents.
4.4% Asian with 1,546 Asian residents.
0.0% Hawaiian with 0 Hawaiian residents.
0.0% Other with 17 Other residents.
4.4% Two Or More with 1,559 Two Or More residents.
16.4% Hispanic with 5,831 Hispanic residents.
| Race | Oswego | IL | USA |
|---|---|---|---|
| White | 63.0% | 58.7% | 58.2% |
| African American | 11.8% | 13.6% | 12.0% |
| American Indian | 0.0% | 0.1% | 0.5% |
| Asian | 4.4% | 5.8% | 5.7% |
| Hawaiian | 0.0% | 0.0% | 0.2% |
| Other | 0.0% | 0.3% | 0.5% |
| Two Or More | 4.4% | 3.0% | 3.9% |
| Hispanic | 16.4% | 18.5% | 19.0% |
Gender in Oswego
Oswego is 51.6% female with 18,295 female residents.
Oswego is 48.4% male with 17,168 male residents.
| Gender | Oswego | IL | USA |
|---|---|---|---|
| Female | 51.6% | 50.6% | 50.5% |
| Male | 48.4% | 49.4% | 49.5% |
Highest level of educational attainment in Oswego for adults over 25
3.0% of adults in Oswego completed < 9th grade.
2.0% of adults in Oswego completed 9-12th grade.
20.0% of adults in Oswego completed high school / ged.
20.0% of adults in Oswego completed some college.
11.0% of adults in Oswego completed associate's degree.
26.0% of adults in Oswego completed bachelor's degree.
15.0% of adults in Oswego completed master's degree.
1.0% of adults in Oswego completed professional degree.
2.0% of adults in Oswego completed doctorate degree.
| Education | Oswego | IL | USA |
|---|---|---|---|
| < 9th Grade | 3.0% | 5.0% | 5.0% |
| 9-12th Grade | 2.0% | 5.0% | 6.0% |
| High School / GED | 20.0% | 25.0% | 26.0% |
| Some College | 20.0% | 20.0% | 19.0% |
| Associate's Degree | 11.0% | 8.0% | 9.0% |
| Bachelor's Degree | 26.0% | 22.0% | 21.0% |
| Master's Degree | 15.0% | 11.0% | 10.0% |
| Professional Degree | 1.0% | 2.0% | 2.0% |
| Doctorate Degree | 2.0% | 2.0% | 2.0% |
Household Income For Oswego, Illinois
2.4% of households in Oswego earn Less than $10,000.
0.7% of households in Oswego earn $10,000 to $14,999.
1.5% of households in Oswego earn $15,000 to $24,999.
2.4% of households in Oswego earn $25,000 to $34,999.
6.1% of households in Oswego earn $35,000 to $49,999.
15.0% of households in Oswego earn $50,000 to $74,999.
12.5% of households in Oswego earn $75,000 to $99,999.
25.1% of households in Oswego earn $100,000 to $149,999.
15.9% of households in Oswego earn $150,000 to $199,999.
18.6% of households in Oswego earn $200,000 or more.
| Income | Oswego | IL | USA |
|---|---|---|---|
| Less than $10,000 | 2.4% | 5.2% | 4.9% |
| $10,000 to $14,999 | 0.7% | 3.4% | 3.6% |
| $15,000 to $24,999 | 1.5% | 6.2% | 6.6% |
| $25,000 to $34,999 | 2.4% | 6.5% | 6.8% |
| $35,000 to $49,999 | 6.1% | 9.9% | 10.4% |
| $50,000 to $74,999 | 15.0% | 15.1% | 15.7% |
| $75,000 to $99,999 | 12.5% | 12.7% | 12.7% |
| $100,000 to $149,999 | 25.1% | 17.9% | 17.4% |
| $150,000 to $199,999 | 15.9% | 9.9% | 9.3% |
| $200,000 or more | 18.6% | 13.1% | 12.6% |


