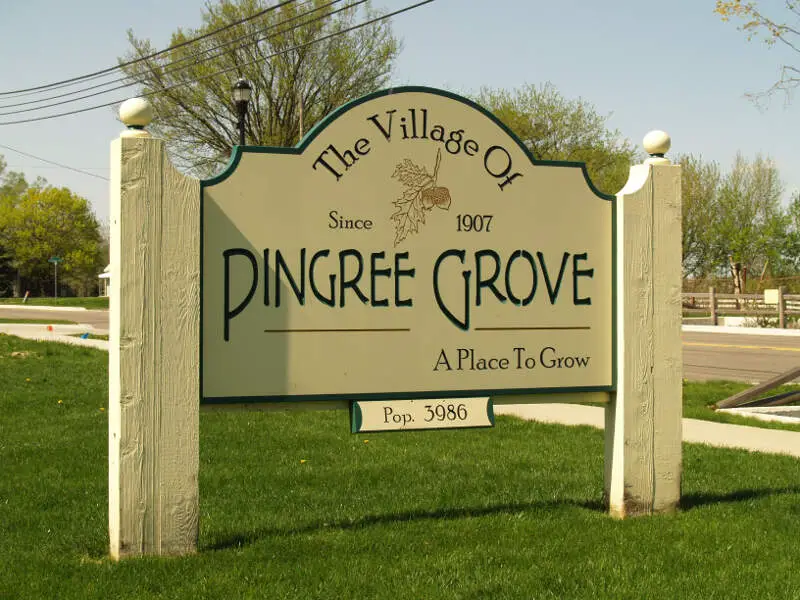
Pingree Grove, IL
Demographics And Statistics
Living In Pingree Grove, Illinois Summary
Life in Pingree Grove research summary. HomeSnacks has been using Saturday Night Science to research the quality of life in Pingree Grove over the past nine years using Census, FBI, Zillow, and other primary data sources. Based on the most recently available data, we found the following about life in Pingree Grove:
The population in Pingree Grove is 10,576.
The median home value in Pingree Grove is $367,794.
The median income in Pingree Grove is $119,880.
The cost of living in Pingree Grove is 110 which is 1.1x higher than the national average.
The median rent in Pingree Grove is $1,219.
The unemployment rate in Pingree Grove is 3.9%.
The poverty rate in Pingree Grove is 0.9%.
The average high in Pingree Grove is 58.6° and the average low is 38.5°.
Pingree Grove SnackAbility
Overall SnackAbility
Pingree Grove, IL Crime Report
Crime in Pingree Grove summary. We use data from the FBI to determine the crime rates in Pingree Grove. Key points include:
There were 19 total crimes in Pingree Grove in the last reporting year.
The overall crime rate per 100,000 people in Pingree Grove is 166.7 / 100k people.
The violent crime rate per 100,000 people in Pingree Grove is 8.8 / 100k people.
The property crime rate per 100,000 people in Pingree Grove is 158.0 / 100k people.
Overall, crime in Pingree Grove is -92.13% below the national average.
Total Crimes
Below National Average
Crime In Pingree Grove Comparison Table
| Statistic | Count Raw |
Pingree Grove / 100k People |
Illinois / 100k People |
National / 100k People |
|---|---|---|---|---|
| Total Crimes Per 100K | 19 | 166.7 | 2,004.4 | 2,119.2 |
| Violent Crime | 1 | 8.8 | 289.2 | 359.0 |
| Murder | 0 | 0.0 | 5.8 | 5.0 |
| Robbery | 0 | 0.0 | 90.2 | 61.0 |
| Aggravated Assault | 1 | 8.8 | 146.3 | 256.0 |
| Property Crime | 18 | 158.0 | 1,715.2 | 1,760.0 |
| Burglary | 0 | 0.0 | 290.5 | 229.0 |
| Larceny | 18 | 158.0 | 1,134.4 | 1,272.0 |
| Car Theft | 0 | 0.0 | 290.4 | 259.0 |
Pingree Grove, IL Cost Of Living
Cost of living in Pingree Grove summary. We use data on the cost of living to determine how expensive it is to live in Pingree Grove. Real estate prices drive most of the variance in cost of living around Illinois. Key points include:
The cost of living in Pingree Grove is 110 with 100 being average.
The cost of living in Pingree Grove is 1.1x higher than the national average.
The median home value in Pingree Grove is $367,794.
The median income in Pingree Grove is $119,880.
Pingree Grove's Overall Cost Of Living
Higher Than The National Average
Cost Of Living In Pingree Grove Comparison Table
| Living Expense | Pingree Grove | Illinois | National Average | |
|---|---|---|---|---|
| Overall | 110 | 97 | 100 | |
| Services | 88 | 95 | 100 | |
| Groceries | 96 | 99 | 100 | |
| Health | 100 | 93 | 100 | |
| Housing | 151 | 95 | 100 | |
| Transportation | 111 | 102 | 100 | |
| Utilities | 85 | 91 | 100 | |
Pingree Grove, IL Weather
The average high in Pingree Grove is 58.6° and the average low is 38.5°.
There are 70.7 days of precipitation each year.
Expect an average of 35.9 inches of precipitation each year with 30.0 inches of snow.
| Stat | Pingree Grove |
|---|---|
| Average Annual High | 58.6 |
| Average Annual Low | 38.5 |
| Annual Precipitation Days | 70.7 |
| Average Annual Precipitation | 35.9 |
| Average Annual Snowfall | 30.0 |
Average High
Days of Rain
Pingree Grove, IL Photos
Rankings for Pingree Grove in Illinois


Locations Around Pingree Grove
Map Of Pingree Grove, IL
Best Places Around Pingree Grove
Lake Zurich, IL
Population 19,727
Bartlett, IL
Population 40,531
Hoffman Estates, IL
Population 51,186
Carol Stream, IL
Population 39,427
Roselle, IL
Population 22,731
Inverness, IL
Population 7,541
Barrington, IL
Population 11,049
Schaumburg, IL
Population 76,780
Cary, IL
Population 17,875
Geneva, IL
Population 21,299
Pingree Grove Demographics And Statistics
Population over time in Pingree Grove
The current population in Pingree Grove is 10,576. The population has increased 179.8% from 2010.
| Year | Population | % Change |
|---|---|---|
| 2023 | 10,576 | 3.6% |
| 2022 | 10,213 | 4.9% |
| 2021 | 9,734 | 11.0% |
| 2020 | 8,768 | 8.2% |
| 2019 | 8,107 | 10.5% |
| 2018 | 7,337 | 10.1% |
| 2017 | 6,661 | 11.3% |
| 2016 | 5,983 | 9.6% |
| 2015 | 5,460 | 7.9% |
| 2014 | 5,062 | 7.1% |
| 2013 | 4,725 | 6.8% |
| 2012 | 4,425 | 8.3% |
| 2011 | 4,085 | 8.1% |
| 2010 | 3,780 | - |
Race / Ethnicity in Pingree Grove
Pingree Grove is:
59.3% White with 6,267 White residents.
10.5% African American with 1,108 African American residents.
0.0% American Indian with 0 American Indian residents.
6.6% Asian with 696 Asian residents.
0.0% Hawaiian with 0 Hawaiian residents.
0.8% Other with 87 Other residents.
4.6% Two Or More with 488 Two Or More residents.
18.2% Hispanic with 1,930 Hispanic residents.
| Race | Pingree Grove | IL | USA |
|---|---|---|---|
| White | 59.3% | 58.7% | 58.2% |
| African American | 10.5% | 13.6% | 12.0% |
| American Indian | 0.0% | 0.1% | 0.5% |
| Asian | 6.6% | 5.8% | 5.7% |
| Hawaiian | 0.0% | 0.0% | 0.2% |
| Other | 0.8% | 0.3% | 0.5% |
| Two Or More | 4.6% | 3.0% | 3.9% |
| Hispanic | 18.2% | 18.5% | 19.0% |
Gender in Pingree Grove
Pingree Grove is 46.1% female with 4,872 female residents.
Pingree Grove is 53.9% male with 5,703 male residents.
| Gender | Pingree Grove | IL | USA |
|---|---|---|---|
| Female | 46.1% | 50.6% | 50.5% |
| Male | 53.9% | 49.4% | 49.5% |
Highest level of educational attainment in Pingree Grove for adults over 25
0.0% of adults in Pingree Grove completed < 9th grade.
1.0% of adults in Pingree Grove completed 9-12th grade.
23.0% of adults in Pingree Grove completed high school / ged.
22.0% of adults in Pingree Grove completed some college.
9.0% of adults in Pingree Grove completed associate's degree.
35.0% of adults in Pingree Grove completed bachelor's degree.
8.0% of adults in Pingree Grove completed master's degree.
1.0% of adults in Pingree Grove completed professional degree.
1.0% of adults in Pingree Grove completed doctorate degree.
| Education | Pingree Grove | IL | USA |
|---|---|---|---|
| < 9th Grade | 0.0% | 5.0% | 5.0% |
| 9-12th Grade | 1.0% | 5.0% | 6.0% |
| High School / GED | 23.0% | 25.0% | 26.0% |
| Some College | 22.0% | 20.0% | 19.0% |
| Associate's Degree | 9.0% | 8.0% | 9.0% |
| Bachelor's Degree | 35.0% | 22.0% | 21.0% |
| Master's Degree | 8.0% | 11.0% | 10.0% |
| Professional Degree | 1.0% | 2.0% | 2.0% |
| Doctorate Degree | 1.0% | 2.0% | 2.0% |
Household Income For Pingree Grove, Illinois
0.4% of households in Pingree Grove earn Less than $10,000.
0.0% of households in Pingree Grove earn $10,000 to $14,999.
1.6% of households in Pingree Grove earn $15,000 to $24,999.
4.6% of households in Pingree Grove earn $25,000 to $34,999.
3.2% of households in Pingree Grove earn $35,000 to $49,999.
10.0% of households in Pingree Grove earn $50,000 to $74,999.
19.3% of households in Pingree Grove earn $75,000 to $99,999.
30.8% of households in Pingree Grove earn $100,000 to $149,999.
11.8% of households in Pingree Grove earn $150,000 to $199,999.
18.4% of households in Pingree Grove earn $200,000 or more.
| Income | Pingree Grove | IL | USA |
|---|---|---|---|
| Less than $10,000 | 0.4% | 5.2% | 4.9% |
| $10,000 to $14,999 | 0.0% | 3.4% | 3.6% |
| $15,000 to $24,999 | 1.6% | 6.2% | 6.6% |
| $25,000 to $34,999 | 4.6% | 6.5% | 6.8% |
| $35,000 to $49,999 | 3.2% | 9.9% | 10.4% |
| $50,000 to $74,999 | 10.0% | 15.1% | 15.7% |
| $75,000 to $99,999 | 19.3% | 12.7% | 12.7% |
| $100,000 to $149,999 | 30.8% | 17.9% | 17.4% |
| $150,000 to $199,999 | 11.8% | 9.9% | 9.3% |
| $200,000 or more | 18.4% | 13.1% | 12.6% |


