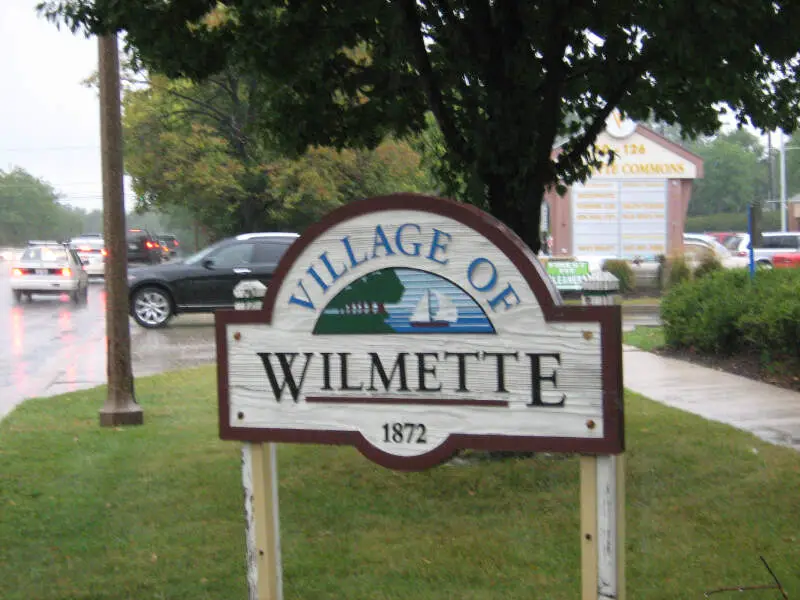
Wilmette, IL
Demographics And Statistics
Living In Wilmette, Illinois Summary
Life in Wilmette research summary. HomeSnacks has been using Saturday Night Science to research the quality of life in Wilmette over the past nine years using Census, FBI, Zillow, and other primary data sources. Based on the most recently available data, we found the following about life in Wilmette:
The population in Wilmette is 27,550.
The median home value in Wilmette is $912,155.
The median income in Wilmette is $192,300.
The cost of living in Wilmette is 164 which is 1.6x higher than the national average.
The median rent in Wilmette is $1,968.
The unemployment rate in Wilmette is 4.3%.
The poverty rate in Wilmette is 3.4%.
The average high in Wilmette is 58.4° and the average low is 42.6°.
Wilmette SnackAbility
Overall SnackAbility
Wilmette, IL Crime Report
Crime in Wilmette summary. We use data from the FBI to determine the crime rates in Wilmette. Key points include:
There were 323 total crimes in Wilmette in the last reporting year.
The overall crime rate per 100,000 people in Wilmette is 1,210.4 / 100k people.
The violent crime rate per 100,000 people in Wilmette is 22.5 / 100k people.
The property crime rate per 100,000 people in Wilmette is 1,187.9 / 100k people.
Overall, crime in Wilmette is -42.88% below the national average.
Total Crimes
Below National Average
Crime In Wilmette Comparison Table
| Statistic | Count Raw |
Wilmette / 100k People |
Illinois / 100k People |
National / 100k People |
|---|---|---|---|---|
| Total Crimes Per 100K | 323 | 1,210.4 | 2,004.4 | 2,119.2 |
| Violent Crime | 6 | 22.5 | 289.2 | 359.0 |
| Murder | 0 | 0.0 | 5.8 | 5.0 |
| Robbery | 2 | 7.5 | 90.2 | 61.0 |
| Aggravated Assault | 2 | 7.5 | 146.3 | 256.0 |
| Property Crime | 317 | 1,187.9 | 1,715.2 | 1,760.0 |
| Burglary | 92 | 344.8 | 290.5 | 229.0 |
| Larceny | 217 | 813.2 | 1,134.4 | 1,272.0 |
| Car Theft | 8 | 30.0 | 290.4 | 259.0 |
Wilmette, IL Cost Of Living
Cost of living in Wilmette summary. We use data on the cost of living to determine how expensive it is to live in Wilmette. Real estate prices drive most of the variance in cost of living around Illinois. Key points include:
The cost of living in Wilmette is 164 with 100 being average.
The cost of living in Wilmette is 1.6x higher than the national average.
The median home value in Wilmette is $912,155.
The median income in Wilmette is $192,300.
Wilmette's Overall Cost Of Living
Higher Than The National Average
Cost Of Living In Wilmette Comparison Table
| Living Expense | Wilmette | Illinois | National Average | |
|---|---|---|---|---|
| Overall | 164 | 97 | 100 | |
| Services | 106 | 95 | 100 | |
| Groceries | 103 | 99 | 100 | |
| Health | 109 | 93 | 100 | |
| Housing | 306 | 95 | 100 | |
| Transportation | 106 | 102 | 100 | |
| Utilities | 90 | 91 | 100 | |
Wilmette, IL Weather
The average high in Wilmette is 58.4° and the average low is 42.6°.
There are 72.1 days of precipitation each year.
Expect an average of 37.5 inches of precipitation each year with 35.7 inches of snow.
| Stat | Wilmette |
|---|---|
| Average Annual High | 58.4 |
| Average Annual Low | 42.6 |
| Annual Precipitation Days | 72.1 |
| Average Annual Precipitation | 37.5 |
| Average Annual Snowfall | 35.7 |
Average High
Days of Rain
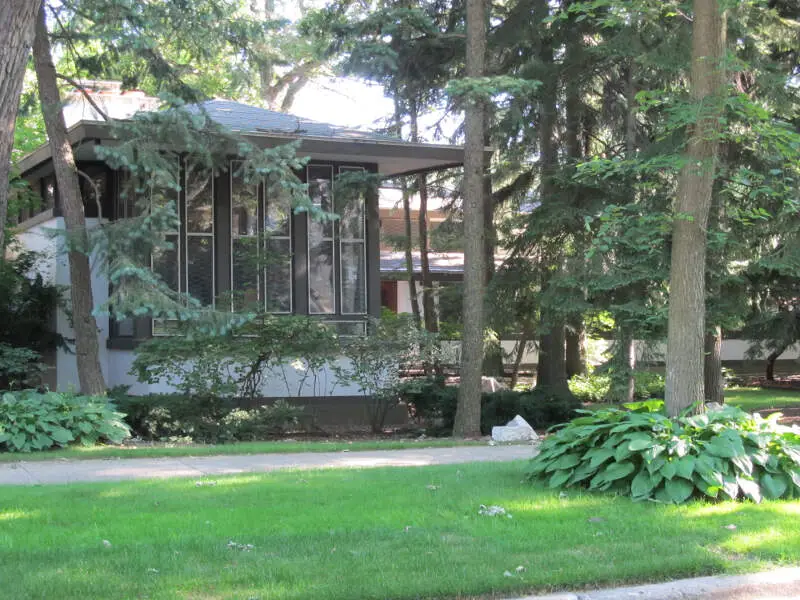
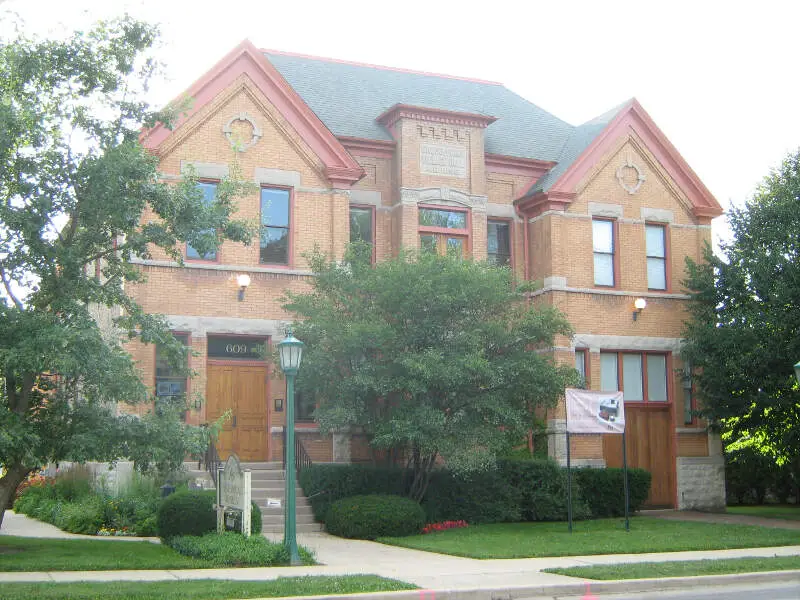
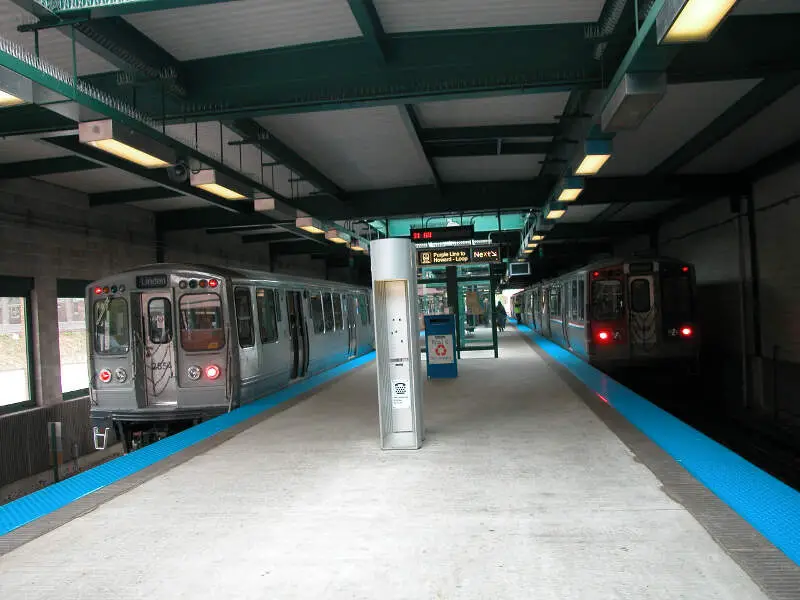
Wilmette, IL Photos
2 Reviews & Comments About Wilmette
/5

HomeSnacks User - 2018-07-15 16:06:18.376074
I love living in Wilmette. People are so friendly and the town is well run offering many activities. It is a same place to live.
I love being close to Lake Michigan Beach and the pool in Wilmette is fantastic.
HomeSnacks User - None
Another thing, consider why these areas are like they are. My family moved to Wilmette for the well known education system.
Rankings for Wilmette in Illinois


Locations Around Wilmette
Map Of Wilmette, IL
Best Places Around Wilmette
Highland Park, IL
Population 30,229
Buffalo Grove, IL
Population 42,824
Deerfield, IL
Population 19,185
Northbrook, IL
Population 34,642
Elmhurst, IL
Population 45,538
Glenview, IL
Population 47,682
Park Ridge, IL
Population 39,241
Lake Bluff, IL
Population 5,834
Arlington Heights, IL
Population 76,220
Winnetka, IL
Population 12,508
Wilmette Demographics And Statistics
Population over time in Wilmette
The current population in Wilmette is 27,550. The population has increased 2.3% from 2010.
| Year | Population | % Change |
|---|---|---|
| 2023 | 27,550 | -0.9% |
| 2022 | 27,801 | -0.3% |
| 2021 | 27,895 | 2.9% |
| 2020 | 27,114 | -0.5% |
| 2019 | 27,247 | -0.6% |
| 2018 | 27,419 | 0.1% |
| 2017 | 27,393 | 0.1% |
| 2016 | 27,367 | -0.2% |
| 2015 | 27,420 | 0.3% |
| 2014 | 27,345 | 0.3% |
| 2013 | 27,268 | 0.2% |
| 2012 | 27,202 | 0.7% |
| 2011 | 27,010 | 0.3% |
| 2010 | 26,928 | - |
Race / Ethnicity in Wilmette
Wilmette is:
78.3% White with 21,571 White residents.
0.3% African American with 81 African American residents.
0.1% American Indian with 20 American Indian residents.
11.8% Asian with 3,257 Asian residents.
0.0% Hawaiian with 0 Hawaiian residents.
0.8% Other with 216 Other residents.
3.7% Two Or More with 1,027 Two Or More residents.
5.0% Hispanic with 1,378 Hispanic residents.
| Race | Wilmette | IL | USA |
|---|---|---|---|
| White | 78.3% | 58.7% | 58.2% |
| African American | 0.3% | 13.6% | 12.0% |
| American Indian | 0.1% | 0.1% | 0.5% |
| Asian | 11.8% | 5.8% | 5.7% |
| Hawaiian | 0.0% | 0.0% | 0.2% |
| Other | 0.8% | 0.3% | 0.5% |
| Two Or More | 3.7% | 3.0% | 3.9% |
| Hispanic | 5.0% | 18.5% | 19.0% |
Gender in Wilmette
Wilmette is 50.9% female with 14,029 female residents.
Wilmette is 49.1% male with 13,520 male residents.
| Gender | Wilmette | IL | USA |
|---|---|---|---|
| Female | 50.9% | 50.6% | 50.5% |
| Male | 49.1% | 49.4% | 49.5% |
Highest level of educational attainment in Wilmette for adults over 25
-0.0% of adults in Wilmette completed < 9th grade.
1.0% of adults in Wilmette completed 9-12th grade.
5.0% of adults in Wilmette completed high school / ged.
7.0% of adults in Wilmette completed some college.
2.0% of adults in Wilmette completed associate's degree.
35.0% of adults in Wilmette completed bachelor's degree.
31.0% of adults in Wilmette completed master's degree.
13.0% of adults in Wilmette completed professional degree.
6.0% of adults in Wilmette completed doctorate degree.
| Education | Wilmette | IL | USA |
|---|---|---|---|
| < 9th Grade | -0.0% | 5.0% | 5.0% |
| 9-12th Grade | 1.0% | 5.0% | 6.0% |
| High School / GED | 5.0% | 25.0% | 26.0% |
| Some College | 7.0% | 20.0% | 19.0% |
| Associate's Degree | 2.0% | 8.0% | 9.0% |
| Bachelor's Degree | 35.0% | 22.0% | 21.0% |
| Master's Degree | 31.0% | 11.0% | 10.0% |
| Professional Degree | 13.0% | 2.0% | 2.0% |
| Doctorate Degree | 6.0% | 2.0% | 2.0% |
Household Income For Wilmette, Illinois
2.3% of households in Wilmette earn Less than $10,000.
1.6% of households in Wilmette earn $10,000 to $14,999.
2.0% of households in Wilmette earn $15,000 to $24,999.
3.0% of households in Wilmette earn $25,000 to $34,999.
4.1% of households in Wilmette earn $35,000 to $49,999.
6.4% of households in Wilmette earn $50,000 to $74,999.
9.8% of households in Wilmette earn $75,000 to $99,999.
12.5% of households in Wilmette earn $100,000 to $149,999.
10.0% of households in Wilmette earn $150,000 to $199,999.
48.4% of households in Wilmette earn $200,000 or more.
| Income | Wilmette | IL | USA |
|---|---|---|---|
| Less than $10,000 | 2.3% | 5.2% | 4.9% |
| $10,000 to $14,999 | 1.6% | 3.4% | 3.6% |
| $15,000 to $24,999 | 2.0% | 6.2% | 6.6% |
| $25,000 to $34,999 | 3.0% | 6.5% | 6.8% |
| $35,000 to $49,999 | 4.1% | 9.9% | 10.4% |
| $50,000 to $74,999 | 6.4% | 15.1% | 15.7% |
| $75,000 to $99,999 | 9.8% | 12.7% | 12.7% |
| $100,000 to $149,999 | 12.5% | 17.9% | 17.4% |
| $150,000 to $199,999 | 10.0% | 9.9% | 9.3% |
| $200,000 or more | 48.4% | 13.1% | 12.6% |


