Brownsburg, IN
Demographics And Statistics
Living In Brownsburg, Indiana Summary
Life in Brownsburg research summary. HomeSnacks has been using Saturday Night Science to research the quality of life in Brownsburg over the past nine years using Census, FBI, Zillow, and other primary data sources. Based on the most recently available data, we found the following about life in Brownsburg:
The population in Brownsburg is 30,310.
The median home value in Brownsburg is $354,039.
The median income in Brownsburg is $105,435.
The cost of living in Brownsburg is 101 which is 1.0x higher than the national average.
The median rent in Brownsburg is $1,405.
The unemployment rate in Brownsburg is 1.5%.
The poverty rate in Brownsburg is 6.4%.
The average high in Brownsburg is 61.8° and the average low is 42.4°.
Brownsburg SnackAbility
Overall SnackAbility
Brownsburg, IN Crime Report
Crime in Brownsburg summary. We use data from the FBI to determine the crime rates in Brownsburg. Key points include:
There were 221 total crimes in Brownsburg in the last reporting year.
The overall crime rate per 100,000 people in Brownsburg is 662.8 / 100k people.
The violent crime rate per 100,000 people in Brownsburg is 63.0 / 100k people.
The property crime rate per 100,000 people in Brownsburg is 599.8 / 100k people.
Overall, crime in Brownsburg is -68.72% below the national average.
Total Crimes
Below National Average
Crime In Brownsburg Comparison Table
| Statistic | Count Raw |
Brownsburg / 100k People |
Indiana / 100k People |
National / 100k People |
|---|---|---|---|---|
| Total Crimes Per 100K | 221 | 662.8 | 1,691.5 | 2,119.2 |
| Violent Crime | 21 | 63.0 | 312.9 | 359.0 |
| Murder | 0 | 0.0 | 5.5 | 5.0 |
| Robbery | 3 | 9.0 | 34.5 | 61.0 |
| Aggravated Assault | 12 | 36.0 | 239.4 | 256.0 |
| Property Crime | 200 | 599.8 | 1,378.6 | 1,760.0 |
| Burglary | 12 | 36.0 | 176.8 | 229.0 |
| Larceny | 156 | 467.9 | 988.8 | 1,272.0 |
| Car Theft | 32 | 96.0 | 213.0 | 259.0 |
Brownsburg, IN Cost Of Living
Cost of living in Brownsburg summary. We use data on the cost of living to determine how expensive it is to live in Brownsburg. Real estate prices drive most of the variance in cost of living around Indiana. Key points include:
The cost of living in Brownsburg is 101 with 100 being average.
The cost of living in Brownsburg is 1.0x higher than the national average.
The median home value in Brownsburg is $354,039.
The median income in Brownsburg is $105,435.
Brownsburg's Overall Cost Of Living
Higher Than The National Average
Cost Of Living In Brownsburg Comparison Table
| Living Expense | Brownsburg | Indiana | National Average | |
|---|---|---|---|---|
| Overall | 101 | 92 | 100 | |
| Services | 96 | 95 | 100 | |
| Groceries | 98 | 97 | 100 | |
| Health | 88 | 94 | 100 | |
| Housing | 117 | 73 | 100 | |
| Transportation | 97 | 94 | 100 | |
| Utilities | 102 | 107 | 100 | |
Brownsburg, IN Weather
The average high in Brownsburg is 61.8° and the average low is 42.4°.
There are 75.5 days of precipitation each year.
Expect an average of 42.1 inches of precipitation each year with 18.7 inches of snow.
| Stat | Brownsburg |
|---|---|
| Average Annual High | 61.8 |
| Average Annual Low | 42.4 |
| Annual Precipitation Days | 75.5 |
| Average Annual Precipitation | 42.1 |
| Average Annual Snowfall | 18.7 |
Average High
Days of Rain
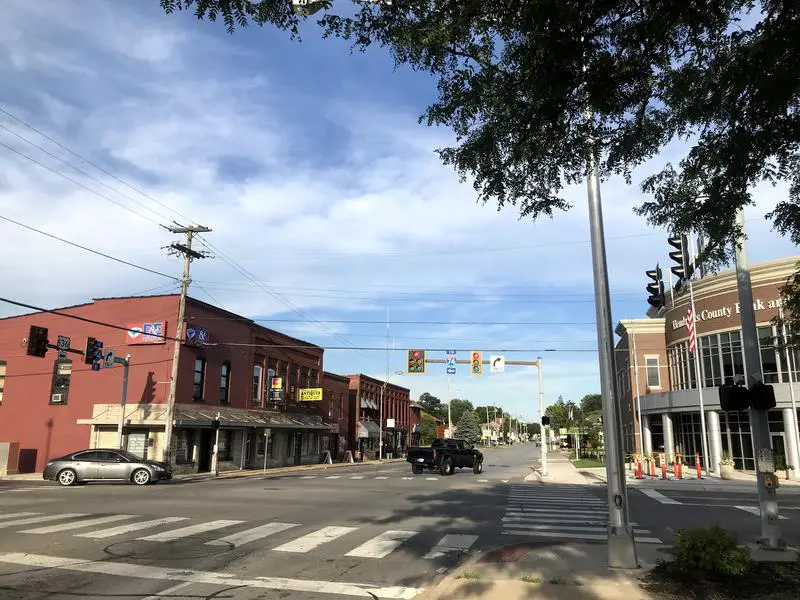
Brownsburg, IN Photos
Rankings for Brownsburg in Indiana


Locations Around Brownsburg
Map Of Brownsburg, IN
Best Places Around Brownsburg
Zionsville, IN
Population 31,442
Carmel, IN
Population 100,501
Westfield, IN
Population 51,109
Danville, IN
Population 11,049
Mooresville, IN
Population 9,608
Indianapolis, IN
Population 882,043
Beech Grove, IN
Population 15,082
Avon, IN
Population 22,683
Brownsburg Demographics And Statistics
Population over time in Brownsburg
The current population in Brownsburg is 30,310. The population has increased 47.3% from 2010.
| Year | Population | % Change |
|---|---|---|
| 2023 | 30,310 | 3.2% |
| 2022 | 29,379 | 3.4% |
| 2021 | 28,420 | 7.0% |
| 2020 | 26,560 | 2.0% |
| 2019 | 26,046 | 3.1% |
| 2018 | 25,264 | 2.6% |
| 2017 | 24,625 | 2.3% |
| 2016 | 24,072 | 2.5% |
| 2015 | 23,484 | 3.8% |
| 2014 | 22,618 | 1.5% |
| 2013 | 22,276 | 2.4% |
| 2012 | 21,749 | 3.0% |
| 2011 | 21,122 | 2.7% |
| 2010 | 20,573 | - |
Race / Ethnicity in Brownsburg
Brownsburg is:
81.5% White with 24,703 White residents.
11.1% African American with 3,365 African American residents.
0.0% American Indian with 0 American Indian residents.
1.0% Asian with 299 Asian residents.
0.0% Hawaiian with 0 Hawaiian residents.
0.2% Other with 71 Other residents.
2.7% Two Or More with 815 Two Or More residents.
3.5% Hispanic with 1,057 Hispanic residents.
| Race | Brownsburg | IN | USA |
|---|---|---|---|
| White | 81.5% | 76.1% | 58.2% |
| African American | 11.1% | 9.1% | 12.0% |
| American Indian | 0.0% | 0.1% | 0.5% |
| Asian | 1.0% | 2.5% | 5.7% |
| Hawaiian | 0.0% | 0.0% | 0.2% |
| Other | 0.2% | 0.4% | 0.5% |
| Two Or More | 2.7% | 3.4% | 3.9% |
| Hispanic | 3.5% | 8.4% | 19.0% |
Gender in Brownsburg
Brownsburg is 50.7% female with 15,357 female residents.
Brownsburg is 49.3% male with 14,952 male residents.
| Gender | Brownsburg | IN | USA |
|---|---|---|---|
| Female | 50.7% | 50.4% | 50.5% |
| Male | 49.3% | 49.6% | 49.5% |
Highest level of educational attainment in Brownsburg for adults over 25
2.0% of adults in Brownsburg completed < 9th grade.
3.0% of adults in Brownsburg completed 9-12th grade.
20.0% of adults in Brownsburg completed high school / ged.
18.0% of adults in Brownsburg completed some college.
10.0% of adults in Brownsburg completed associate's degree.
31.0% of adults in Brownsburg completed bachelor's degree.
13.0% of adults in Brownsburg completed master's degree.
2.0% of adults in Brownsburg completed professional degree.
1.0% of adults in Brownsburg completed doctorate degree.
| Education | Brownsburg | IN | USA |
|---|---|---|---|
| < 9th Grade | 2.0% | 3.0% | 5.0% |
| 9-12th Grade | 3.0% | 6.0% | 6.0% |
| High School / GED | 20.0% | 33.0% | 26.0% |
| Some College | 18.0% | 20.0% | 19.0% |
| Associate's Degree | 10.0% | 9.0% | 9.0% |
| Bachelor's Degree | 31.0% | 18.0% | 21.0% |
| Master's Degree | 13.0% | 8.0% | 10.0% |
| Professional Degree | 2.0% | 2.0% | 2.0% |
| Doctorate Degree | 1.0% | 1.0% | 2.0% |
Household Income For Brownsburg, Indiana
0.9% of households in Brownsburg earn Less than $10,000.
1.6% of households in Brownsburg earn $10,000 to $14,999.
5.8% of households in Brownsburg earn $15,000 to $24,999.
2.8% of households in Brownsburg earn $25,000 to $34,999.
8.2% of households in Brownsburg earn $35,000 to $49,999.
14.4% of households in Brownsburg earn $50,000 to $74,999.
13.2% of households in Brownsburg earn $75,000 to $99,999.
25.8% of households in Brownsburg earn $100,000 to $149,999.
12.5% of households in Brownsburg earn $150,000 to $199,999.
14.9% of households in Brownsburg earn $200,000 or more.
| Income | Brownsburg | IN | USA |
|---|---|---|---|
| Less than $10,000 | 0.9% | 4.9% | 4.9% |
| $10,000 to $14,999 | 1.6% | 3.5% | 3.6% |
| $15,000 to $24,999 | 5.8% | 7.1% | 6.6% |
| $25,000 to $34,999 | 2.8% | 7.8% | 6.8% |
| $35,000 to $49,999 | 8.2% | 12.2% | 10.4% |
| $50,000 to $74,999 | 14.4% | 17.9% | 15.7% |
| $75,000 to $99,999 | 13.2% | 13.9% | 12.7% |
| $100,000 to $149,999 | 25.8% | 17.2% | 17.4% |
| $150,000 to $199,999 | 12.5% | 7.9% | 9.3% |
| $200,000 or more | 14.9% | 7.6% | 12.6% |


