Chesterton, IN
Demographics And Statistics
Living In Chesterton, Indiana Summary
Life in Chesterton research summary. HomeSnacks has been using Saturday Night Science to research the quality of life in Chesterton over the past nine years using Census, FBI, Zillow, and other primary data sources. Based on the most recently available data, we found the following about life in Chesterton:
The population in Chesterton is 14,326.
The median home value in Chesterton is $337,945.
The median income in Chesterton is $88,536.
The cost of living in Chesterton is 107 which is 1.1x higher than the national average.
The median rent in Chesterton is $1,145.
The unemployment rate in Chesterton is 7.8%.
The poverty rate in Chesterton is 10.8%.
The average high in Chesterton is 59.4° and the average low is 40.9°.
Chesterton SnackAbility
Overall SnackAbility
Chesterton, IN Crime Report
Crime in Chesterton summary. We use data from the FBI to determine the crime rates in Chesterton. Key points include:
There were 37 total crimes in Chesterton in the last reporting year.
The overall crime rate per 100,000 people in Chesterton is 251.7 / 100k people.
The violent crime rate per 100,000 people in Chesterton is 34.0 / 100k people.
The property crime rate per 100,000 people in Chesterton is 217.7 / 100k people.
Overall, crime in Chesterton is -88.12% below the national average.
Total Crimes
Below National Average
Crime In Chesterton Comparison Table
| Statistic | Count Raw |
Chesterton / 100k People |
Indiana / 100k People |
National / 100k People |
|---|---|---|---|---|
| Total Crimes Per 100K | 37 | 251.7 | 1,691.5 | 2,119.2 |
| Violent Crime | 5 | 34.0 | 312.9 | 359.0 |
| Murder | 0 | 0.0 | 5.5 | 5.0 |
| Robbery | 0 | 0.0 | 34.5 | 61.0 |
| Aggravated Assault | 5 | 34.0 | 239.4 | 256.0 |
| Property Crime | 32 | 217.7 | 1,378.6 | 1,760.0 |
| Burglary | 4 | 27.2 | 176.8 | 229.0 |
| Larceny | 25 | 170.1 | 988.8 | 1,272.0 |
| Car Theft | 3 | 20.4 | 213.0 | 259.0 |
Chesterton, IN Cost Of Living
Cost of living in Chesterton summary. We use data on the cost of living to determine how expensive it is to live in Chesterton. Real estate prices drive most of the variance in cost of living around Indiana. Key points include:
The cost of living in Chesterton is 107 with 100 being average.
The cost of living in Chesterton is 1.1x higher than the national average.
The median home value in Chesterton is $337,945.
The median income in Chesterton is $88,536.
Chesterton's Overall Cost Of Living
Higher Than The National Average
Cost Of Living In Chesterton Comparison Table
| Living Expense | Chesterton | Indiana | National Average | |
|---|---|---|---|---|
| Overall | 107 | 92 | 100 | |
| Services | 105 | 95 | 100 | |
| Groceries | 104 | 97 | 100 | |
| Health | 110 | 94 | 100 | |
| Housing | 107 | 73 | 100 | |
| Transportation | 105 | 94 | 100 | |
| Utilities | 87 | 107 | 100 | |
Chesterton, IN Weather
The average high in Chesterton is 59.4° and the average low is 40.9°.
There are 75.6 days of precipitation each year.
Expect an average of 39.2 inches of precipitation each year with 36.9 inches of snow.
| Stat | Chesterton |
|---|---|
| Average Annual High | 59.4 |
| Average Annual Low | 40.9 |
| Annual Precipitation Days | 75.6 |
| Average Annual Precipitation | 39.2 |
| Average Annual Snowfall | 36.9 |
Average High
Days of Rain
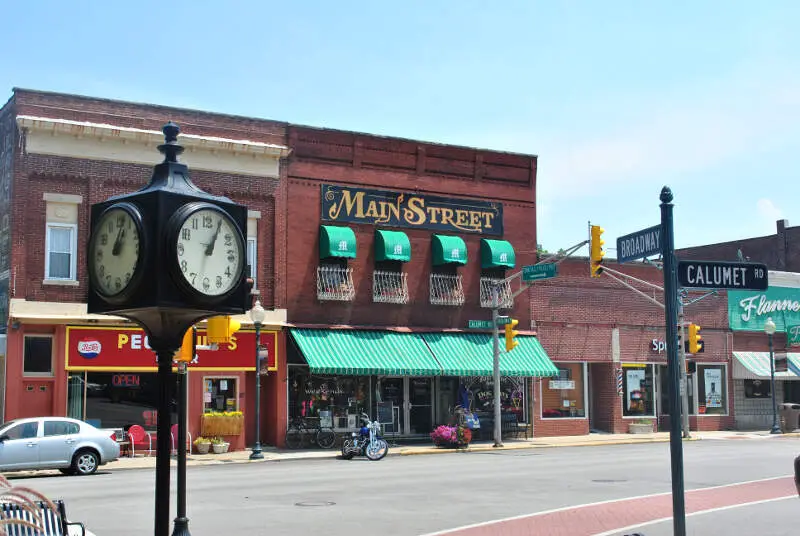
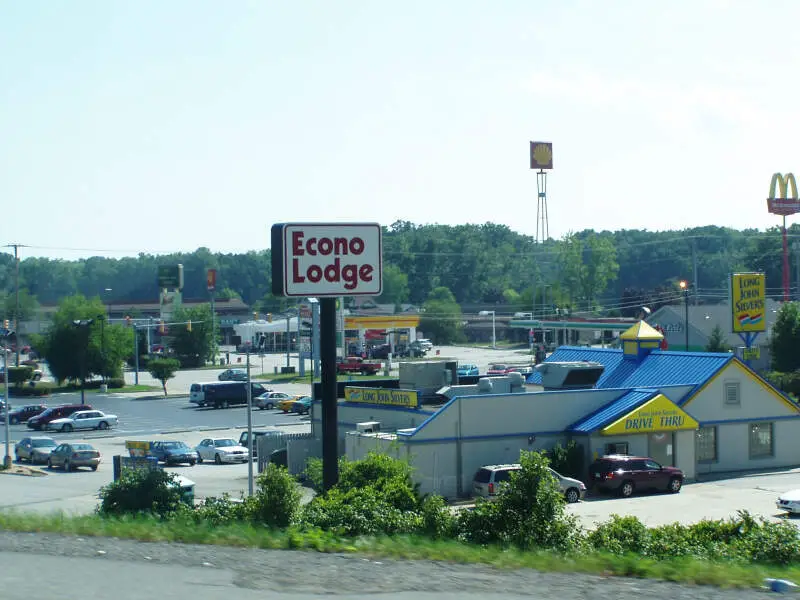
Chesterton, IN Photos
1 Reviews & Comments About Chesterton
/5

HomeSnacks User - None
Except Chesterton and Valparaiso have huge h****n problems. I live in Chesterton.
Rankings for Chesterton in Indiana


Locations Around Chesterton
Map Of Chesterton, IN
Best Places Around Chesterton
Lakes of the Four Seasons, IN
Population 7,338
Westville, IN
Population 5,291
Crown Point, IN
Population 34,042
Valparaiso, IN
Population 34,377
Griffith, IN
Population 16,228
Merrillville, IN
Population 36,343
La Porte, IN
Population 22,125
Hobart, IN
Population 29,646
Lake Station, IN
Population 13,109
Gary, IN
Population 68,604
Chesterton Demographics And Statistics
Population over time in Chesterton
The current population in Chesterton is 14,326. The population has increased 8.9% from 2010.
| Year | Population | % Change |
|---|---|---|
| 2023 | 14,326 | 1.0% |
| 2022 | 14,191 | 1.0% |
| 2021 | 14,045 | 1.2% |
| 2020 | 13,884 | -1.7% |
| 2019 | 14,119 | 1.6% |
| 2018 | 13,899 | -1.1% |
| 2017 | 14,052 | 1.0% |
| 2016 | 13,912 | -1.5% |
| 2015 | 14,124 | 1.7% |
| 2014 | 13,894 | 2.8% |
| 2013 | 13,514 | -0.4% |
| 2012 | 13,571 | 0.3% |
| 2011 | 13,529 | 2.9% |
| 2010 | 13,154 | - |
Race / Ethnicity in Chesterton
Chesterton is:
84.6% White with 12,123 White residents.
1.5% African American with 222 African American residents.
0.0% American Indian with 0 American Indian residents.
1.6% Asian with 229 Asian residents.
0.0% Hawaiian with 0 Hawaiian residents.
0.0% Other with 0 Other residents.
4.2% Two Or More with 607 Two Or More residents.
8.0% Hispanic with 1,145 Hispanic residents.
| Race | Chesterton | IN | USA |
|---|---|---|---|
| White | 84.6% | 76.1% | 58.2% |
| African American | 1.5% | 9.1% | 12.0% |
| American Indian | 0.0% | 0.1% | 0.5% |
| Asian | 1.6% | 2.5% | 5.7% |
| Hawaiian | 0.0% | 0.0% | 0.2% |
| Other | 0.0% | 0.4% | 0.5% |
| Two Or More | 4.2% | 3.4% | 3.9% |
| Hispanic | 8.0% | 8.4% | 19.0% |
Gender in Chesterton
Chesterton is 50.8% female with 7,278 female residents.
Chesterton is 49.2% male with 7,047 male residents.
| Gender | Chesterton | IN | USA |
|---|---|---|---|
| Female | 50.8% | 50.4% | 50.5% |
| Male | 49.2% | 49.6% | 49.5% |
Highest level of educational attainment in Chesterton for adults over 25
1.0% of adults in Chesterton completed < 9th grade.
3.0% of adults in Chesterton completed 9-12th grade.
31.0% of adults in Chesterton completed high school / ged.
19.0% of adults in Chesterton completed some college.
6.0% of adults in Chesterton completed associate's degree.
28.0% of adults in Chesterton completed bachelor's degree.
10.0% of adults in Chesterton completed master's degree.
1.0% of adults in Chesterton completed professional degree.
1.0% of adults in Chesterton completed doctorate degree.
| Education | Chesterton | IN | USA |
|---|---|---|---|
| < 9th Grade | 1.0% | 3.0% | 5.0% |
| 9-12th Grade | 3.0% | 6.0% | 6.0% |
| High School / GED | 31.0% | 33.0% | 26.0% |
| Some College | 19.0% | 20.0% | 19.0% |
| Associate's Degree | 6.0% | 9.0% | 9.0% |
| Bachelor's Degree | 28.0% | 18.0% | 21.0% |
| Master's Degree | 10.0% | 8.0% | 10.0% |
| Professional Degree | 1.0% | 2.0% | 2.0% |
| Doctorate Degree | 1.0% | 1.0% | 2.0% |
Household Income For Chesterton, Indiana
2.9% of households in Chesterton earn Less than $10,000.
2.7% of households in Chesterton earn $10,000 to $14,999.
5.4% of households in Chesterton earn $15,000 to $24,999.
7.2% of households in Chesterton earn $25,000 to $34,999.
7.4% of households in Chesterton earn $35,000 to $49,999.
15.4% of households in Chesterton earn $50,000 to $74,999.
15.6% of households in Chesterton earn $75,000 to $99,999.
18.7% of households in Chesterton earn $100,000 to $149,999.
13.9% of households in Chesterton earn $150,000 to $199,999.
10.7% of households in Chesterton earn $200,000 or more.
| Income | Chesterton | IN | USA |
|---|---|---|---|
| Less than $10,000 | 2.9% | 4.9% | 4.9% |
| $10,000 to $14,999 | 2.7% | 3.5% | 3.6% |
| $15,000 to $24,999 | 5.4% | 7.1% | 6.6% |
| $25,000 to $34,999 | 7.2% | 7.8% | 6.8% |
| $35,000 to $49,999 | 7.4% | 12.2% | 10.4% |
| $50,000 to $74,999 | 15.4% | 17.9% | 15.7% |
| $75,000 to $99,999 | 15.6% | 13.9% | 12.7% |
| $100,000 to $149,999 | 18.7% | 17.2% | 17.4% |
| $150,000 to $199,999 | 13.9% | 7.9% | 9.3% |
| $200,000 or more | 10.7% | 7.6% | 12.6% |


