Manhattan, KS
Demographics And Statistics
Living In Manhattan, Kansas Summary
Life in Manhattan research summary. HomeSnacks has been using Saturday Night Science to research the quality of life in Manhattan over the past nine years using Census, FBI, Zillow, and other primary data sources. Based on the most recently available data, we found the following about life in Manhattan:
The population in Manhattan is 53,951.
The median home value in Manhattan is $284,214.
The median income in Manhattan is $58,441.
The cost of living in Manhattan is 102 which is 1.0x higher than the national average.
The median rent in Manhattan is $1,019.
The unemployment rate in Manhattan is 4.4%.
The poverty rate in Manhattan is 26.1%.
The average high in Manhattan is 66.2° and the average low is 42.9°.
Table Of Contents
Manhattan SnackAbility
Overall SnackAbility
Manhattan, KS Cost Of Living
Cost of living in Manhattan summary. We use data on the cost of living to determine how expensive it is to live in Manhattan. Real estate prices drive most of the variance in cost of living around Kansas. Key points include:
The cost of living in Manhattan is 102 with 100 being average.
The cost of living in Manhattan is 1.0x higher than the national average.
The median home value in Manhattan is $284,214.
The median income in Manhattan is $58,441.
Manhattan's Overall Cost Of Living
Higher Than The National Average
Cost Of Living In Manhattan Comparison Table
| Living Expense | Manhattan | Kansas | National Average | |
|---|---|---|---|---|
| Overall | 102 | 87 | 100 | |
| Services | 94 | 93 | 100 | |
| Groceries | 98 | 98 | 100 | |
| Health | 104 | 98 | 100 | |
| Housing | 112 | 78 | 100 | |
| Transportation | 92 | 88 | 100 | |
| Utilities | 108 | 109 | 100 | |
Manhattan, KS Weather
The average high in Manhattan is 66.2° and the average low is 42.9°.
There are 56.1 days of precipitation each year.
Expect an average of 33.7 inches of precipitation each year with 15.1 inches of snow.
| Stat | Manhattan |
|---|---|
| Average Annual High | 66.2 |
| Average Annual Low | 42.9 |
| Annual Precipitation Days | 56.1 |
| Average Annual Precipitation | 33.7 |
| Average Annual Snowfall | 15.1 |
Average High
Days of Rain
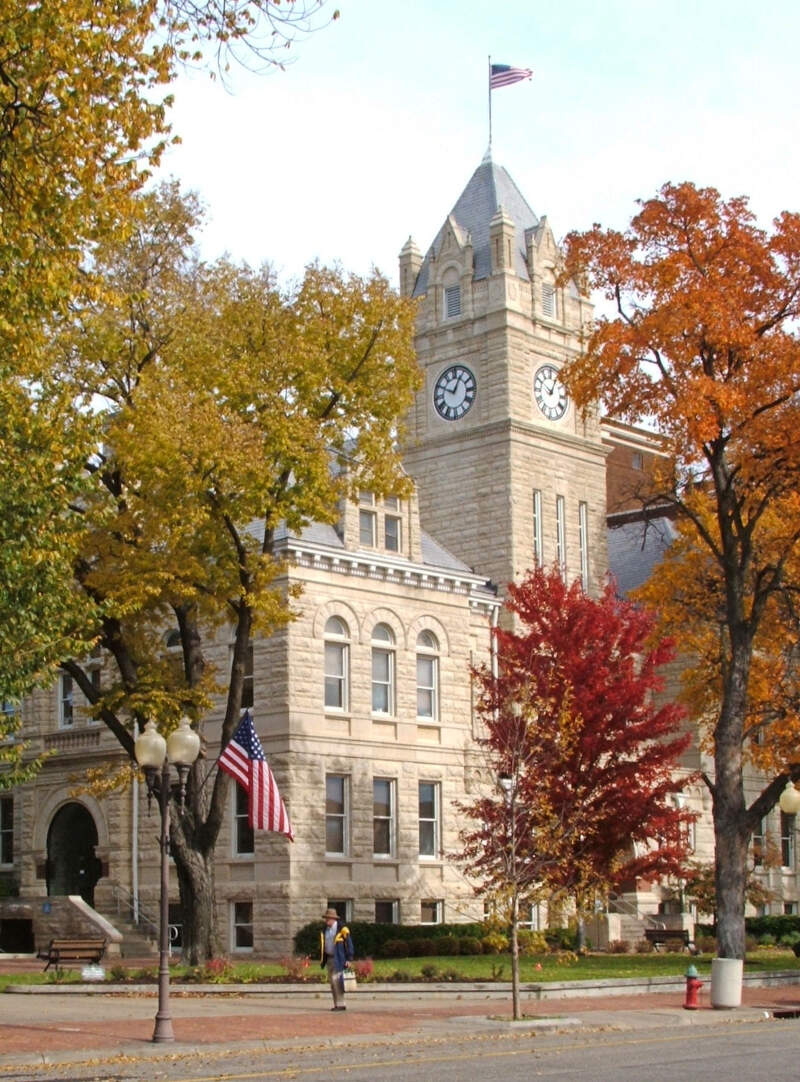
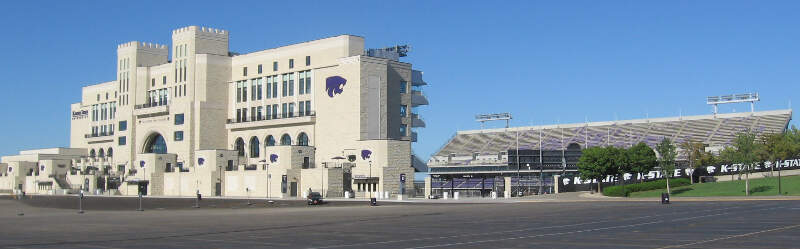
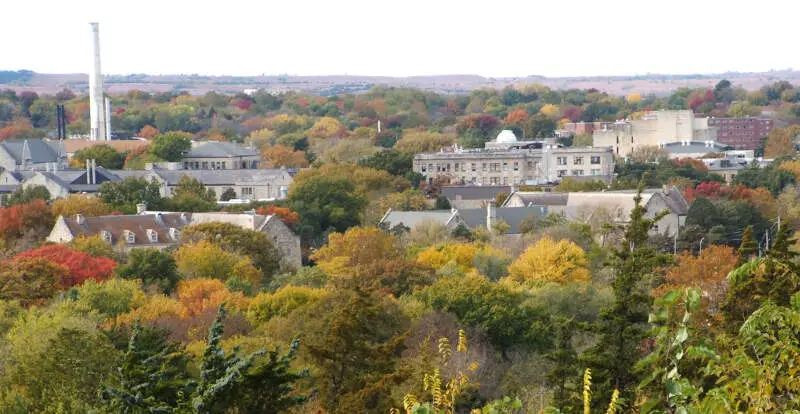
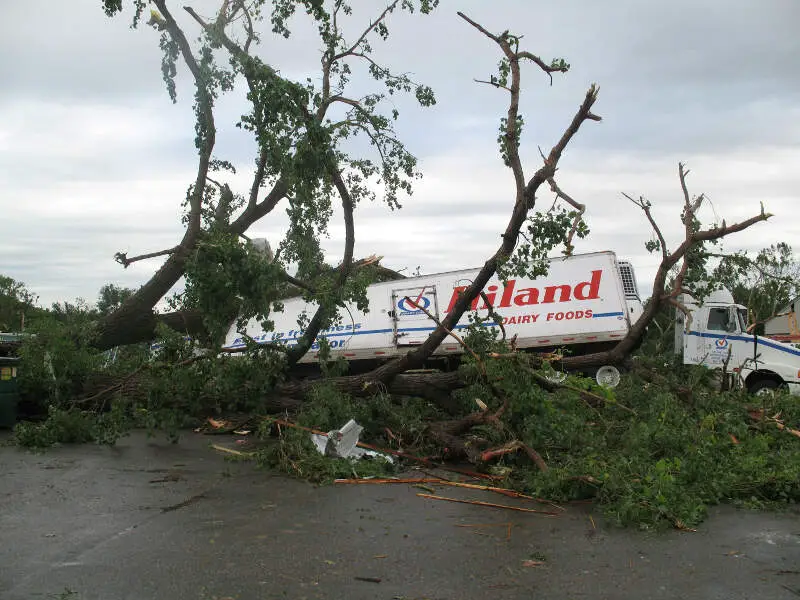
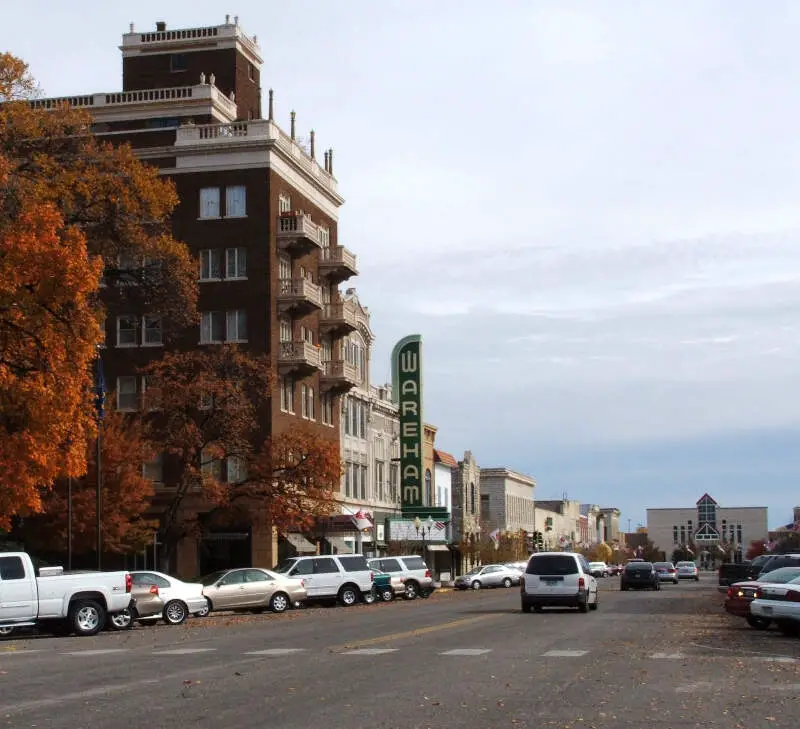
Manhattan, KS Photos


Rankings for Manhattan in Kansas


Locations Around Manhattan
Map Of Manhattan, KS
Best Places Around Manhattan
Marysville, KS
Population 3,423
Clay Center, KS
Population 4,148
Abilene, KS
Population 6,449
Fort Riley, KS
Population 8,595
Topeka, KS
Population 126,103
Wamego, KS
Population 4,205
Manhattan Demographics And Statistics
Population over time in Manhattan
The current population in Manhattan is 53,951. The population has increased 6.6% from 2010.
| Year | Population | % Change |
|---|---|---|
| 2023 | 53,951 | -0.6% |
| 2022 | 54,287 | -0.9% |
| 2021 | 54,794 | -0.5% |
| 2020 | 55,045 | -0.4% |
| 2019 | 55,290 | -0.4% |
| 2018 | 55,489 | 0.1% |
| 2017 | 55,427 | -0.9% |
| 2016 | 55,909 | 0.3% |
| 2015 | 55,769 | 1.2% |
| 2014 | 55,112 | 1.9% |
| 2013 | 54,082 | 2.1% |
| 2012 | 52,988 | 2.8% |
| 2011 | 51,536 | 1.8% |
| 2010 | 50,606 | - |
Race / Ethnicity in Manhattan
Manhattan is:
75.4% White with 40,666 White residents.
4.3% African American with 2,340 African American residents.
0.3% American Indian with 185 American Indian residents.
4.2% Asian with 2,244 Asian residents.
0.4% Hawaiian with 198 Hawaiian residents.
0.6% Other with 328 Other residents.
5.5% Two Or More with 2,949 Two Or More residents.
9.3% Hispanic with 5,041 Hispanic residents.
| Race | Manhattan | KS | USA |
|---|---|---|---|
| White | 75.4% | 73.4% | 58.2% |
| African American | 4.3% | 5.3% | 12.0% |
| American Indian | 0.3% | 0.4% | 0.5% |
| Asian | 4.2% | 2.9% | 5.7% |
| Hawaiian | 0.4% | 0.1% | 0.2% |
| Other | 0.6% | 0.4% | 0.5% |
| Two Or More | 5.5% | 4.3% | 3.9% |
| Hispanic | 9.3% | 13.3% | 19.0% |
Gender in Manhattan
Manhattan is 48.2% female with 26,002 female residents.
Manhattan is 51.8% male with 27,948 male residents.
| Gender | Manhattan | KS | USA |
|---|---|---|---|
| Female | 48.2% | 49.8% | 50.5% |
| Male | 51.8% | 50.2% | 49.5% |
Highest level of educational attainment in Manhattan for adults over 25
1.0% of adults in Manhattan completed < 9th grade.
3.0% of adults in Manhattan completed 9-12th grade.
14.0% of adults in Manhattan completed high school / ged.
22.0% of adults in Manhattan completed some college.
8.0% of adults in Manhattan completed associate's degree.
28.0% of adults in Manhattan completed bachelor's degree.
14.0% of adults in Manhattan completed master's degree.
3.0% of adults in Manhattan completed professional degree.
7.0% of adults in Manhattan completed doctorate degree.
| Education | Manhattan | KS | USA |
|---|---|---|---|
| < 9th Grade | 1.0% | 3.0% | 5.0% |
| 9-12th Grade | 3.0% | 5.0% | 6.0% |
| High School / GED | 14.0% | 26.0% | 26.0% |
| Some College | 22.0% | 22.0% | 19.0% |
| Associate's Degree | 8.0% | 9.0% | 9.0% |
| Bachelor's Degree | 28.0% | 22.0% | 21.0% |
| Master's Degree | 14.0% | 10.0% | 10.0% |
| Professional Degree | 3.0% | 2.0% | 2.0% |
| Doctorate Degree | 7.0% | 1.0% | 2.0% |
Household Income For Manhattan, Kansas
9.0% of households in Manhattan earn Less than $10,000.
5.2% of households in Manhattan earn $10,000 to $14,999.
9.5% of households in Manhattan earn $15,000 to $24,999.
8.8% of households in Manhattan earn $25,000 to $34,999.
11.5% of households in Manhattan earn $35,000 to $49,999.
18.2% of households in Manhattan earn $50,000 to $74,999.
11.6% of households in Manhattan earn $75,000 to $99,999.
12.6% of households in Manhattan earn $100,000 to $149,999.
6.7% of households in Manhattan earn $150,000 to $199,999.
6.9% of households in Manhattan earn $200,000 or more.
| Income | Manhattan | KS | USA |
|---|---|---|---|
| Less than $10,000 | 9.0% | 4.4% | 4.9% |
| $10,000 to $14,999 | 5.2% | 3.3% | 3.6% |
| $15,000 to $24,999 | 9.5% | 6.7% | 6.6% |
| $25,000 to $34,999 | 8.8% | 7.8% | 6.8% |
| $35,000 to $49,999 | 11.5% | 11.5% | 10.4% |
| $50,000 to $74,999 | 18.2% | 17.8% | 15.7% |
| $75,000 to $99,999 | 11.6% | 13.5% | 12.7% |
| $100,000 to $149,999 | 12.6% | 17.7% | 17.4% |
| $150,000 to $199,999 | 6.7% | 8.4% | 9.3% |
| $200,000 or more | 6.9% | 8.8% | 12.6% |


