Brooklyn Park, MD
Demographics And Statistics
Living In Brooklyn Park, Maryland Summary
Life in Brooklyn Park research summary. HomeSnacks has been using Saturday Night Science to research the quality of life in Brooklyn Park over the past nine years using Census, FBI, Zillow, and other primary data sources. Based on the most recently available data, we found the following about life in Brooklyn Park:
The population in Brooklyn Park is 15,799.
The median home value in Brooklyn Park is $293,340.
The median income in Brooklyn Park is $84,276.
The cost of living in Brooklyn Park is 107 which is 1.1x higher than the national average.
The median rent in Brooklyn Park is $1,453.
The unemployment rate in Brooklyn Park is 5.4%.
The poverty rate in Brooklyn Park is 7.8%.
The average high in Brooklyn Park is 65.4° and the average low is 47.0°.
Table Of Contents
Brooklyn Park SnackAbility
Overall SnackAbility
Brooklyn Park, MD Cost Of Living
Cost of living in Brooklyn Park summary. We use data on the cost of living to determine how expensive it is to live in Brooklyn Park. Real estate prices drive most of the variance in cost of living around Maryland. Key points include:
The cost of living in Brooklyn Park is 107 with 100 being average.
The cost of living in Brooklyn Park is 1.1x higher than the national average.
The median home value in Brooklyn Park is $293,340.
The median income in Brooklyn Park is $84,276.
Brooklyn Park's Overall Cost Of Living
Higher Than The National Average
Cost Of Living In Brooklyn Park Comparison Table
| Living Expense | Brooklyn Park | Maryland | National Average | |
|---|---|---|---|---|
| Overall | 107 | 121 | 100 | |
| Services | 104 | 105 | 100 | |
| Groceries | 107 | 107 | 100 | |
| Health | 100 | 96 | 100 | |
| Housing | 122 | 150 | 100 | |
| Transportation | 101 | 99 | 100 | |
| Utilities | 113 | 113 | 100 | |
Brooklyn Park, MD Weather
The average high in Brooklyn Park is 65.4° and the average low is 47.0°.
There are 75.0 days of precipitation each year.
Expect an average of 42.8 inches of precipitation each year with 13.7 inches of snow.
| Stat | Brooklyn Park |
|---|---|
| Average Annual High | 65.4 |
| Average Annual Low | 47.0 |
| Annual Precipitation Days | 75.0 |
| Average Annual Precipitation | 42.8 |
| Average Annual Snowfall | 13.7 |
Average High
Days of Rain
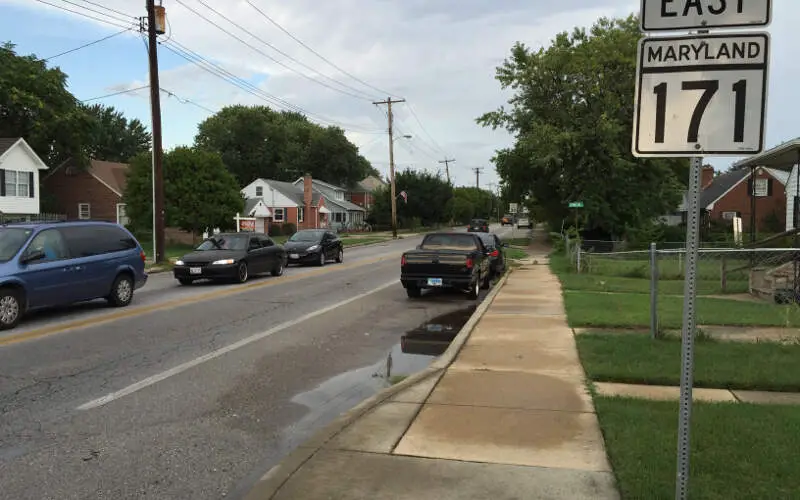
Brooklyn Park, MD Photos
Rankings for Brooklyn Park in Maryland


Locations Around Brooklyn Park
Map Of Brooklyn Park, MD
Best Places Around Brooklyn Park
Ilchester, MD
Population 27,552
North Laurel, MD
Population 25,201
Columbia, MD
Population 105,871
Scaggsville, MD
Population 10,441
Savage, MD
Population 8,284
Severna Park, MD
Population 39,499
Crofton, MD
Population 29,878
Bowie, MD
Population 57,771
Cape St. Claire, MD
Population 9,016
Elkridge, MD
Population 26,183
Brooklyn Park Demographics And Statistics
Population over time in Brooklyn Park
The current population in Brooklyn Park is 15,799. The population has increased 11.4% from 2010.
| Year | Population | % Change |
|---|---|---|
| 2023 | 15,799 | -0.6% |
| 2022 | 15,902 | 2.3% |
| 2021 | 15,541 | 2.5% |
| 2020 | 15,163 | 2.1% |
| 2019 | 14,850 | -1.2% |
| 2018 | 15,036 | 1.4% |
| 2017 | 14,833 | 4.8% |
| 2016 | 14,159 | 0.8% |
| 2015 | 14,042 | -0.7% |
| 2014 | 14,136 | -1.0% |
| 2013 | 14,274 | -2.6% |
| 2012 | 14,650 | 1.1% |
| 2011 | 14,495 | 2.2% |
| 2010 | 14,178 | - |
Race / Ethnicity in Brooklyn Park
Brooklyn Park is:
50.1% White with 7,916 White residents.
23.7% African American with 3,739 African American residents.
0.1% American Indian with 14 American Indian residents.
3.2% Asian with 502 Asian residents.
0.0% Hawaiian with 0 Hawaiian residents.
0.3% Other with 52 Other residents.
6.0% Two Or More with 947 Two Or More residents.
16.6% Hispanic with 2,629 Hispanic residents.
| Race | Brooklyn Park | MD | USA |
|---|---|---|---|
| White | 50.1% | 47.4% | 58.2% |
| African American | 23.7% | 29.2% | 12.0% |
| American Indian | 0.1% | 0.1% | 0.5% |
| Asian | 3.2% | 6.4% | 5.7% |
| Hawaiian | 0.0% | 0.0% | 0.2% |
| Other | 0.3% | 0.6% | 0.5% |
| Two Or More | 6.0% | 4.2% | 3.9% |
| Hispanic | 16.6% | 12.1% | 19.0% |
Gender in Brooklyn Park
Brooklyn Park is 49.8% female with 7,863 female residents.
Brooklyn Park is 50.2% male with 7,936 male residents.
| Gender | Brooklyn Park | MD | USA |
|---|---|---|---|
| Female | 49.8% | 51.3% | 50.5% |
| Male | 50.2% | 48.7% | 49.5% |
Highest level of educational attainment in Brooklyn Park for adults over 25
8.0% of adults in Brooklyn Park completed < 9th grade.
8.0% of adults in Brooklyn Park completed 9-12th grade.
40.0% of adults in Brooklyn Park completed high school / ged.
19.0% of adults in Brooklyn Park completed some college.
6.0% of adults in Brooklyn Park completed associate's degree.
10.0% of adults in Brooklyn Park completed bachelor's degree.
6.0% of adults in Brooklyn Park completed master's degree.
1.0% of adults in Brooklyn Park completed professional degree.
2.0% of adults in Brooklyn Park completed doctorate degree.
| Education | Brooklyn Park | MD | USA |
|---|---|---|---|
| < 9th Grade | 8.0% | 4.0% | 5.0% |
| 9-12th Grade | 8.0% | 5.0% | 6.0% |
| High School / GED | 40.0% | 24.0% | 26.0% |
| Some College | 19.0% | 18.0% | 19.0% |
| Associate's Degree | 6.0% | 7.0% | 9.0% |
| Bachelor's Degree | 10.0% | 22.0% | 21.0% |
| Master's Degree | 6.0% | 14.0% | 10.0% |
| Professional Degree | 1.0% | 3.0% | 2.0% |
| Doctorate Degree | 2.0% | 3.0% | 2.0% |
Household Income For Brooklyn Park, Maryland
3.6% of households in Brooklyn Park earn Less than $10,000.
2.5% of households in Brooklyn Park earn $10,000 to $14,999.
3.7% of households in Brooklyn Park earn $15,000 to $24,999.
6.6% of households in Brooklyn Park earn $25,000 to $34,999.
10.7% of households in Brooklyn Park earn $35,000 to $49,999.
16.8% of households in Brooklyn Park earn $50,000 to $74,999.
16.3% of households in Brooklyn Park earn $75,000 to $99,999.
21.4% of households in Brooklyn Park earn $100,000 to $149,999.
12.1% of households in Brooklyn Park earn $150,000 to $199,999.
6.2% of households in Brooklyn Park earn $200,000 or more.
| Income | Brooklyn Park | MD | USA |
|---|---|---|---|
| Less than $10,000 | 3.6% | 4.3% | 4.9% |
| $10,000 to $14,999 | 2.5% | 2.5% | 3.6% |
| $15,000 to $24,999 | 3.7% | 4.5% | 6.6% |
| $25,000 to $34,999 | 6.6% | 4.9% | 6.8% |
| $35,000 to $49,999 | 10.7% | 7.9% | 10.4% |
| $50,000 to $74,999 | 16.8% | 13.2% | 15.7% |
| $75,000 to $99,999 | 16.3% | 12.0% | 12.7% |
| $100,000 to $149,999 | 21.4% | 19.3% | 17.4% |
| $150,000 to $199,999 | 12.1% | 12.4% | 9.3% |
| $200,000 or more | 6.2% | 19.2% | 12.6% |


