Manchester, MD
Demographics And Statistics
Living In Manchester, Maryland Summary
Life in Manchester research summary. HomeSnacks has been using Saturday Night Science to research the quality of life in Manchester over the past nine years using Census, FBI, Zillow, and other primary data sources. Based on the most recently available data, we found the following about life in Manchester:
The population in Manchester is 5,446.
The median home value in Manchester is $462,359.
The median income in Manchester is $112,679.
The median rent in Manchester is $1,329.
The unemployment rate in Manchester is 1.8%.
The poverty rate in Manchester is 5.7%.
The average high in Manchester is 62.8° and the average low is 43.8°.
Table Of Contents
Manchester SnackAbility
Overall SnackAbility
Manchester, MD Crime Report
Crime in Manchester summary. We use data from the FBI to determine the crime rates in Manchester. Key points include:
There were 16 total crimes in Manchester in the last reporting year.
The overall crime rate per 100,000 people in Manchester is 287.4 / 100k people.
The violent crime rate per 100,000 people in Manchester is 179.6 / 100k people.
The property crime rate per 100,000 people in Manchester is 107.8 / 100k people.
Overall, crime in Manchester is -86.44% below the national average.
Total Crimes
Below National Average
Crime In Manchester Comparison Table
| Statistic | Count Raw |
Manchester / 100k People |
Maryland / 100k People |
National / 100k People |
|---|---|---|---|---|
| Total Crimes Per 100K | 16 | 287.4 | 2,470.0 | 2,119.2 |
| Violent Crime | 10 | 179.6 | 420.4 | 359.0 |
| Murder | 0 | 0.0 | 7.2 | 5.0 |
| Robbery | 0 | 0.0 | 123.2 | 61.0 |
| Aggravated Assault | 9 | 161.7 | 257.0 | 256.0 |
| Property Crime | 6 | 107.8 | 2,049.6 | 1,760.0 |
| Burglary | 1 | 18.0 | 190.0 | 229.0 |
| Larceny | 4 | 71.9 | 1,446.8 | 1,272.0 |
| Car Theft | 1 | 18.0 | 412.8 | 259.0 |
Manchester, MD Weather
The average high in Manchester is 62.8° and the average low is 43.8°.
There are 79.2 days of precipitation each year.
Expect an average of 44.9 inches of precipitation each year with 28.1 inches of snow.
| Stat | Manchester |
|---|---|
| Average Annual High | 62.8 |
| Average Annual Low | 43.8 |
| Annual Precipitation Days | 79.2 |
| Average Annual Precipitation | 44.9 |
| Average Annual Snowfall | 28.1 |
Average High
Days of Rain
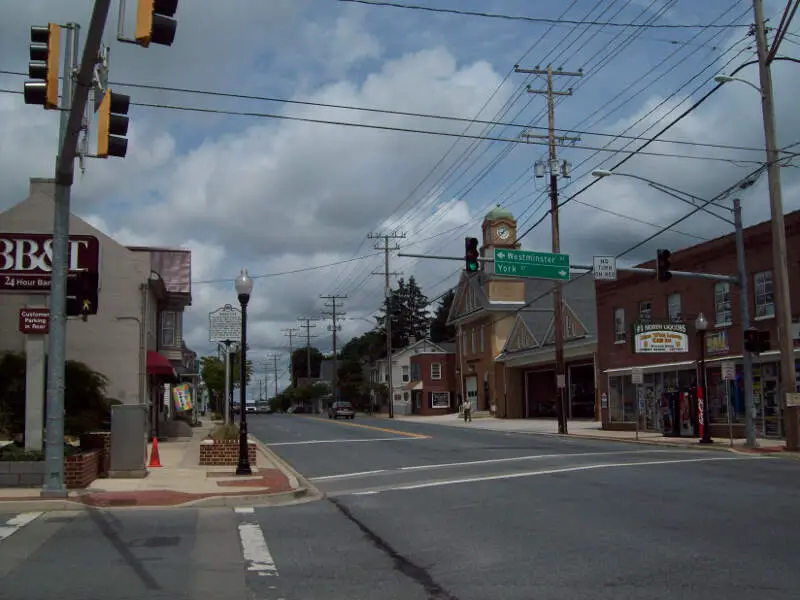
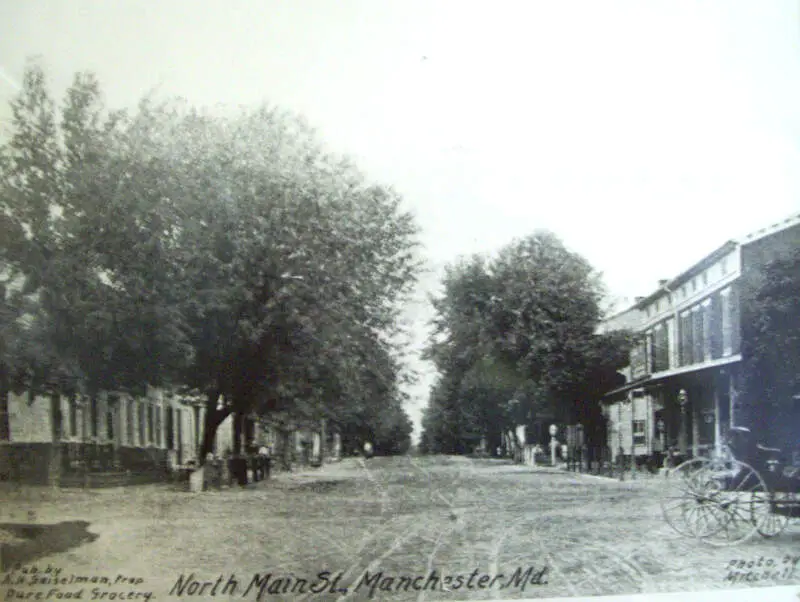
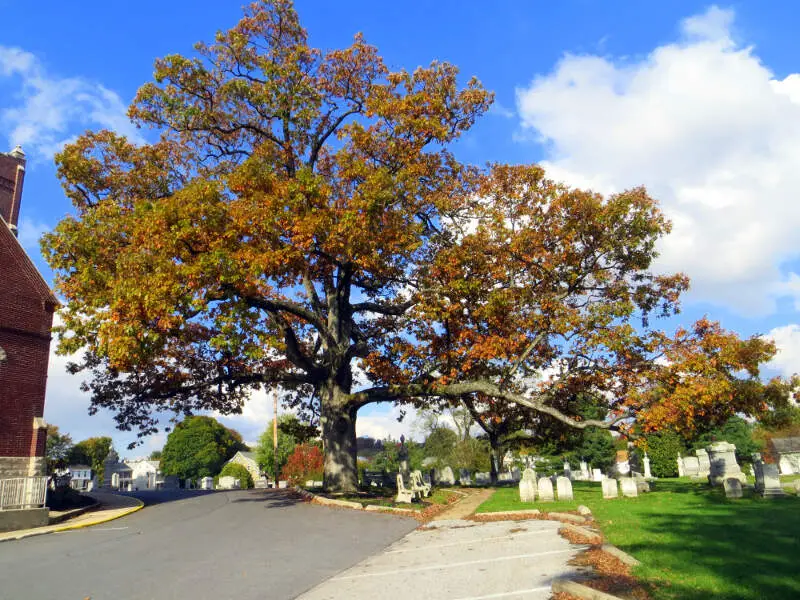
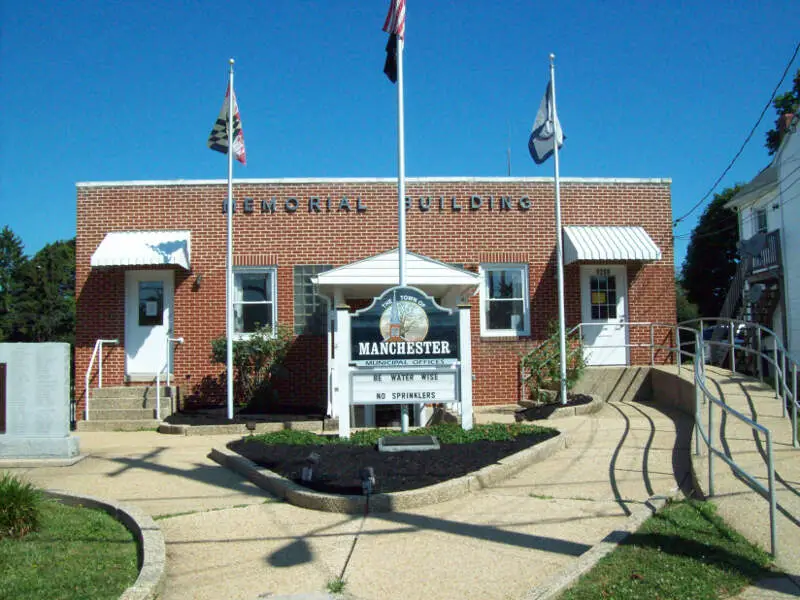
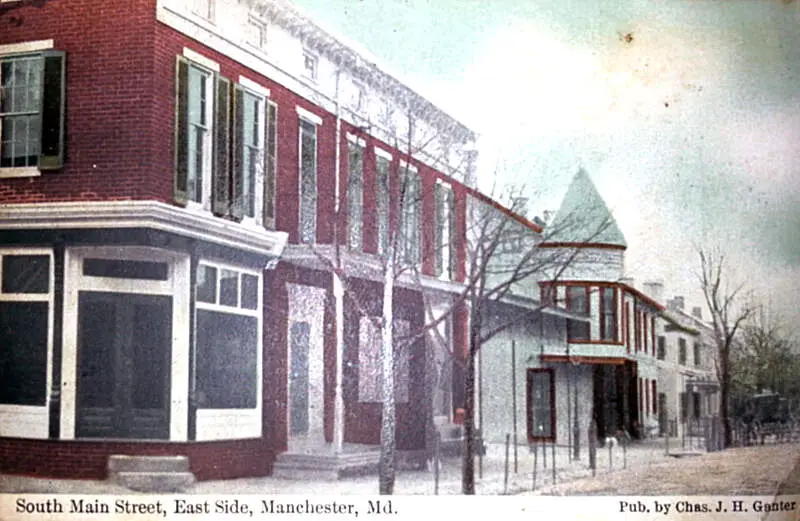
Manchester, MD Photos


Rankings for Manchester in Maryland


Locations Around Manchester
Map Of Manchester, MD
Best Places Around Manchester
Eldersburg, MD
Population 30,626
Mays Chapel, MD
Population 15,616
Parkville, PA
Population 8,354
Hanover, PA
Population 16,483
Hampstead, MD
Population 6,311
Taneytown, MD
Population 7,295
Randallstown, MD
Population 35,975
Garrison, MD
Population 10,449
Reisterstown, MD
Population 27,764
Westminster, MD
Population 20,257
Manchester Demographics And Statistics
Population over time in Manchester
The current population in Manchester is 5,446. The population has increased 18.5% from 2010.
| Year | Population | % Change |
|---|---|---|
| 2023 | 5,446 | 0.8% |
| 2022 | 5,403 | 1.0% |
| 2021 | 5,350 | 12.6% |
| 2020 | 4,752 | -1.7% |
| 2019 | 4,832 | -0.1% |
| 2018 | 4,836 | 0.2% |
| 2017 | 4,825 | 0.2% |
| 2016 | 4,814 | 0.0% |
| 2015 | 4,814 | 0.1% |
| 2014 | 4,810 | 0.4% |
| 2013 | 4,793 | 0.9% |
| 2012 | 4,750 | 1.4% |
| 2011 | 4,684 | 1.9% |
| 2010 | 4,597 | - |
Race / Ethnicity in Manchester
Manchester is:
84.5% White with 4,600 White residents.
3.0% African American with 162 African American residents.
0.9% American Indian with 47 American Indian residents.
3.7% Asian with 203 Asian residents.
0.0% Hawaiian with 0 Hawaiian residents.
0.2% Other with 11 Other residents.
5.2% Two Or More with 281 Two Or More residents.
2.6% Hispanic with 142 Hispanic residents.
| Race | Manchester | MD | USA |
|---|---|---|---|
| White | 84.5% | 47.4% | 58.2% |
| African American | 3.0% | 29.2% | 12.0% |
| American Indian | 0.9% | 0.1% | 0.5% |
| Asian | 3.7% | 6.4% | 5.7% |
| Hawaiian | 0.0% | 0.0% | 0.2% |
| Other | 0.2% | 0.6% | 0.5% |
| Two Or More | 5.2% | 4.2% | 3.9% |
| Hispanic | 2.6% | 12.1% | 19.0% |
Gender in Manchester
Manchester is 50.9% female with 2,771 female residents.
Manchester is 49.1% male with 2,675 male residents.
| Gender | Manchester | MD | USA |
|---|---|---|---|
| Female | 50.9% | 51.3% | 50.5% |
| Male | 49.1% | 48.7% | 49.5% |
Highest level of educational attainment in Manchester for adults over 25
3.0% of adults in Manchester completed < 9th grade.
2.0% of adults in Manchester completed 9-12th grade.
28.0% of adults in Manchester completed high school / ged.
25.0% of adults in Manchester completed some college.
10.0% of adults in Manchester completed associate's degree.
20.0% of adults in Manchester completed bachelor's degree.
9.0% of adults in Manchester completed master's degree.
2.0% of adults in Manchester completed professional degree.
1.0% of adults in Manchester completed doctorate degree.
| Education | Manchester | MD | USA |
|---|---|---|---|
| < 9th Grade | 3.0% | 4.0% | 5.0% |
| 9-12th Grade | 2.0% | 5.0% | 6.0% |
| High School / GED | 28.0% | 24.0% | 26.0% |
| Some College | 25.0% | 18.0% | 19.0% |
| Associate's Degree | 10.0% | 7.0% | 9.0% |
| Bachelor's Degree | 20.0% | 22.0% | 21.0% |
| Master's Degree | 9.0% | 14.0% | 10.0% |
| Professional Degree | 2.0% | 3.0% | 2.0% |
| Doctorate Degree | 1.0% | 3.0% | 2.0% |
Household Income For Manchester, Maryland
3.0% of households in Manchester earn Less than $10,000.
5.8% of households in Manchester earn $10,000 to $14,999.
2.3% of households in Manchester earn $15,000 to $24,999.
9.9% of households in Manchester earn $25,000 to $34,999.
12.2% of households in Manchester earn $35,000 to $49,999.
5.6% of households in Manchester earn $50,000 to $74,999.
4.4% of households in Manchester earn $75,000 to $99,999.
25.0% of households in Manchester earn $100,000 to $149,999.
19.4% of households in Manchester earn $150,000 to $199,999.
12.5% of households in Manchester earn $200,000 or more.
| Income | Manchester | MD | USA |
|---|---|---|---|
| Less than $10,000 | 3.0% | 4.3% | 4.9% |
| $10,000 to $14,999 | 5.8% | 2.5% | 3.6% |
| $15,000 to $24,999 | 2.3% | 4.5% | 6.6% |
| $25,000 to $34,999 | 9.9% | 4.9% | 6.8% |
| $35,000 to $49,999 | 12.2% | 7.9% | 10.4% |
| $50,000 to $74,999 | 5.6% | 13.2% | 15.7% |
| $75,000 to $99,999 | 4.4% | 12.0% | 12.7% |
| $100,000 to $149,999 | 25.0% | 19.3% | 17.4% |
| $150,000 to $199,999 | 19.4% | 12.4% | 9.3% |
| $200,000 or more | 12.5% | 19.2% | 12.6% |


