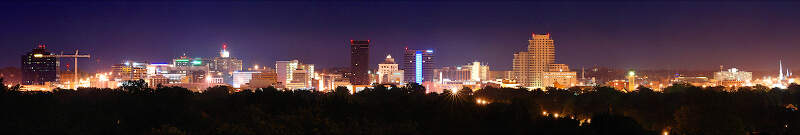
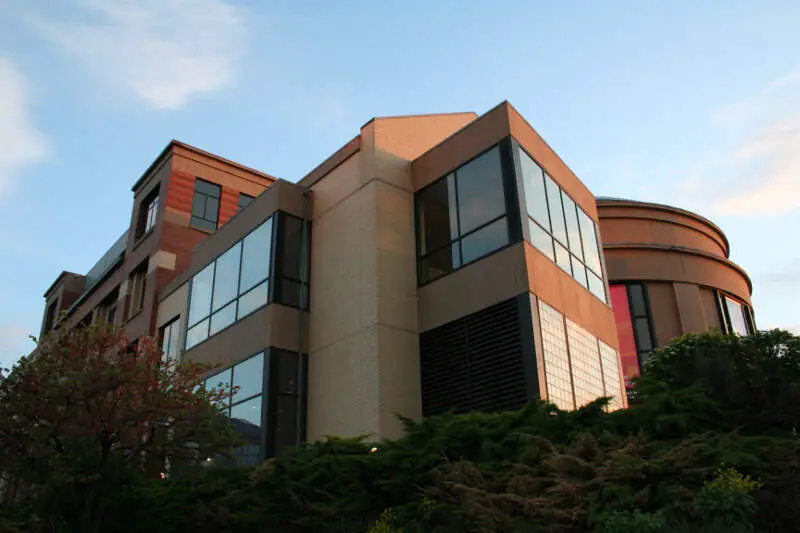
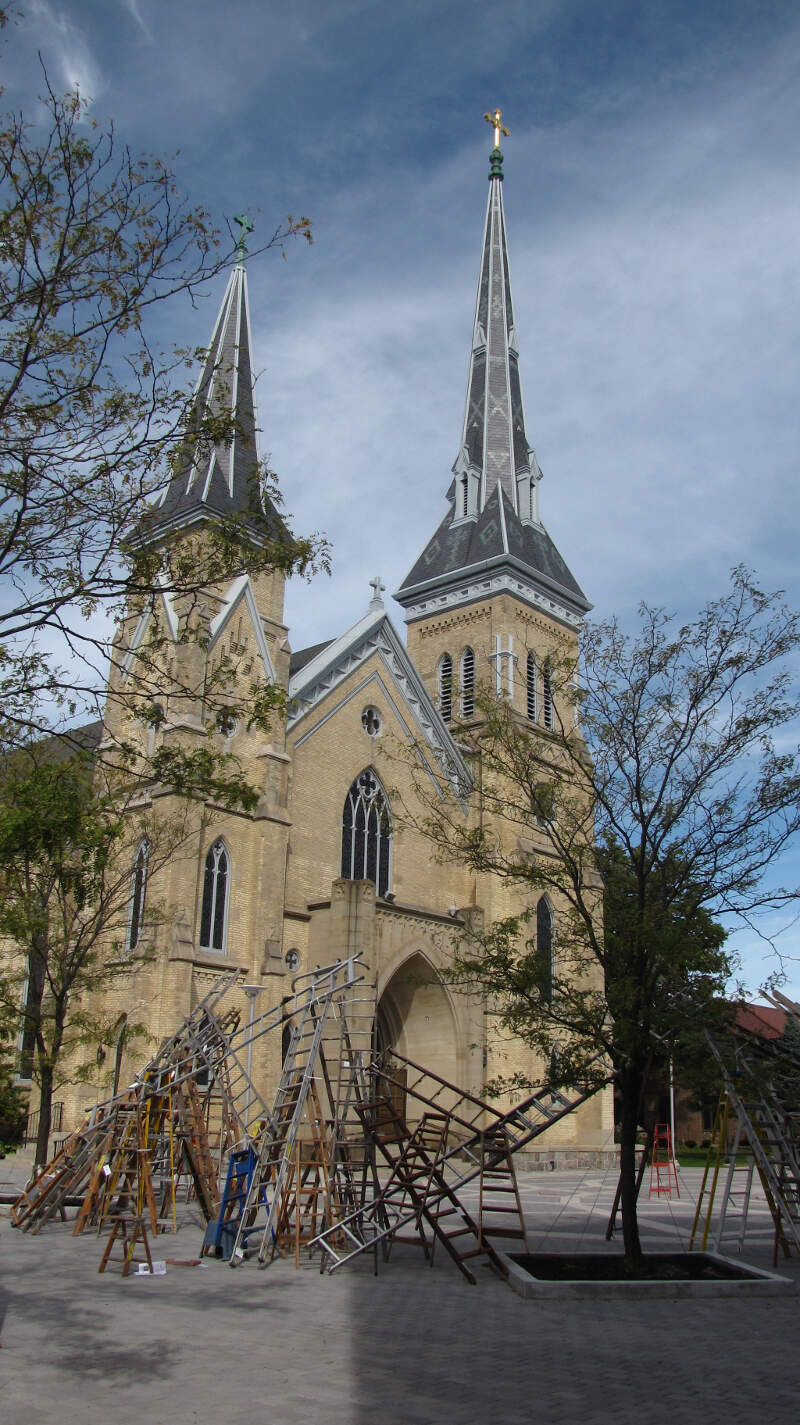
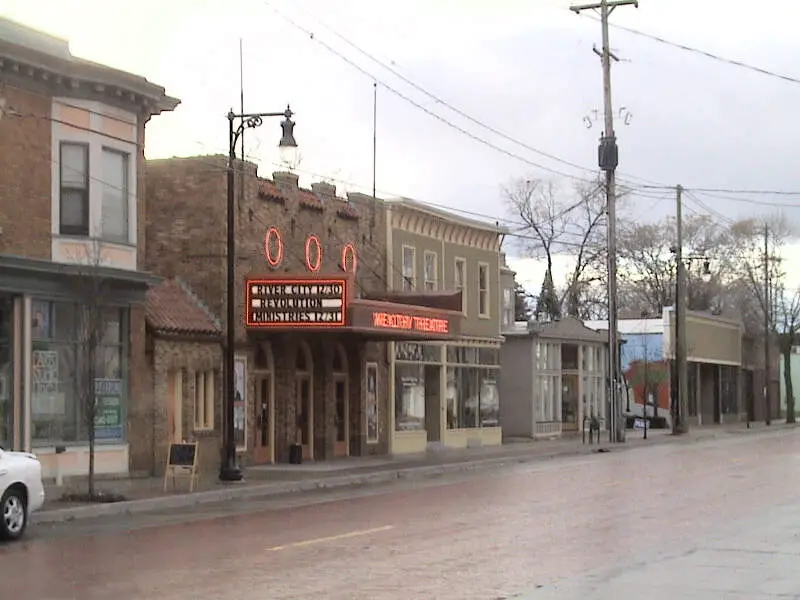
Grand Rapids, MI
Demographics And Statistics
Living In Grand Rapids, Michigan Summary
Life in Grand Rapids research summary. HomeSnacks has been using Saturday Night Science to research the quality of life in Grand Rapids over the past nine years using Census, FBI, Zillow, and other primary data sources. Based on the most recently available data, we found the following about life in Grand Rapids:
The population in Grand Rapids is 197,768.
The median home value in Grand Rapids is $297,964.
The median income in Grand Rapids is $65,526.
The cost of living in Grand Rapids is 93 which is 0.9x lower than the national average.
The median rent in Grand Rapids is $1,191.
The unemployment rate in Grand Rapids is 5.0%.
The poverty rate in Grand Rapids is 18.6%.
The average high in Grand Rapids is 57.1° and the average low is 37.9°.
Grand Rapids SnackAbility
Overall SnackAbility
Grand Rapids, MI Crime Report
Crime in Grand Rapids summary. We use data from the FBI to determine the crime rates in Grand Rapids. Key points include:
There were 6,643 total crimes in Grand Rapids in the last reporting year.
The overall crime rate per 100,000 people in Grand Rapids is 3,390.8 / 100k people.
The violent crime rate per 100,000 people in Grand Rapids is 910.1 / 100k people.
The property crime rate per 100,000 people in Grand Rapids is 2,480.7 / 100k people.
Overall, crime in Grand Rapids is 60.00% above the national average.
Total Crimes
Above National Average
Crime In Grand Rapids Comparison Table
| Statistic | Count Raw |
Grand Rapids / 100k People |
Michigan / 100k People |
National / 100k People |
|---|---|---|---|---|
| Total Crimes Per 100K | 6,643 | 3,390.8 | 1,813.2 | 2,119.2 |
| Violent Crime | 1,783 | 910.1 | 434.3 | 359.0 |
| Murder | 12 | 6.1 | 5.2 | 5.0 |
| Robbery | 228 | 116.4 | 31.3 | 61.0 |
| Aggravated Assault | 1,367 | 697.8 | 341.3 | 256.0 |
| Property Crime | 4,860 | 2,480.7 | 1,378.9 | 1,760.0 |
| Burglary | 524 | 267.5 | 184.2 | 229.0 |
| Larceny | 3,583 | 1,828.9 | 963.6 | 1,272.0 |
| Car Theft | 753 | 384.4 | 231.0 | 259.0 |
Grand Rapids, MI Cost Of Living
Cost of living in Grand Rapids summary. We use data on the cost of living to determine how expensive it is to live in Grand Rapids. Real estate prices drive most of the variance in cost of living around Michigan. Key points include:
The cost of living in Grand Rapids is 93 with 100 being average.
The cost of living in Grand Rapids is 0.9x lower than the national average.
The median home value in Grand Rapids is $297,964.
The median income in Grand Rapids is $65,526.
Grand Rapids's Overall Cost Of Living
Lower Than The National Average
Cost Of Living In Grand Rapids Comparison Table
| Living Expense | Grand Rapids | Michigan | National Average | |
|---|---|---|---|---|
| Overall | 93 | 90 | 100 | |
| Services | 90 | 93 | 100 | |
| Groceries | 96 | 97 | 100 | |
| Health | 95 | 91 | 100 | |
| Housing | 90 | 72 | 100 | |
| Transportation | 96 | 96 | 100 | |
| Utilities | 103 | 99 | 100 | |
Grand Rapids, MI Weather
The average high in Grand Rapids is 57.1° and the average low is 37.9°.
There are 77.5 days of precipitation each year.
Expect an average of 36.4 inches of precipitation each year with 65.7 inches of snow.
| Stat | Grand Rapids |
|---|---|
| Average Annual High | 57.1 |
| Average Annual Low | 37.9 |
| Annual Precipitation Days | 77.5 |
| Average Annual Precipitation | 36.4 |
| Average Annual Snowfall | 65.7 |
Average High
Days of Rain
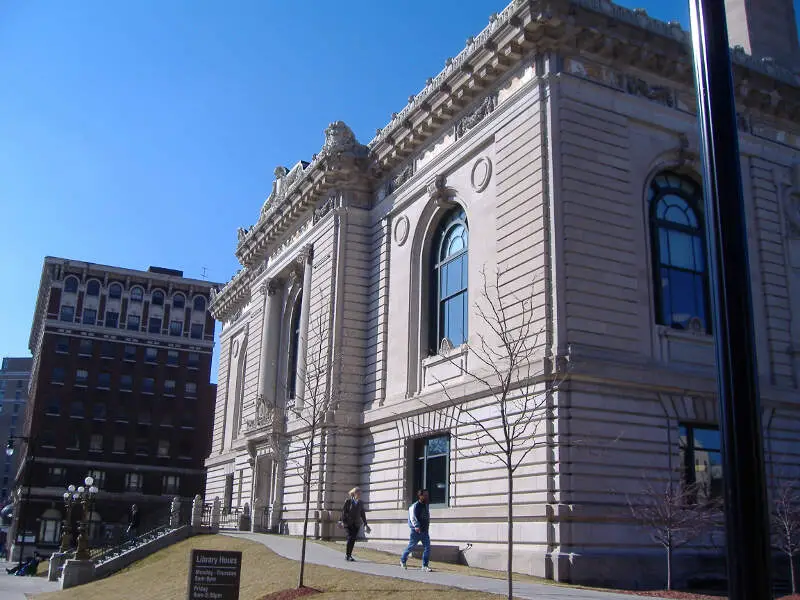
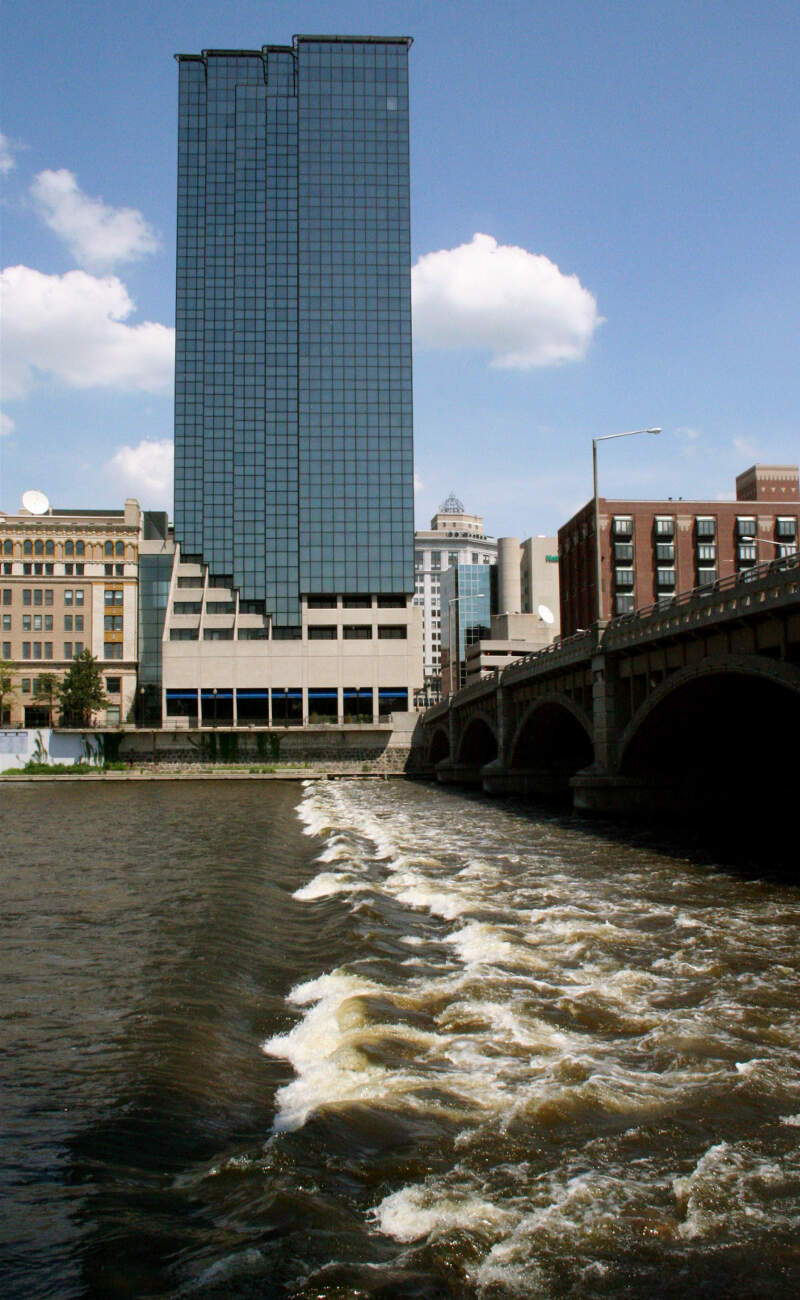
Grand Rapids, MI Photos


1 Reviews & Comments About Grand Rapids
/5

HomeSnacks User - 2018-07-14 11:29:29.492368
The crime is pretty bad at night but during the day it's usually a beautiful place, you can go fishing off the bridge downtown and go to the museum that's actually pretty cool. The schools are not that good but they get the kids some education
Downtown is just gorgeous with restaurants and places for activities
Grand Rapids Articles

Rankings for Grand Rapids in Michigan


Locations Around Grand Rapids
Map Of Grand Rapids, MI
Best Places Around Grand Rapids
East Grand Rapids, MI
Population 11,394
Forest Hills, MI
Population 28,494
Jenison, MI
Population 17,334
Byron Center, MI
Population 6,817
Hudsonville, MI
Population 7,711
Rockford, MI
Population 6,162
Northview, MI
Population 15,225
Wyoming, MI
Population 76,865
Kentwood, MI
Population 54,114
Cutlerville, MI
Population 19,465
Grand Rapids Demographics And Statistics
Population over time in Grand Rapids
The current population in Grand Rapids is 197,768. The population has increased 3.8% from 2010.
| Year | Population | % Change |
|---|---|---|
| 2023 | 197,768 | -0.2% |
| 2022 | 198,096 | 0.1% |
| 2021 | 197,858 | -0.8% |
| 2020 | 199,417 | 0.5% |
| 2019 | 198,401 | 0.7% |
| 2018 | 197,081 | 0.9% |
| 2017 | 195,355 | 0.8% |
| 2016 | 193,887 | 0.8% |
| 2015 | 192,416 | 0.9% |
| 2014 | 190,739 | 0.5% |
| 2013 | 189,735 | 0.2% |
| 2012 | 189,340 | -0.3% |
| 2011 | 189,853 | -0.3% |
| 2010 | 190,441 | - |
Race / Ethnicity in Grand Rapids
Grand Rapids is:
57.5% White with 113,635 White residents.
17.4% African American with 34,470 African American residents.
0.2% American Indian with 472 American Indian residents.
2.8% Asian with 5,589 Asian residents.
0.0% Hawaiian with 30 Hawaiian residents.
0.6% Other with 1,144 Other residents.
5.4% Two Or More with 10,590 Two Or More residents.
16.1% Hispanic with 31,838 Hispanic residents.
| Race | Grand Rapids | MI | USA |
|---|---|---|---|
| White | 57.5% | 73.0% | 58.2% |
| African American | 17.4% | 13.2% | 12.0% |
| American Indian | 0.2% | 0.3% | 0.5% |
| Asian | 2.8% | 3.3% | 5.7% |
| Hawaiian | 0.0% | 0.0% | 0.2% |
| Other | 0.6% | 0.4% | 0.5% |
| Two Or More | 5.4% | 4.1% | 3.9% |
| Hispanic | 16.1% | 5.7% | 19.0% |
Gender in Grand Rapids
Grand Rapids is 50.9% female with 100,610 female residents.
Grand Rapids is 49.1% male with 97,158 male residents.
| Gender | Grand Rapids | MI | USA |
|---|---|---|---|
| Female | 50.9% | 50.4% | 50.5% |
| Male | 49.1% | 49.6% | 49.5% |
Highest level of educational attainment in Grand Rapids for adults over 25
6.0% of adults in Grand Rapids completed < 9th grade.
5.0% of adults in Grand Rapids completed 9-12th grade.
22.0% of adults in Grand Rapids completed high school / ged.
20.0% of adults in Grand Rapids completed some college.
7.0% of adults in Grand Rapids completed associate's degree.
26.0% of adults in Grand Rapids completed bachelor's degree.
10.0% of adults in Grand Rapids completed master's degree.
2.0% of adults in Grand Rapids completed professional degree.
2.0% of adults in Grand Rapids completed doctorate degree.
| Education | Grand Rapids | MI | USA |
|---|---|---|---|
| < 9th Grade | 6.0% | 3.0% | 5.0% |
| 9-12th Grade | 5.0% | 6.0% | 6.0% |
| High School / GED | 22.0% | 28.0% | 26.0% |
| Some College | 20.0% | 22.0% | 19.0% |
| Associate's Degree | 7.0% | 10.0% | 9.0% |
| Bachelor's Degree | 26.0% | 19.0% | 21.0% |
| Master's Degree | 10.0% | 9.0% | 10.0% |
| Professional Degree | 2.0% | 2.0% | 2.0% |
| Doctorate Degree | 2.0% | 1.0% | 2.0% |
Household Income For Grand Rapids, Michigan
5.9% of households in Grand Rapids earn Less than $10,000.
5.9% of households in Grand Rapids earn $10,000 to $14,999.
7.2% of households in Grand Rapids earn $15,000 to $24,999.
7.3% of households in Grand Rapids earn $25,000 to $34,999.
11.9% of households in Grand Rapids earn $35,000 to $49,999.
17.9% of households in Grand Rapids earn $50,000 to $74,999.
14.7% of households in Grand Rapids earn $75,000 to $99,999.
17.5% of households in Grand Rapids earn $100,000 to $149,999.
6.6% of households in Grand Rapids earn $150,000 to $199,999.
5.1% of households in Grand Rapids earn $200,000 or more.
| Income | Grand Rapids | MI | USA |
|---|---|---|---|
| Less than $10,000 | 5.9% | 5.0% | 4.9% |
| $10,000 to $14,999 | 5.9% | 3.9% | 3.6% |
| $15,000 to $24,999 | 7.2% | 7.1% | 6.6% |
| $25,000 to $34,999 | 7.3% | 7.6% | 6.8% |
| $35,000 to $49,999 | 11.9% | 11.8% | 10.4% |
| $50,000 to $74,999 | 17.9% | 16.9% | 15.7% |
| $75,000 to $99,999 | 14.7% | 13.4% | 12.7% |
| $100,000 to $149,999 | 17.5% | 16.9% | 17.4% |
| $150,000 to $199,999 | 6.6% | 8.3% | 9.3% |
| $200,000 or more | 5.1% | 9.0% | 12.6% |


