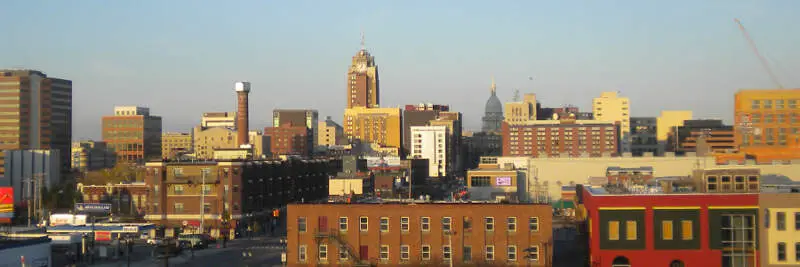
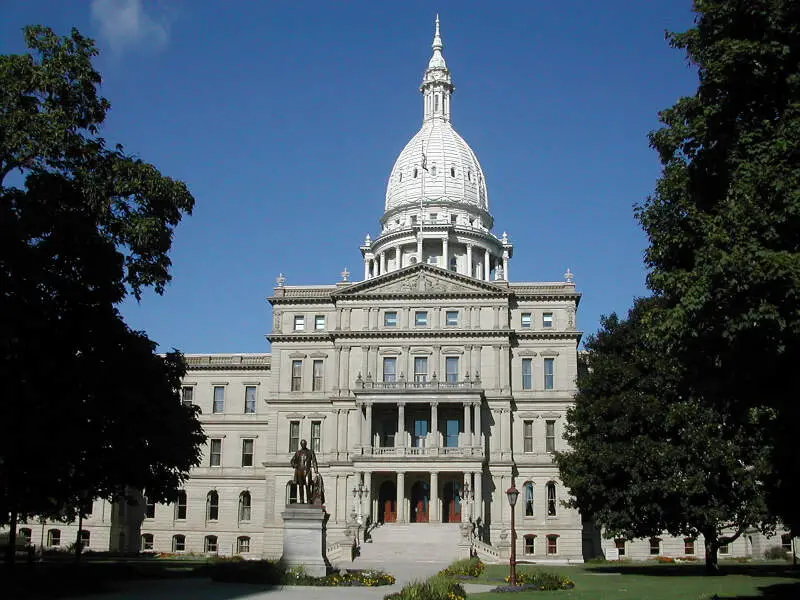
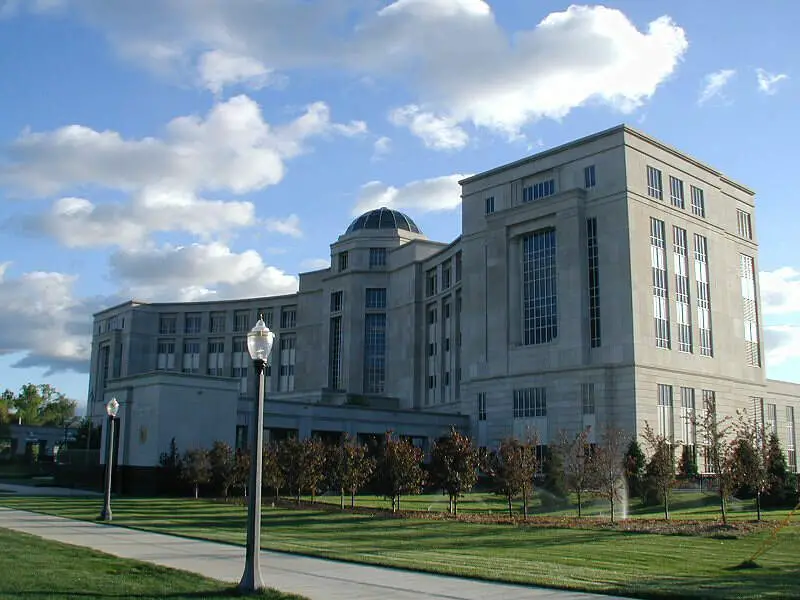
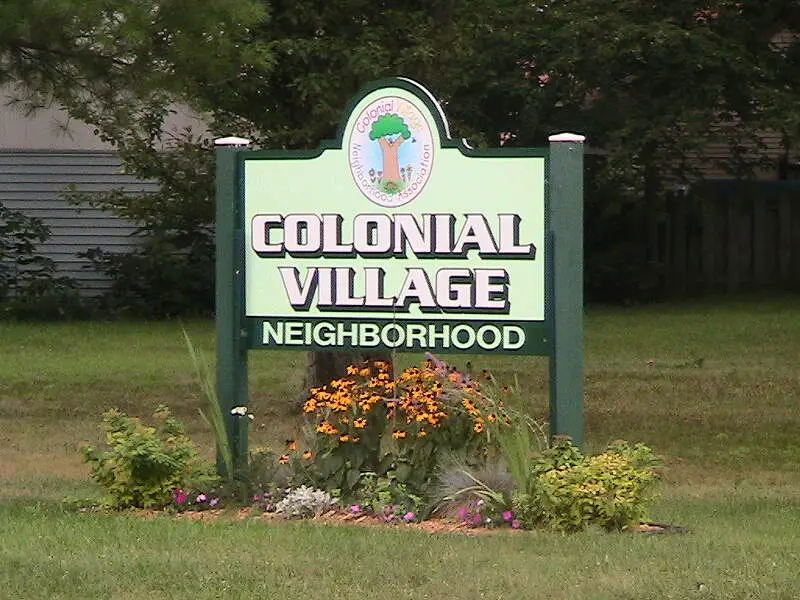
Lansing, MI
Demographics And Statistics
Living In Lansing, Michigan Summary
Life in Lansing research summary. HomeSnacks has been using Saturday Night Science to research the quality of life in Lansing over the past nine years using Census, FBI, Zillow, and other primary data sources. Based on the most recently available data, we found the following about life in Lansing:
The population in Lansing is 112,546.
The median home value in Lansing is $161,773.
The median income in Lansing is $52,170.
The cost of living in Lansing is 85 which is 0.8x lower than the national average.
The median rent in Lansing is $976.
The unemployment rate in Lansing is 8.1%.
The poverty rate in Lansing is 19.9%.
The average high in Lansing is 57.1° and the average low is 37.9°.
Lansing SnackAbility
Overall SnackAbility
Lansing, MI Crime Report
Crime in Lansing summary. We use data from the FBI to determine the crime rates in Lansing. Key points include:
There were 4,304 total crimes in Lansing in the last reporting year.
The overall crime rate per 100,000 people in Lansing is 3,844.1 / 100k people.
The violent crime rate per 100,000 people in Lansing is 1,345.1 / 100k people.
The property crime rate per 100,000 people in Lansing is 2,499.0 / 100k people.
Overall, crime in Lansing is 81.39% above the national average.
Total Crimes
Above National Average
Crime In Lansing Comparison Table
| Statistic | Count Raw |
Lansing / 100k People |
Michigan / 100k People |
National / 100k People |
|---|---|---|---|---|
| Total Crimes Per 100K | 4,304 | 3,844.1 | 1,813.2 | 2,119.2 |
| Violent Crime | 1,506 | 1,345.1 | 434.3 | 359.0 |
| Murder | 11 | 9.8 | 5.2 | 5.0 |
| Robbery | 108 | 96.5 | 31.3 | 61.0 |
| Aggravated Assault | 1,270 | 1,134.3 | 341.3 | 256.0 |
| Property Crime | 2,798 | 2,499.0 | 1,378.9 | 1,760.0 |
| Burglary | 472 | 421.6 | 184.2 | 229.0 |
| Larceny | 1,600 | 1,429.0 | 963.6 | 1,272.0 |
| Car Theft | 726 | 648.4 | 231.0 | 259.0 |
Lansing, MI Cost Of Living
Cost of living in Lansing summary. We use data on the cost of living to determine how expensive it is to live in Lansing. Real estate prices drive most of the variance in cost of living around Michigan. Key points include:
The cost of living in Lansing is 85 with 100 being average.
The cost of living in Lansing is 0.8x lower than the national average.
The median home value in Lansing is $161,773.
The median income in Lansing is $52,170.
Lansing's Overall Cost Of Living
Lower Than The National Average
Cost Of Living In Lansing Comparison Table
| Living Expense | Lansing | Michigan | National Average | |
|---|---|---|---|---|
| Overall | 85 | 90 | 100 | |
| Services | 90 | 93 | 100 | |
| Groceries | 96 | 97 | 100 | |
| Health | 92 | 91 | 100 | |
| Housing | 58 | 72 | 100 | |
| Transportation | 97 | 96 | 100 | |
| Utilities | 101 | 99 | 100 | |
Lansing, MI Weather
The average high in Lansing is 57.1° and the average low is 37.9°.
There are 69.9 days of precipitation each year.
Expect an average of 33.0 inches of precipitation each year with 46.6 inches of snow.
| Stat | Lansing |
|---|---|
| Average Annual High | 57.1 |
| Average Annual Low | 37.9 |
| Annual Precipitation Days | 69.9 |
| Average Annual Precipitation | 33.0 |
| Average Annual Snowfall | 46.6 |
Average High
Days of Rain
Lansing, MI Photos


1 Reviews & Comments About Lansing
/5

Ridiculous Rage Fails - None
I love living in Michigan. I like how you can go to one of the lakes in a matter of minutes. If you live on the shoreline. I live in Lansing and it is beautiful.
Rankings for Lansing in Michigan


Locations Around Lansing
Map Of Lansing, MI
Best Places Around Lansing
Okemos, MI
Population 25,503
Holt, MI
Population 25,275
Mason, MI
Population 8,239
Haslett, MI
Population 19,025
Grand Ledge, MI
Population 7,797
Waverly, MI
Population 23,301
St. Johns, MI
Population 7,712
East Lansing, MI
Population 45,394
Eaton Rapids, MI
Population 5,197
Charlotte, MI
Population 9,269
Lansing Demographics And Statistics
Population over time in Lansing
The current population in Lansing is 112,546. The population has decreased -2.7% from 2010.
| Year | Population | % Change |
|---|---|---|
| 2023 | 112,546 | -0.4% |
| 2022 | 112,986 | -0.5% |
| 2021 | 113,592 | -3.3% |
| 2020 | 117,488 | 0.3% |
| 2019 | 117,159 | 0.4% |
| 2018 | 116,699 | 1.3% |
| 2017 | 115,222 | 0.4% |
| 2016 | 114,773 | 0.3% |
| 2015 | 114,485 | 0.1% |
| 2014 | 114,382 | 0.1% |
| 2013 | 114,274 | -0.2% |
| 2012 | 114,537 | -0.5% |
| 2011 | 115,101 | -0.5% |
| 2010 | 115,634 | - |
Race / Ethnicity in Lansing
Lansing is:
51.3% White with 57,734 White residents.
22.7% African American with 25,497 African American residents.
0.2% American Indian with 274 American Indian residents.
5.3% Asian with 5,914 Asian residents.
0.0% Hawaiian with 0 Hawaiian residents.
0.7% Other with 823 Other residents.
7.0% Two Or More with 7,822 Two Or More residents.
12.9% Hispanic with 14,482 Hispanic residents.
| Race | Lansing | MI | USA |
|---|---|---|---|
| White | 51.3% | 73.0% | 58.2% |
| African American | 22.7% | 13.2% | 12.0% |
| American Indian | 0.2% | 0.3% | 0.5% |
| Asian | 5.3% | 3.3% | 5.7% |
| Hawaiian | 0.0% | 0.0% | 0.2% |
| Other | 0.7% | 0.4% | 0.5% |
| Two Or More | 7.0% | 4.1% | 3.9% |
| Hispanic | 12.9% | 5.7% | 19.0% |
Gender in Lansing
Lansing is 50.7% female with 57,013 female residents.
Lansing is 49.3% male with 55,533 male residents.
| Gender | Lansing | MI | USA |
|---|---|---|---|
| Female | 50.7% | 50.4% | 50.5% |
| Male | 49.3% | 49.6% | 49.5% |
Highest level of educational attainment in Lansing for adults over 25
5.0% of adults in Lansing completed < 9th grade.
6.0% of adults in Lansing completed 9-12th grade.
25.0% of adults in Lansing completed high school / ged.
25.0% of adults in Lansing completed some college.
10.0% of adults in Lansing completed associate's degree.
18.0% of adults in Lansing completed bachelor's degree.
8.0% of adults in Lansing completed master's degree.
1.0% of adults in Lansing completed professional degree.
2.0% of adults in Lansing completed doctorate degree.
| Education | Lansing | MI | USA |
|---|---|---|---|
| < 9th Grade | 5.0% | 3.0% | 5.0% |
| 9-12th Grade | 6.0% | 6.0% | 6.0% |
| High School / GED | 25.0% | 28.0% | 26.0% |
| Some College | 25.0% | 22.0% | 19.0% |
| Associate's Degree | 10.0% | 10.0% | 9.0% |
| Bachelor's Degree | 18.0% | 19.0% | 21.0% |
| Master's Degree | 8.0% | 9.0% | 10.0% |
| Professional Degree | 1.0% | 2.0% | 2.0% |
| Doctorate Degree | 2.0% | 1.0% | 2.0% |
Household Income For Lansing, Michigan
7.1% of households in Lansing earn Less than $10,000.
5.6% of households in Lansing earn $10,000 to $14,999.
9.5% of households in Lansing earn $15,000 to $24,999.
10.2% of households in Lansing earn $25,000 to $34,999.
15.4% of households in Lansing earn $35,000 to $49,999.
22.0% of households in Lansing earn $50,000 to $74,999.
12.6% of households in Lansing earn $75,000 to $99,999.
11.3% of households in Lansing earn $100,000 to $149,999.
3.8% of households in Lansing earn $150,000 to $199,999.
2.5% of households in Lansing earn $200,000 or more.
| Income | Lansing | MI | USA |
|---|---|---|---|
| Less than $10,000 | 7.1% | 5.0% | 4.9% |
| $10,000 to $14,999 | 5.6% | 3.9% | 3.6% |
| $15,000 to $24,999 | 9.5% | 7.1% | 6.6% |
| $25,000 to $34,999 | 10.2% | 7.6% | 6.8% |
| $35,000 to $49,999 | 15.4% | 11.8% | 10.4% |
| $50,000 to $74,999 | 22.0% | 16.9% | 15.7% |
| $75,000 to $99,999 | 12.6% | 13.4% | 12.7% |
| $100,000 to $149,999 | 11.3% | 16.9% | 17.4% |
| $150,000 to $199,999 | 3.8% | 8.3% | 9.3% |
| $200,000 or more | 2.5% | 9.0% | 12.6% |


