Port Huron SnackAbility
Overall SnackAbility
Crime in Port Huron summary. We use data from the FBI to determine the crime rates in Port Huron. Key points include:
There were 594 total crimes in Port Huron in the last reporting year.
The overall crime rate per 100,000 people in Port Huron is 2,106.1 / 100k people.
The violent crime rate per 100,000 people in Port Huron is 602.8 / 100k people.
The property crime rate per 100,000 people in Port Huron is 1,503.3 / 100k people.
Overall, crime in Port Huron is -0.62% below the national average.
Total Crimes
Below National Average
Crime In Port Huron Comparison Table
| Statistic | Count Raw |
Port Huron / 100k People |
Michigan / 100k People |
National / 100k People |
|---|---|---|---|---|
| Total Crimes Per 100K | 594 | 2,106.1 | 1,813.2 | 2,119.2 |
| Violent Crime | 170 | 602.8 | 434.3 | 359.0 |
| Murder | 0 | 0.0 | 5.2 | 5.0 |
| Robbery | 2 | 7.1 | 31.3 | 61.0 |
| Aggravated Assault | 142 | 503.5 | 341.3 | 256.0 |
| Property Crime | 424 | 1,503.3 | 1,378.9 | 1,760.0 |
| Burglary | 74 | 262.4 | 184.2 | 229.0 |
| Larceny | 322 | 1,141.7 | 963.6 | 1,272.0 |
| Car Theft | 28 | 99.3 | 231.0 | 259.0 |
Source: FBI Uniform Crime Reporting (2024)
Cost of living in Port Huron summary. We use data on the cost of living to determine how expensive it is to live in Port Huron. Real estate prices drive most of the variance in cost of living around Michigan. Key points include:
The cost of living in Port Huron is 89 with 100 being average.
The cost of living in Port Huron is 0.9x lower than the national average.
The median home value in Port Huron is $170,018.
The median income in Port Huron is $50,366.
Port Huron's Overall Cost Of Living
Lower Than The National Average
Cost Of Living In Port Huron Comparison Table
| Living Expense | Port Huron | Michigan | National Average |
|---|---|---|---|
| Overall | 89 | 91 | 100 |
| Services | 99 | 97 | 100 |
| Groceries | 95 | 98 | 100 |
| Health | 61 | 75 | 100 |
| Housing | 98 | 98 | 100 |
| Transportation | 100 | 101 | 100 |
| Utilities | 99 | 98 | 100 |
Source: Cost of living index, normalized to US average = 100
Port Huron, MI Weather
The average high in Port Huron is 55.9° and the average low is 39.2°.
There are 76.5 days of precipitation each year.
Expect an average of 34.8 inches of precipitation each year with 37.0 inches of snow.
| Stat | Port Huron |
|---|---|
| Average Annual High | 55.9 |
| Average Annual Low | 39.2 |
| Annual Precipitation Days | 76.5 |
| Average Annual Precipitation | 34.8 |
| Average Annual Snowfall | 37.0 |
Average High
Days of Rain
Source: NOAA climate normals (30-year)
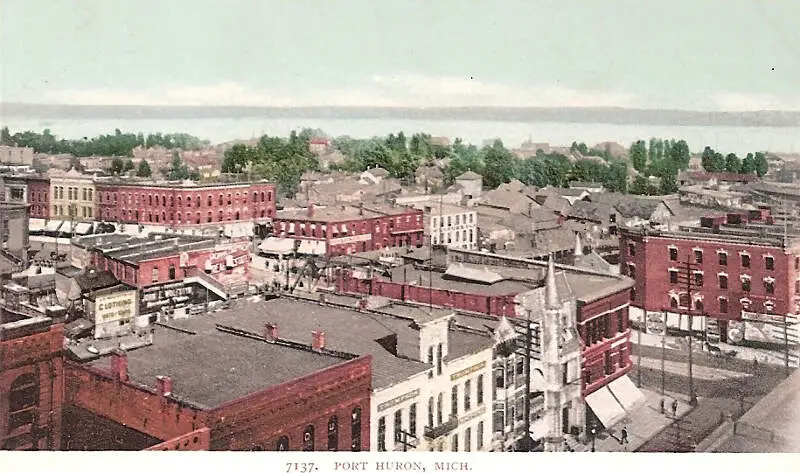
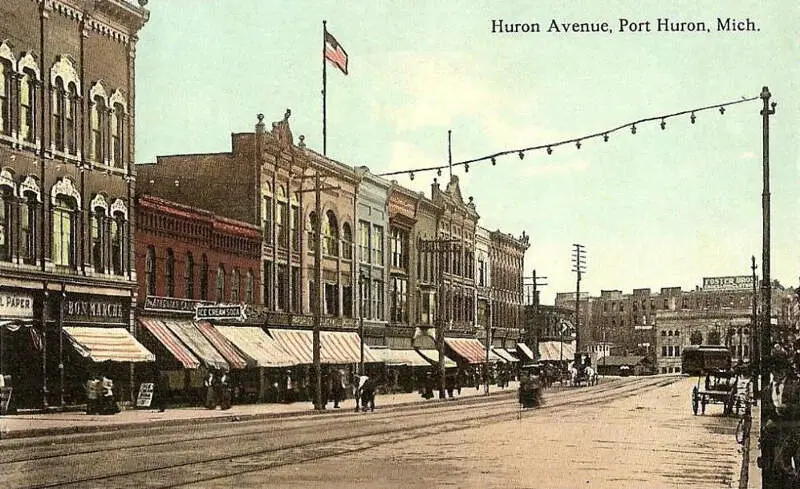
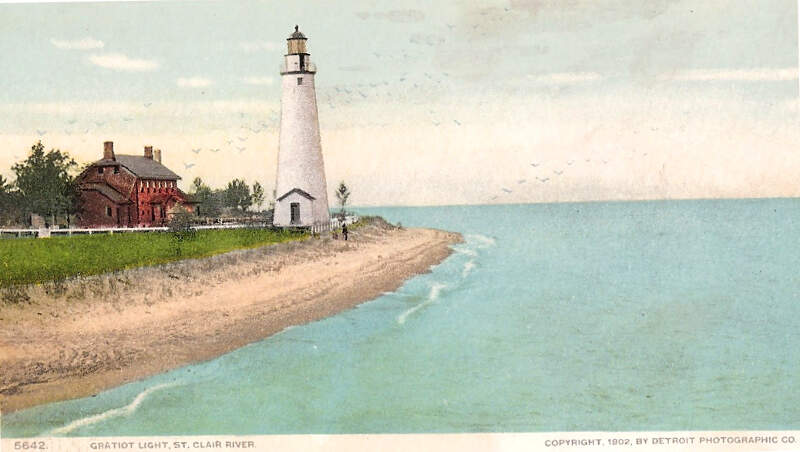
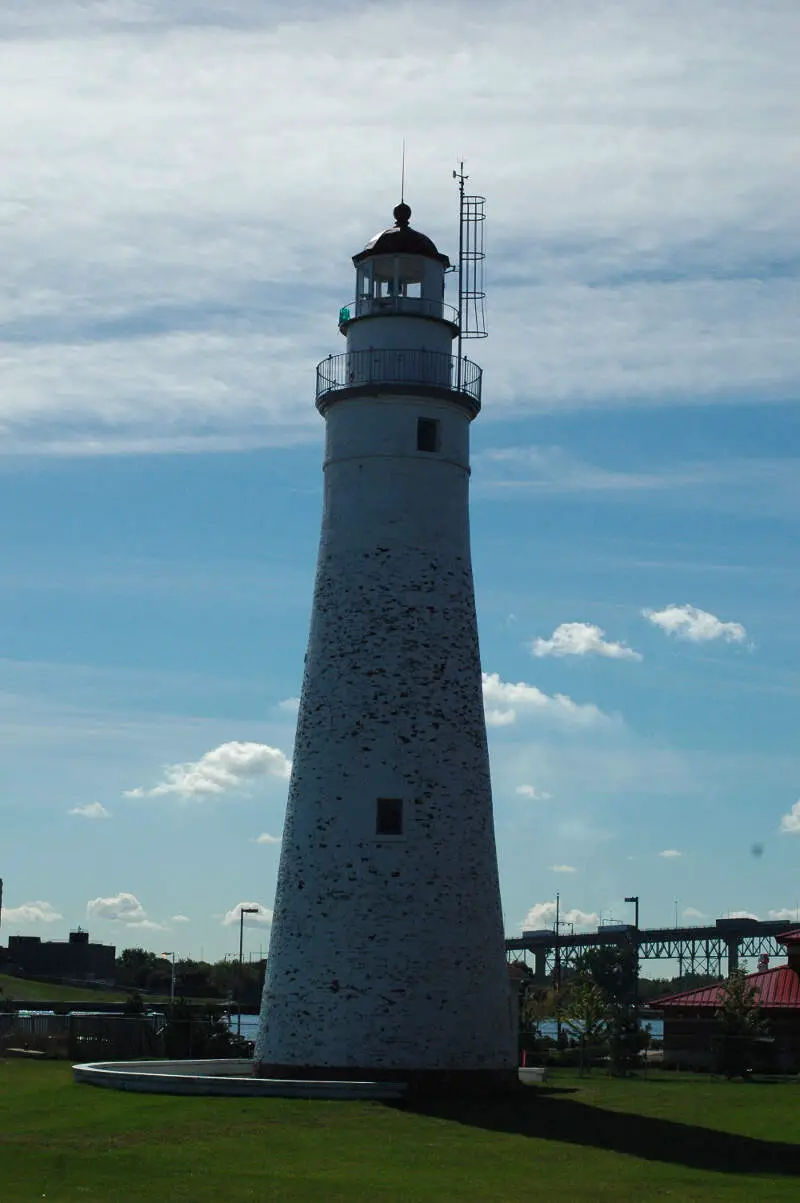
Port Huron, MI Photos

4 Reviews & Comments About Port Huron

Port Huron Michigan is a s**t hole glad we didn't make it it's not that big but a f*****g s**t hole and I live in it but f**k it we ain't on the list
It's an amazing city to live, with close proximity to multiple beaches, great restaurants, and the beautiful Blue Water Bridge. Smaller town appeal, with shops and large stores for all of your needs!
Make sure to check out Freighter's restaurant. With a great view of the bridge and overlooking the water, and amazing food, it's the perfect place to eat!
Port Huron combines the worst of the country with the worst of a small and boring city. It is dirty and has a higher than expected crime and poverty rate. Also, it has the backwoods attitude one would want to avoid in a rural area.
There is nothing to watch out for in Port Huron - there is nothing exciting or fun there.
This city has so much potential but there are many problems as well. Drugs are becoming very prevalent and the presence of violence is getting worse. It is such a shame because it is a beautiful area!
If you love water-this is the place to be! The blue water bridge is beautiful, the boardwalk is amazing as well as the local beach front. Don't forget about the freighter traffic that will leave many is awe! Just watch for jerks in the area!
Rankings & Articles For Port Huron


Locations Around Port Huron
Map Of Port Huron, MI
Best Places Around Port Huron
Royal Oak, MI
Population 57,950
Troy, MI
Population 87,898
Clawson, MI
Population 11,374
Rochester Hills, MI
Population 77,089
Grosse Pointe, MI
Population 5,541
Rochester, MI
Population 12,934
Grosse Pointe Park, MI
Population 11,319
Grosse Pointe Farms, MI
Population 9,904
Grosse Pointe Woods, MI
Population 16,094
Sterling Heights, MI
Population 133,573
Port Huron Demographics And Statistics
Population over time in Port Huron
The current population in Port Huron is 28,620. The population has decreased 7.7% from 2010.
| Year | Population | % Change |
|---|---|---|
| 2024 | 28,620 | -0.4% |
| 2023 | 28,724 | -0.5% |
| 2022 | 28,881 | -0.4% |
| 2021 | 29,009 | 0.3% |
| 2020 | 28,918 | -0.4% |
| 2019 | 29,025 | -0.5% |
| 2018 | 29,175 | -0.4% |
| 2017 | 29,285 | -0.4% |
| 2016 | 29,388 | -0.4% |
| 2015 | 29,508 | -0.1% |
| 2014 | 29,534 | -1.0% |
| 2013 | 29,819 | -1.4% |
| 2012 | 30,253 | -1.3% |
| 2011 | 30,639 | -1.2% |
| 2010 | 31,024 | - |
Race / Ethnicity in Port Huron
See the full breakdown
Port Huron is:
79.0% White with 22,604 White residents.
6.4% African American with 1,842 African American residents.
0.2% American Indian with 63 American Indian residents.
0.9% Asian with 253 Asian residents.
0.0% Hawaiian with 0 Hawaiian residents.
0.4% Other with 117 Other residents.
6.7% Two Or More with 1,927 Two Or More residents.
6.3% Hispanic with 1,814 Hispanic residents.
| Race | Port Huron | MI | USA |
|---|---|---|---|
| White | 79.0% | 72.4% | 57.4% |
| African American | 6.4% | 13.1% | 11.9% |
| American Indian | 0.2% | 0.3% | 0.5% |
| Asian | 0.9% | 3.4% | 5.9% |
| Hawaiian | 0.0% | 0.0% | 0.2% |
| Other | 0.4% | 0.5% | 0.6% |
| Two Or More | 6.7% | 4.5% | 4.3% |
| Hispanic | 6.3% | 5.9% | 19.3% |
Gender in Port Huron
See the full breakdown
Port Huron is 51.1% female with 14,638 female residents.
Port Huron is 48.9% male with 13,981 male residents.
| Gender | Port Huron | MI | USA |
|---|---|---|---|
| Female | 51.1% | 50.4% | 50.5% |
| Male | 48.9% | 49.6% | 49.5% |
Highest level of educational attainment in Port Huron for adults over 25
See the full breakdown
5.0% of adults in Port Huron completed < 9th grade.
9.0% of adults in Port Huron completed 9-12th grade.
34.0% of adults in Port Huron completed high school / ged.
25.0% of adults in Port Huron completed some college.
10.0% of adults in Port Huron completed associate's degree.
12.0% of adults in Port Huron completed bachelor's degree.
4.0% of adults in Port Huron completed master's degree.
1.0% of adults in Port Huron completed professional degree.
0.0% of adults in Port Huron completed doctorate degree.
| Education | Port Huron | MI | USA |
|---|---|---|---|
| < 9th Grade | 5.0% | 3.0% | 4.0% |
| 9-12th Grade | 9.0% | 5.0% | 6.0% |
| High School / GED | 34.0% | 28.0% | 26.0% |
| Some College | 25.0% | 22.0% | 19.0% |
| Associate's Degree | 10.0% | 10.0% | 9.0% |
| Bachelor's Degree | 12.0% | 20.0% | 22.0% |
| Master's Degree | 4.0% | 9.0% | 10.0% |
| Professional Degree | 1.0% | 2.0% | 2.0% |
| Doctorate Degree | 0.0% | 1.0% | 2.0% |
Household Income For Port Huron, Michigan
See the full breakdown
6.7% of households in Port Huron earn Less than $10,000.
6.9% of households in Port Huron earn $10,000 to $14,999.
10.6% of households in Port Huron earn $15,000 to $24,999.
10.9% of households in Port Huron earn $25,000 to $34,999.
14.5% of households in Port Huron earn $35,000 to $49,999.
18.5% of households in Port Huron earn $50,000 to $74,999.
11.5% of households in Port Huron earn $75,000 to $99,999.
12.0% of households in Port Huron earn $100,000 to $149,999.
3.3% of households in Port Huron earn $150,000 to $199,999.
5.0% of households in Port Huron earn $200,000 or more.
| Income | Port Huron | MI | USA |
|---|---|---|---|
| Less than $10,000 | 6.7% | 5.2% | 5.0% |
| $10,000 to $14,999 | 6.9% | 3.8% | 3.4% |
| $15,000 to $24,999 | 10.6% | 6.8% | 6.3% |
| $25,000 to $34,999 | 10.9% | 7.3% | 6.6% |
| $35,000 to $49,999 | 14.5% | 11.4% | 10.1% |
| $50,000 to $74,999 | 18.5% | 16.8% | 15.5% |
| $75,000 to $99,999 | 11.5% | 13.2% | 12.6% |
| $100,000 to $149,999 | 12.0% | 17.3% | 17.5% |
| $150,000 to $199,999 | 3.3% | 8.6% | 9.6% |
| $200,000 or more | 5.0% | 9.5% | 13.4% |
Source: U.S. Census ACS 5-year estimates (2024)


