We used Saturday Night Science to analyze Missouri’s most recent Census data to determine the divorce rate for each city in Missouri based on the percentage of currently divorced residents.
The city with the highest divorce rate in Missouri is De Soto, with 16.0% of people over 15 years of age being divorced, per the most recent census data. The city with the lowest divorce rate in Missouri is Parkville.
Missouri is 7.0% divorced overall. There are some 346,741 people living in Missouri over fifteen years of age who are divorced. You can compare that to the 28,339,199 Americans who are currently divorced.
Isn’t the divorce rate in America close to 50%? Yes indeed. But we’re measuring something else; we are looking at counts and percentages of people over 15 years old who are currently divorced. That 50% statistic is for the percentage of people who have ever been divorced.
So now that we have you biting your nails, rethinking your worldview, and pulling out your hair, let’s look at the places in Missouri with the highest rates of divorcees.
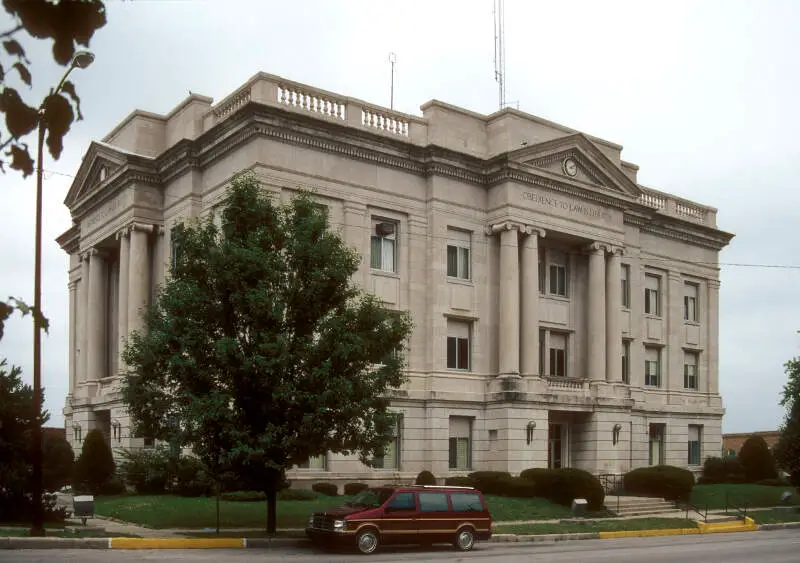
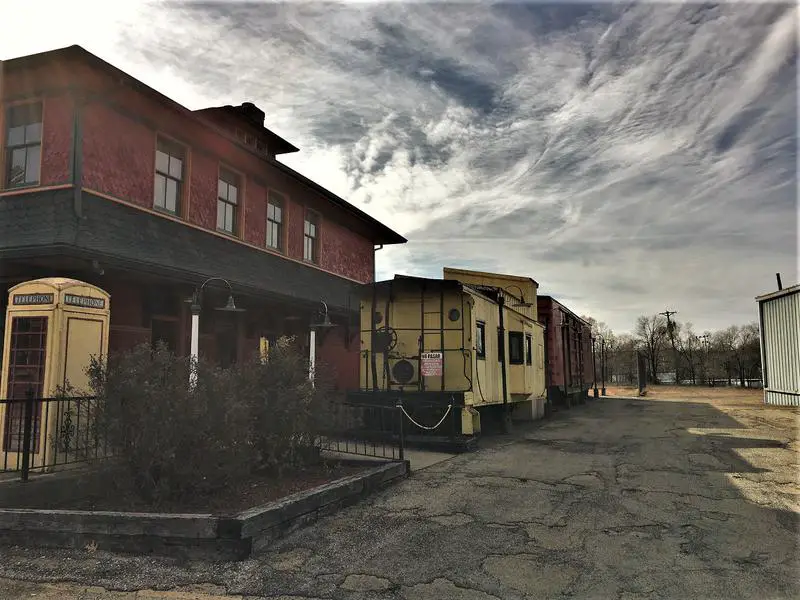
16.0% divorced · #1 highest divorce rate in Missouri
De Soto is a city in Jefferson County, Missouri, United States. The population was 6,400 at the 2010 census and is part of the St. Louis metropolitan area. The Van Metre family were first to settle in 1803. The town was organized in 1857 and is named for the explorer Hernando De Soto, who claimed the Louisiana Territory for Spain. De Soto was the city closest to the mean center of U.S. population in 1980. The city celebrated its Bicentennial in 2003. The city made national news on and after May 6, 2003, when straightline winds and a tornado struck.
Data | Crime | Cost of living | Movers
15.0% divorced · #2 highest divorce rate in Missouri
Richmond is a city in Ray County, Missouri, United States. The population was 5,797 at the 2010 census. It is the county seat of Ray County.
Data | Crime | Cost of living | Movers
15.0% divorced · #2 highest divorce rate in Missouri
Bonne Terre is a city in St. Francois County, Missouri, United States. The population was 6,864 at the 2010 census.
Data | Crime | Cost of living | Movers
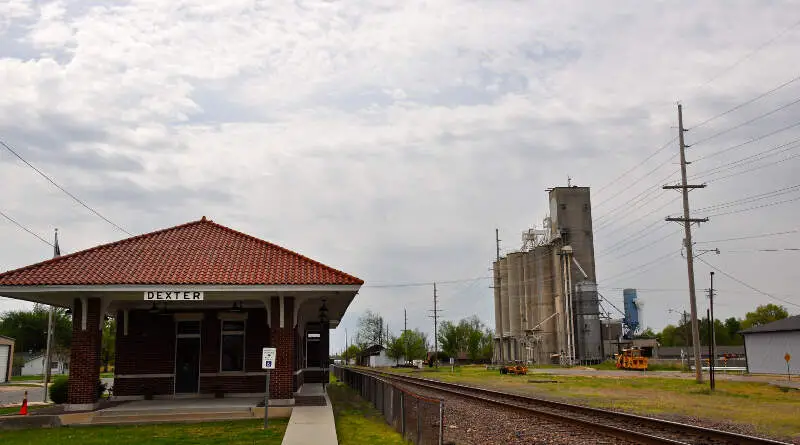
14.0% divorced · #4 highest divorce rate in Missouri
Dexter is a city in Stoddard County, Missouri, United States, founded in 1873. The population was 7,864 at the 2010 census.
Data | Crime | Cost of living | Movers
14.0% divorced · #4 highest divorce rate in Missouri
Farmington is a city in St. Francois County located 72 miles southwest of St. Louis in the Lead Belt region in Missouri in the United States. As of the 2010 census, the population was 16,240. It is the county seat of St. Francois County. Farmington was established in 1822 as Murphy’s Settlement, named for William Murphy of Kentucky who first visited the site in 1798. When St. Francois County was organized, the town was briefly called St. Francois Court House and later renamed to Farmington.
Data | Crime | Cost of living | Movers

13.0% divorced · #7 highest divorce rate in Missouri
Data | Crime | Cost of living | Movers
13.0% divorced · #7 highest divorce rate in Missouri
Aurora is a city in Lawrence County, Missouri, United States. The population was 7,508 at the 2010 census.
Data | Crime | Cost of living | Movers

13.0% divorced · #7 highest divorce rate in Missouri
Sullivan is a city that straddles the border of Franklin County and Crawford County in the U.S. state of Missouri. The population was 7,081 at the 2010 census.
Data | Crime | Cost of living | Movers
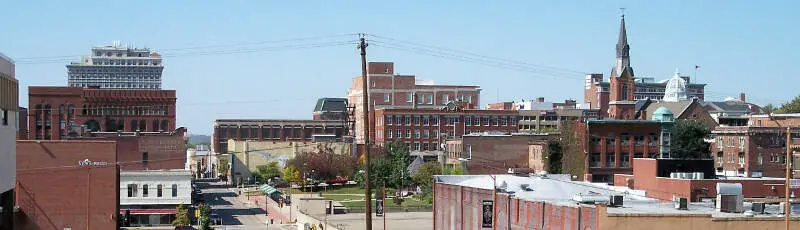
12.0% divorced · #11 highest divorce rate in Missouri
St. Joseph is a city in and the county seat of Buchanan County, Missouri, United States. It is the principal city of the St. Joseph Metropolitan Statistical Area, which includes Buchanan, Andrew, and DeKalb counties in Missouri and Doniphan County, Kansas. As of the 2010 census, St. Joseph had a total population of 76,780, making it the eighth largest city in the state, third largest in Northwest Missouri. The metropolitan area had a population of 127,329 in 2010.
Data | Crime | Cost of living | Movers
12.0% divorced · #11 highest divorce rate in Missouri
Data | Crime | Cost of living | Movers
The receipts
Compare the top ten
Pick a metric. The bars rescale. The red line is Missouri’s statewide median.
Missouri statewide median: $70,702
On the map
Where Missouri’s highest divorce rates are
Saturday Night Science
How We Determined The Places In Missouri That Get Un-Hitched The Most
We used Saturday Night Science to look at the U.S. Census Bureau on divorce rates. Because who likes tracking misery more than the U.S. government?
Specifically, we looked at the 2020-2024 American Community Survey table S1201 — Marital Status. Pretty straightforward on that front — we just had to extract the following column of data:
Today, the analysis focuses on the 131 places in Missouri with a population of over 5,000.
- Population 15 Years and Over -> Divorced
We ranked each place by the percentage of divorcees over 15 years of age from highest to lowest. We crowned the divorce capital of Missouri the place with the highest incidence of divorcees, De Soto.
And if you’re trying to avoid divorce, check out Parkville, the city with the lowest divorce rate in Missouri. We updated this article for 2026 and this list is our eleventh time ranking the cities in Missouri with the highest divorce rates.
The full plate
Cities With The Highest Divorce Rates In Missouri
Click any column to sort. Search by city name.
| Rank | City | Population | Divorcees | Divorce Rate |
|---|---|---|---|---|
| 1 | De Soto | 6,470 | 828 | 16.0% |
| 2 | Richmond | 5,959 | 715 | 15.0% |
| 2 | Bonne Terre | 6,683 | 802 | 15.0% |
| 4 | Dexter | 7,891 | 884 | 14.0% |
| 4 | Farmington | 18,282 | 2,048 | 14.0% |
| 7 | Jennings | 12,918 | 1,343 | 13.0% |
| 7 | Aurora | 7,397 | 769 | 13.0% |
| 7 | Sullivan | 6,310 | 656 | 13.0% |
| 11 | St. Joseph | 71,236 | 6,839 | 12.0% |
| 11 | St. John | 6,527 | 627 | 12.0% |
| 11 | Park Hills | 8,678 | 833 | 12.0% |
| 11 | Mexico | 11,477 | 1,102 | 12.0% |
| 11 | Nevada | 7,925 | 761 | 12.0% |
| 18 | Florissant | 51,773 | 4,556 | 11.0% |
| 18 | Chillicothe | 8,923 | 785 | 11.0% |
| 18 | Bellefontaine Neighbors | 10,498 | 924 | 11.0% |
| 18 | Clinton | 9,065 | 798 | 11.0% |
| 18 | Warrenton | 9,066 | 798 | 11.0% |
| 18 | Fulton | 12,617 | 1,110 | 11.0% |
| 18 | Moberly | 13,526 | 1,190 | 11.0% |
| 18 | Trenton | 5,536 | 487 | 11.0% |
| 18 | Cameron | 8,519 | 750 | 11.0% |
| 18 | Kennett | 10,196 | 897 | 11.0% |
| 30 | Hannibal | 16,771 | 1,342 | 10.0% |
| 30 | Macon | 5,466 | 437 | 10.0% |
| 30 | Marshall | 13,739 | 1,099 | 10.0% |
| 30 | Arnold | 20,956 | 1,676 | 10.0% |
| 30 | Raytown | 29,445 | 2,356 | 10.0% |
| 30 | Union | 12,781 | 1,022 | 10.0% |
| 30 | Sedalia | 22,003 | 1,760 | 10.0% |
| 30 | St. Ann | 12,811 | 1,025 | 10.0% |
| 30 | Oak Grove | 8,538 | 683 | 10.0% |
| 30 | Lebanon | 15,270 | 1,222 | 10.0% |
| 30 | Ferguson | 18,213 | 1,457 | 10.0% |
| 30 | Wright City | 5,240 | 419 | 10.0% |
| 30 | Pacific | 7,475 | 598 | 10.0% |
| 30 | Boonville | 7,689 | 615 | 10.0% |
| 46 | Poplar Bluff | 16,254 | 1,170 | 9.0% |
| 46 | Troy | 13,947 | 1,004 | 9.0% |
| 46 | Ste. Genevieve | 5,010 | 361 | 9.0% |
| 46 | Belton | 25,008 | 1,801 | 9.0% |
| 46 | Marshfield | 7,696 | 554 | 9.0% |
| 46 | Caruthersville | 5,326 | 383 | 9.0% |
| 46 | Independence | 121,740 | 8,765 | 9.0% |
| 46 | Hazelwood | 25,114 | 1,808 | 9.0% |
| 46 | Bolivar | 11,170 | 804 | 9.0% |
| 46 | Pevely | 6,055 | 436 | 9.0% |
| 46 | Festus | 13,201 | 950 | 9.0% |
| 46 | Webb City | 13,221 | 952 | 9.0% |
| 46 | Shrewsbury | 6,316 | 455 | 9.0% |
| 46 | Eureka | 13,081 | 942 | 9.0% |
| 46 | Valley Park | 6,795 | 489 | 9.0% |
| 46 | Harrisonville | 9,970 | 718 | 9.0% |
| 46 | Berkeley | 8,123 | 585 | 9.0% |
| 46 | Overland | 15,695 | 1,130 | 9.0% |
| 60 | Grain Valley | 16,271 | 1,041 | 8.0% |
| 60 | Excelsior Springs | 10,484 | 671 | 8.0% |
| 60 | Republic | 19,829 | 1,269 | 8.0% |
| 60 | Springfield | 169,954 | 10,877 | 8.0% |
| 60 | Blue Springs | 59,965 | 3,838 | 8.0% |
| 60 | Jefferson City | 42,488 | 2,719 | 8.0% |
| 60 | St. Louis | 288,512 | 18,465 | 8.0% |
| 60 | Gladstone | 27,207 | 1,741 | 8.0% |
| 60 | Carthage | 15,574 | 997 | 8.0% |
| 60 | Perryville | 8,536 | 546 | 8.0% |
| 75 | Cape Girardeau | 40,344 | 2,259 | 7.0% |
| 75 | Sunset Hills | 9,112 | 510 | 7.0% |
| 75 | Wentzville | 47,061 | 2,635 | 7.0% |
| 75 | Kearney | 10,885 | 610 | 7.0% |
| 75 | St. Charles | 71,508 | 4,004 | 7.0% |
| 75 | Brentwood | 8,144 | 456 | 7.0% |
| 75 | West Plains | 12,441 | 697 | 7.0% |
| 75 | Sikeston | 16,320 | 914 | 7.0% |
| 75 | Joplin | 52,593 | 2,945 | 7.0% |
| 75 | St. Peters | 59,092 | 3,309 | 7.0% |
| 75 | Smithville | 10,705 | 599 | 7.0% |
| 75 | Washington | 15,130 | 847 | 7.0% |
| 75 | Crestwood | 12,295 | 689 | 7.0% |
| 75 | Savannah | 5,053 | 283 | 7.0% |
| 75 | O’Fallon | 93,801 | 5,253 | 7.0% |
| 75 | Jackson | 15,659 | 877 | 7.0% |
| 75 | Odessa | 5,620 | 315 | 7.0% |
| 75 | Olivette | 8,645 | 484 | 7.0% |
| 75 | Black Jack | 6,589 | 369 | 7.0% |
| 75 | Kirkwood | 29,363 | 1,644 | 7.0% |
| 91 | Maryland Heights | 27,880 | 1,338 | 6.0% |
| 91 | Herculaneum | 5,071 | 243 | 6.0% |
| 91 | Lee’s Summit | 103,656 | 4,975 | 6.0% |
| 91 | Liberty | 30,689 | 1,473 | 6.0% |
| 91 | Maryville | 10,428 | 501 | 6.0% |
| 91 | Raymore | 24,526 | 1,177 | 6.0% |
| 91 | Ellisville | 10,002 | 480 | 6.0% |
| 91 | Kansas City | 510,612 | 24,509 | 6.0% |
| 91 | Richmond Heights | 9,153 | 439 | 6.0% |
| 91 | Rolla | 20,287 | 974 | 6.0% |
| 91 | Willard | 6,488 | 311 | 6.0% |
| 91 | Cottleville | 5,937 | 285 | 6.0% |
| 105 | Neosho | 13,224 | 529 | 5.0% |
| 105 | Bridgeton | 11,369 | 455 | 5.0% |
| 105 | Creve Coeur | 18,643 | 746 | 5.0% |
Source: U.S. Census ACS 2020-2024. 131 cities with more than 5,000 residents.
Summary
Getting Some Closure In Missouri After Untying The Knot
We now have a sense of what places in the Show Me State don’t pay much attention to the whole “’til death do we part” phrase.
The cities with the highest divorce rate in Missouri are De Soto, Richmond, Bonne Terre, Dexter, Farmington, Jennings, Aurora, Sullivan, St. Joseph, and St. John.
Try to keep in mind that the reason cities rank where they do in Missouri could be because of the age, education, and income distribution, as all of those things impact the rate of divorce.