Burnsville, MN
Demographics And Statistics
Living In Burnsville, Minnesota Summary
Life in Burnsville research summary. HomeSnacks has been using Saturday Night Science to research the quality of life in Burnsville over the past nine years using Census, FBI, Zillow, and other primary data sources. Based on the most recently available data, we found the following about life in Burnsville:
The population in Burnsville is 64,295.
The median home value in Burnsville is $365,961.
The median income in Burnsville is $83,953.
The cost of living in Burnsville is 112 which is 1.1x higher than the national average.
The median rent in Burnsville is $1,501.
The unemployment rate in Burnsville is 4.7%.
The poverty rate in Burnsville is 8.7%.
The average high in Burnsville is 55.3° and the average low is 35.9°.
Burnsville SnackAbility
Overall SnackAbility
Burnsville, MN Crime Report
Crime in Burnsville summary. We use data from the FBI to determine the crime rates in Burnsville. Key points include:
There were 1,444 total crimes in Burnsville in the last reporting year.
The overall crime rate per 100,000 people in Burnsville is 2,268.7 / 100k people.
The violent crime rate per 100,000 people in Burnsville is 263.9 / 100k people.
The property crime rate per 100,000 people in Burnsville is 2,004.7 / 100k people.
Overall, crime in Burnsville is 7.05% above the national average.
Total Crimes
Above National Average
Crime In Burnsville Comparison Table
| Statistic | Count Raw |
Burnsville / 100k People |
Minnesota / 100k People |
National / 100k People |
|---|---|---|---|---|
| Total Crimes Per 100K | 1,444 | 2,268.7 | 1,862.9 | 2,119.2 |
| Violent Crime | 168 | 263.9 | 256.6 | 359.0 |
| Murder | 1 | 1.6 | 2.9 | 5.0 |
| Robbery | 18 | 28.3 | 48.9 | 61.0 |
| Aggravated Assault | 128 | 201.1 | 168.0 | 256.0 |
| Property Crime | 1,276 | 2,004.7 | 1,606.3 | 1,760.0 |
| Burglary | 96 | 150.8 | 184.7 | 229.0 |
| Larceny | 1,065 | 1,673.2 | 1,208.5 | 1,272.0 |
| Car Theft | 115 | 180.7 | 213.1 | 259.0 |
Burnsville, MN Cost Of Living
Cost of living in Burnsville summary. We use data on the cost of living to determine how expensive it is to live in Burnsville. Real estate prices drive most of the variance in cost of living around Minnesota. Key points include:
The cost of living in Burnsville is 112 with 100 being average.
The cost of living in Burnsville is 1.1x higher than the national average.
The median home value in Burnsville is $365,961.
The median income in Burnsville is $83,953.
Burnsville's Overall Cost Of Living
Higher Than The National Average
Cost Of Living In Burnsville Comparison Table
| Living Expense | Burnsville | Minnesota | National Average | |
|---|---|---|---|---|
| Overall | 112 | 97 | 100 | |
| Services | 94 | 101 | 100 | |
| Groceries | 99 | 99 | 100 | |
| Health | 102 | 110 | 100 | |
| Housing | 143 | 100 | 100 | |
| Transportation | 97 | 95 | 100 | |
| Utilities | 96 | 94 | 100 | |
Burnsville, MN Weather
The average high in Burnsville is 55.3° and the average low is 35.9°.
There are 61.2 days of precipitation each year.
Expect an average of 32.0 inches of precipitation each year with 46.1 inches of snow.
| Stat | Burnsville |
|---|---|
| Average Annual High | 55.3 |
| Average Annual Low | 35.9 |
| Annual Precipitation Days | 61.2 |
| Average Annual Precipitation | 32.0 |
| Average Annual Snowfall | 46.1 |
Average High
Days of Rain
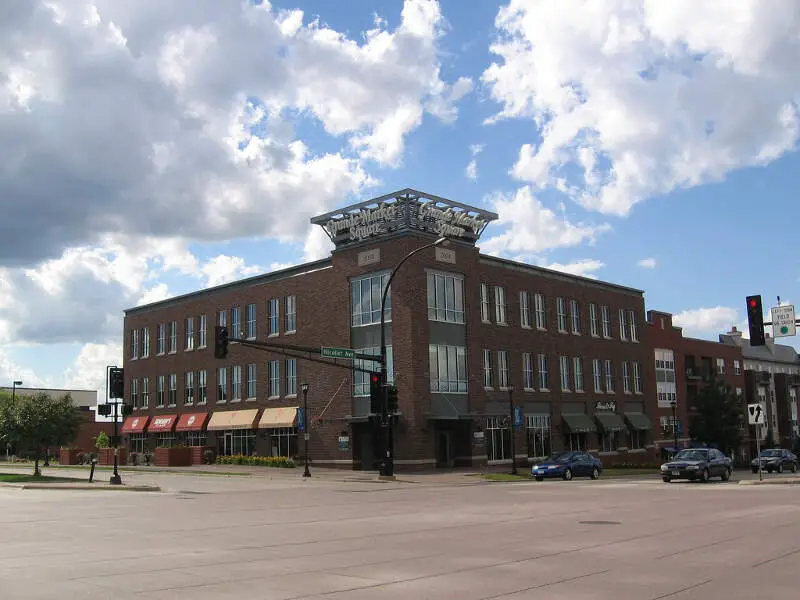
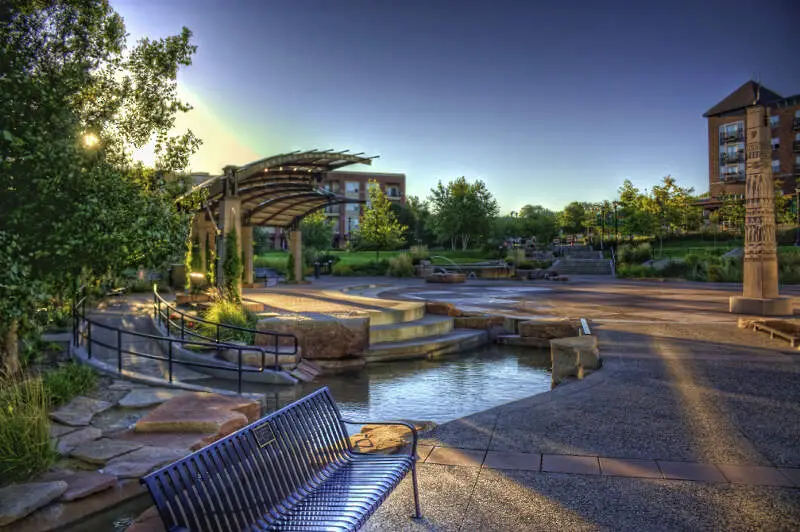
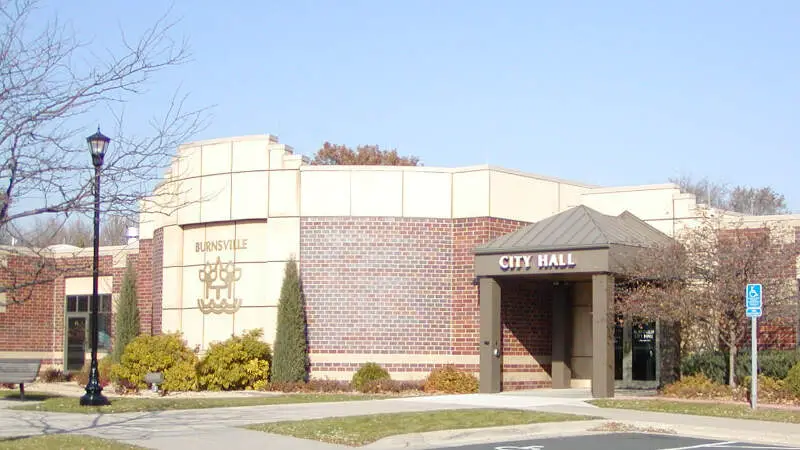
Burnsville, MN Photos
Rankings for Burnsville in Minnesota


Locations Around Burnsville
Map Of Burnsville, MN
Best Places Around Burnsville
Edina, MN
Population 53,125
Plymouth, MN
Population 79,526
Eden Prairie, MN
Population 63,249
Shorewood, MN
Population 7,679
Woodbury, MN
Population 76,945
Minnetonka, MN
Population 53,256
Lakeville, MN
Population 72,480
Mendota Heights, MN
Population 11,644
Apple Valley, MN
Population 55,696
Golden Valley, MN
Population 21,927
Burnsville Demographics And Statistics
Population over time in Burnsville
The current population in Burnsville is 64,295. The population has increased 5.9% from 2010.
| Year | Population | % Change |
|---|---|---|
| 2023 | 64,295 | 0.3% |
| 2022 | 64,075 | 0.2% |
| 2021 | 63,926 | 3.9% |
| 2020 | 61,536 | 0.4% |
| 2019 | 61,311 | 0.0% |
| 2018 | 61,283 | -0.0% |
| 2017 | 61,302 | 0.2% |
| 2016 | 61,158 | -0.2% |
| 2015 | 61,255 | 0.3% |
| 2014 | 61,059 | 0.4% |
| 2013 | 60,838 | 0.3% |
| 2012 | 60,676 | -0.0% |
| 2011 | 60,699 | 0.0% |
| 2010 | 60,693 | - |
Race / Ethnicity in Burnsville
Burnsville is:
63.2% White with 40,626 White residents.
12.8% African American with 8,205 African American residents.
0.1% American Indian with 92 American Indian residents.
5.2% Asian with 3,375 Asian residents.
0.0% Hawaiian with 0 Hawaiian residents.
0.9% Other with 572 Other residents.
5.9% Two Or More with 3,803 Two Or More residents.
11.9% Hispanic with 7,622 Hispanic residents.
| Race | Burnsville | MN | USA |
|---|---|---|---|
| White | 63.2% | 76.7% | 58.2% |
| African American | 12.8% | 6.7% | 12.0% |
| American Indian | 0.1% | 0.7% | 0.5% |
| Asian | 5.2% | 5.0% | 5.7% |
| Hawaiian | 0.0% | 0.0% | 0.2% |
| Other | 0.9% | 0.4% | 0.5% |
| Two Or More | 5.9% | 4.1% | 3.9% |
| Hispanic | 11.9% | 6.2% | 19.0% |
Gender in Burnsville
Burnsville is 51.4% female with 33,061 female residents.
Burnsville is 48.6% male with 31,234 male residents.
| Gender | Burnsville | MN | USA |
|---|---|---|---|
| Female | 51.4% | 49.9% | 50.5% |
| Male | 48.6% | 50.1% | 49.5% |
Highest level of educational attainment in Burnsville for adults over 25
3.0% of adults in Burnsville completed < 9th grade.
3.0% of adults in Burnsville completed 9-12th grade.
21.0% of adults in Burnsville completed high school / ged.
21.0% of adults in Burnsville completed some college.
12.0% of adults in Burnsville completed associate's degree.
28.0% of adults in Burnsville completed bachelor's degree.
10.0% of adults in Burnsville completed master's degree.
1.0% of adults in Burnsville completed professional degree.
1.0% of adults in Burnsville completed doctorate degree.
| Education | Burnsville | MN | USA |
|---|---|---|---|
| < 9th Grade | 3.0% | 2.0% | 5.0% |
| 9-12th Grade | 3.0% | 3.0% | 6.0% |
| High School / GED | 21.0% | 24.0% | 26.0% |
| Some College | 21.0% | 20.0% | 19.0% |
| Associate's Degree | 12.0% | 12.0% | 9.0% |
| Bachelor's Degree | 28.0% | 25.0% | 21.0% |
| Master's Degree | 10.0% | 10.0% | 10.0% |
| Professional Degree | 1.0% | 2.0% | 2.0% |
| Doctorate Degree | 1.0% | 2.0% | 2.0% |
Household Income For Burnsville, Minnesota
3.4% of households in Burnsville earn Less than $10,000.
1.7% of households in Burnsville earn $10,000 to $14,999.
4.7% of households in Burnsville earn $15,000 to $24,999.
5.7% of households in Burnsville earn $25,000 to $34,999.
11.6% of households in Burnsville earn $35,000 to $49,999.
17.8% of households in Burnsville earn $50,000 to $74,999.
13.0% of households in Burnsville earn $75,000 to $99,999.
21.5% of households in Burnsville earn $100,000 to $149,999.
10.1% of households in Burnsville earn $150,000 to $199,999.
10.3% of households in Burnsville earn $200,000 or more.
| Income | Burnsville | MN | USA |
|---|---|---|---|
| Less than $10,000 | 3.4% | 3.5% | 4.9% |
| $10,000 to $14,999 | 1.7% | 2.8% | 3.6% |
| $15,000 to $24,999 | 4.7% | 5.4% | 6.6% |
| $25,000 to $34,999 | 5.7% | 5.8% | 6.8% |
| $35,000 to $49,999 | 11.6% | 9.6% | 10.4% |
| $50,000 to $74,999 | 17.8% | 15.7% | 15.7% |
| $75,000 to $99,999 | 13.0% | 13.5% | 12.7% |
| $100,000 to $149,999 | 21.5% | 19.7% | 17.4% |
| $150,000 to $199,999 | 10.1% | 10.9% | 9.3% |
| $200,000 or more | 10.3% | 13.1% | 12.6% |


