Minnetonka, MN
Demographics And Statistics
Living In Minnetonka, Minnesota Summary
Life in Minnetonka research summary. HomeSnacks has been using Saturday Night Science to research the quality of life in Minnetonka over the past nine years using Census, FBI, Zillow, and other primary data sources. Based on the most recently available data, we found the following about life in Minnetonka:
The population in Minnetonka is 53,256.
The median home value in Minnetonka is $474,565.
The median income in Minnetonka is $120,496.
The cost of living in Minnetonka is 120 which is 1.2x higher than the national average.
The median rent in Minnetonka is $1,758.
The unemployment rate in Minnetonka is 2.2%.
The poverty rate in Minnetonka is 4.8%.
The average high in Minnetonka is 54.7° and the average low is 36.2°.
Minnetonka SnackAbility
Overall SnackAbility
Minnetonka, MN Crime Report
Crime in Minnetonka summary. We use data from the FBI to determine the crime rates in Minnetonka. Key points include:
There were 925 total crimes in Minnetonka in the last reporting year.
The overall crime rate per 100,000 people in Minnetonka is 1,786.0 / 100k people.
The violent crime rate per 100,000 people in Minnetonka is 79.2 / 100k people.
The property crime rate per 100,000 people in Minnetonka is 1,706.9 / 100k people.
Overall, crime in Minnetonka is -15.72% below the national average.
Total Crimes
Below National Average
Crime In Minnetonka Comparison Table
| Statistic | Count Raw |
Minnetonka / 100k People |
Minnesota / 100k People |
National / 100k People |
|---|---|---|---|---|
| Total Crimes Per 100K | 925 | 1,786.0 | 1,862.9 | 2,119.2 |
| Violent Crime | 41 | 79.2 | 256.6 | 359.0 |
| Murder | 1 | 1.9 | 2.9 | 5.0 |
| Robbery | 7 | 13.5 | 48.9 | 61.0 |
| Aggravated Assault | 27 | 52.1 | 168.0 | 256.0 |
| Property Crime | 884 | 1,706.9 | 1,606.3 | 1,760.0 |
| Burglary | 95 | 183.4 | 184.7 | 229.0 |
| Larceny | 747 | 1,442.3 | 1,208.5 | 1,272.0 |
| Car Theft | 42 | 81.1 | 213.1 | 259.0 |
Minnetonka, MN Cost Of Living
Cost of living in Minnetonka summary. We use data on the cost of living to determine how expensive it is to live in Minnetonka. Real estate prices drive most of the variance in cost of living around Minnesota. Key points include:
The cost of living in Minnetonka is 120 with 100 being average.
The cost of living in Minnetonka is 1.2x higher than the national average.
The median home value in Minnetonka is $474,565.
The median income in Minnetonka is $120,496.
Minnetonka's Overall Cost Of Living
Higher Than The National Average
Cost Of Living In Minnetonka Comparison Table
| Living Expense | Minnetonka | Minnesota | National Average | |
|---|---|---|---|---|
| Overall | 120 | 97 | 100 | |
| Services | 95 | 101 | 100 | |
| Groceries | 95 | 99 | 100 | |
| Health | 101 | 110 | 100 | |
| Housing | 185 | 100 | 100 | |
| Transportation | 95 | 95 | 100 | |
| Utilities | 95 | 94 | 100 | |
Minnetonka, MN Weather
The average high in Minnetonka is 54.7° and the average low is 36.2°.
There are 59.5 days of precipitation each year.
Expect an average of 31.7 inches of precipitation each year with 51.8 inches of snow.
| Stat | Minnetonka |
|---|---|
| Average Annual High | 54.7 |
| Average Annual Low | 36.2 |
| Annual Precipitation Days | 59.5 |
| Average Annual Precipitation | 31.7 |
| Average Annual Snowfall | 51.8 |
Average High
Days of Rain
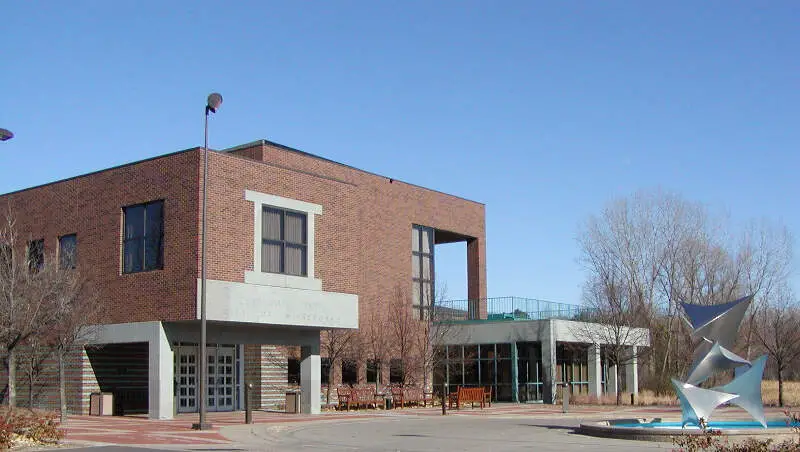
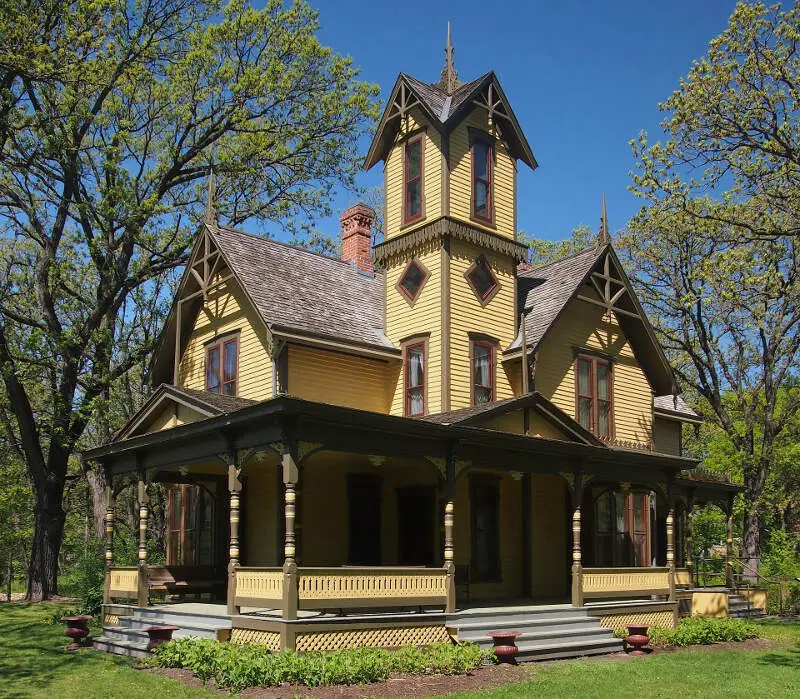
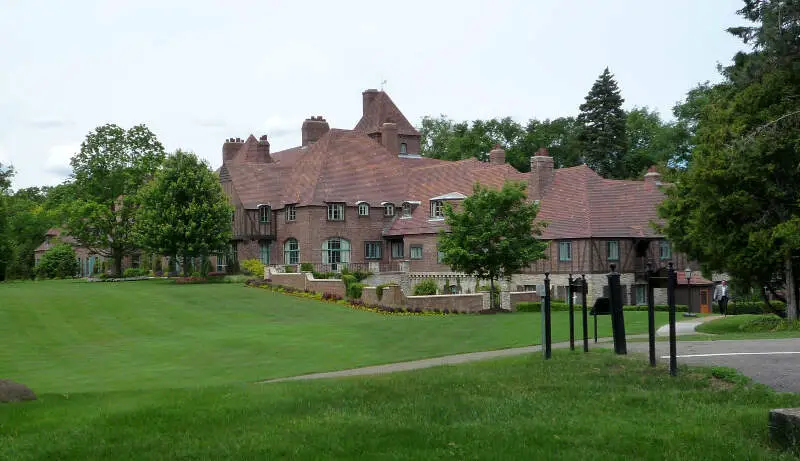
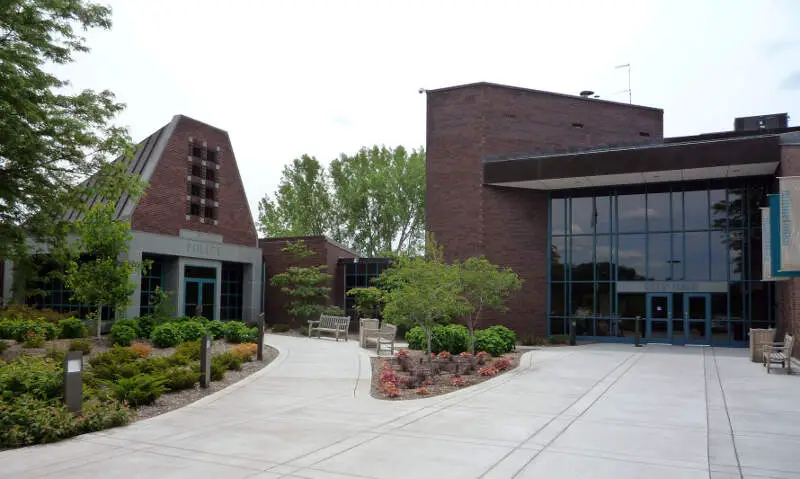
Minnetonka, MN Photos
Rankings for Minnetonka in Minnesota


Locations Around Minnetonka
Map Of Minnetonka, MN
Best Places Around Minnetonka
Maple Grove, MN
Population 70,539
Edina, MN
Population 53,125
Shoreview, MN
Population 26,724
Plymouth, MN
Population 79,526
Eden Prairie, MN
Population 63,249
Shorewood, MN
Population 7,679
Rogers, MN
Population 13,405
Minnetrista, MN
Population 8,509
Champlin, MN
Population 23,450
Mendota Heights, MN
Population 11,644
Minnetonka Demographics And Statistics
Population over time in Minnetonka
The current population in Minnetonka is 53,256. The population has increased 7.4% from 2010.
| Year | Population | % Change |
|---|---|---|
| 2023 | 53,256 | -0.5% |
| 2022 | 53,529 | -0.5% |
| 2021 | 53,809 | 0.1% |
| 2020 | 53,760 | 1.4% |
| 2019 | 53,025 | 0.9% |
| 2018 | 52,546 | 0.9% |
| 2017 | 52,102 | 0.9% |
| 2016 | 51,651 | 0.8% |
| 2015 | 51,249 | 0.7% |
| 2014 | 50,897 | 0.7% |
| 2013 | 50,523 | 0.7% |
| 2012 | 50,151 | 0.8% |
| 2011 | 49,766 | 0.4% |
| 2010 | 49,567 | - |
Race / Ethnicity in Minnetonka
Minnetonka is:
80.8% White with 43,017 White residents.
3.8% African American with 2,042 African American residents.
0.1% American Indian with 49 American Indian residents.
6.7% Asian with 3,575 Asian residents.
0.0% Hawaiian with 0 Hawaiian residents.
0.4% Other with 200 Other residents.
4.1% Two Or More with 2,182 Two Or More residents.
4.1% Hispanic with 2,191 Hispanic residents.
| Race | Minnetonka | MN | USA |
|---|---|---|---|
| White | 80.8% | 76.7% | 58.2% |
| African American | 3.8% | 6.7% | 12.0% |
| American Indian | 0.1% | 0.7% | 0.5% |
| Asian | 6.7% | 5.0% | 5.7% |
| Hawaiian | 0.0% | 0.0% | 0.2% |
| Other | 0.4% | 0.4% | 0.5% |
| Two Or More | 4.1% | 4.1% | 3.9% |
| Hispanic | 4.1% | 6.2% | 19.0% |
Gender in Minnetonka
Minnetonka is 50.7% female with 26,989 female residents.
Minnetonka is 49.3% male with 26,267 male residents.
| Gender | Minnetonka | MN | USA |
|---|---|---|---|
| Female | 50.7% | 49.9% | 50.5% |
| Male | 49.3% | 50.1% | 49.5% |
Highest level of educational attainment in Minnetonka for adults over 25
3.0% of adults in Minnetonka completed < 9th grade.
1.0% of adults in Minnetonka completed 9-12th grade.
11.0% of adults in Minnetonka completed high school / ged.
15.0% of adults in Minnetonka completed some college.
7.0% of adults in Minnetonka completed associate's degree.
38.0% of adults in Minnetonka completed bachelor's degree.
18.0% of adults in Minnetonka completed master's degree.
5.0% of adults in Minnetonka completed professional degree.
2.0% of adults in Minnetonka completed doctorate degree.
| Education | Minnetonka | MN | USA |
|---|---|---|---|
| < 9th Grade | 3.0% | 2.0% | 5.0% |
| 9-12th Grade | 1.0% | 3.0% | 6.0% |
| High School / GED | 11.0% | 24.0% | 26.0% |
| Some College | 15.0% | 20.0% | 19.0% |
| Associate's Degree | 7.0% | 12.0% | 9.0% |
| Bachelor's Degree | 38.0% | 25.0% | 21.0% |
| Master's Degree | 18.0% | 10.0% | 10.0% |
| Professional Degree | 5.0% | 2.0% | 2.0% |
| Doctorate Degree | 2.0% | 2.0% | 2.0% |
Household Income For Minnetonka, Minnesota
2.2% of households in Minnetonka earn Less than $10,000.
2.1% of households in Minnetonka earn $10,000 to $14,999.
2.8% of households in Minnetonka earn $15,000 to $24,999.
2.8% of households in Minnetonka earn $25,000 to $34,999.
7.4% of households in Minnetonka earn $35,000 to $49,999.
11.7% of households in Minnetonka earn $50,000 to $74,999.
11.4% of households in Minnetonka earn $75,000 to $99,999.
19.9% of households in Minnetonka earn $100,000 to $149,999.
14.1% of households in Minnetonka earn $150,000 to $199,999.
25.6% of households in Minnetonka earn $200,000 or more.
| Income | Minnetonka | MN | USA |
|---|---|---|---|
| Less than $10,000 | 2.2% | 3.5% | 4.9% |
| $10,000 to $14,999 | 2.1% | 2.8% | 3.6% |
| $15,000 to $24,999 | 2.8% | 5.4% | 6.6% |
| $25,000 to $34,999 | 2.8% | 5.8% | 6.8% |
| $35,000 to $49,999 | 7.4% | 9.6% | 10.4% |
| $50,000 to $74,999 | 11.7% | 15.7% | 15.7% |
| $75,000 to $99,999 | 11.4% | 13.5% | 12.7% |
| $100,000 to $149,999 | 19.9% | 19.7% | 17.4% |
| $150,000 to $199,999 | 14.1% | 10.9% | 9.3% |
| $200,000 or more | 25.6% | 13.1% | 12.6% |


