Owatonna, MN
Demographics And Statistics
Living In Owatonna, Minnesota Summary
Life in Owatonna research summary. HomeSnacks has been using Saturday Night Science to research the quality of life in Owatonna over the past nine years using Census, FBI, Zillow, and other primary data sources. Based on the most recently available data, we found the following about life in Owatonna:
The population in Owatonna is 26,462.
The median home value in Owatonna is $297,634.
The median income in Owatonna is $81,276.
The cost of living in Owatonna is 96 which is 1.0x lower than the national average.
The median rent in Owatonna is $1,010.
The unemployment rate in Owatonna is 3.2%.
The poverty rate in Owatonna is 8.2%.
The average high in Owatonna is 55.0° and the average low is 35.3°.
Owatonna SnackAbility
Overall SnackAbility
Owatonna, MN Crime Report
Crime in Owatonna summary. We use data from the FBI to determine the crime rates in Owatonna. Key points include:
There were 291 total crimes in Owatonna in the last reporting year.
The overall crime rate per 100,000 people in Owatonna is 1,098.1 / 100k people.
The violent crime rate per 100,000 people in Owatonna is 188.7 / 100k people.
The property crime rate per 100,000 people in Owatonna is 909.4 / 100k people.
Overall, crime in Owatonna is -48.19% below the national average.
Total Crimes
Below National Average
Crime In Owatonna Comparison Table
| Statistic | Count Raw |
Owatonna / 100k People |
Minnesota / 100k People |
National / 100k People |
|---|---|---|---|---|
| Total Crimes Per 100K | 291 | 1,098.1 | 1,862.9 | 2,119.2 |
| Violent Crime | 50 | 188.7 | 256.6 | 359.0 |
| Murder | 1 | 3.8 | 2.9 | 5.0 |
| Robbery | 2 | 7.5 | 48.9 | 61.0 |
| Aggravated Assault | 30 | 113.2 | 168.0 | 256.0 |
| Property Crime | 241 | 909.4 | 1,606.3 | 1,760.0 |
| Burglary | 28 | 105.7 | 184.7 | 229.0 |
| Larceny | 199 | 750.9 | 1,208.5 | 1,272.0 |
| Car Theft | 14 | 52.8 | 213.1 | 259.0 |
Owatonna, MN Cost Of Living
Cost of living in Owatonna summary. We use data on the cost of living to determine how expensive it is to live in Owatonna. Real estate prices drive most of the variance in cost of living around Minnesota. Key points include:
The cost of living in Owatonna is 96 with 100 being average.
The cost of living in Owatonna is 1.0x lower than the national average.
The median home value in Owatonna is $297,634.
The median income in Owatonna is $81,276.
Owatonna's Overall Cost Of Living
Lower Than The National Average
Cost Of Living In Owatonna Comparison Table
| Living Expense | Owatonna | Minnesota | National Average | |
|---|---|---|---|---|
| Overall | 96 | 97 | 100 | |
| Services | 97 | 101 | 100 | |
| Groceries | 100 | 99 | 100 | |
| Health | 113 | 110 | 100 | |
| Housing | 92 | 100 | 100 | |
| Transportation | 96 | 95 | 100 | |
| Utilities | 93 | 94 | 100 | |
Owatonna, MN Weather
The average high in Owatonna is 55.0° and the average low is 35.3°.
There are 63.3 days of precipitation each year.
Expect an average of 32.6 inches of precipitation each year with 42.8 inches of snow.
| Stat | Owatonna |
|---|---|
| Average Annual High | 55.0 |
| Average Annual Low | 35.3 |
| Annual Precipitation Days | 63.3 |
| Average Annual Precipitation | 32.6 |
| Average Annual Snowfall | 42.8 |
Average High
Days of Rain
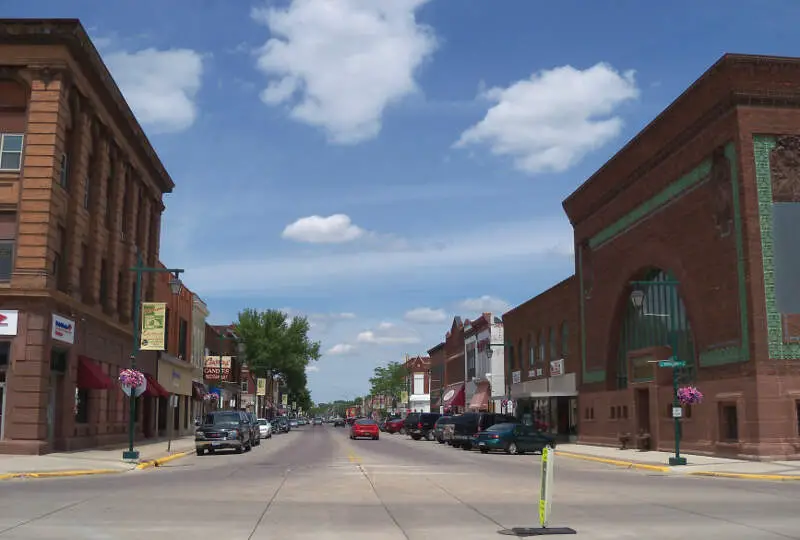
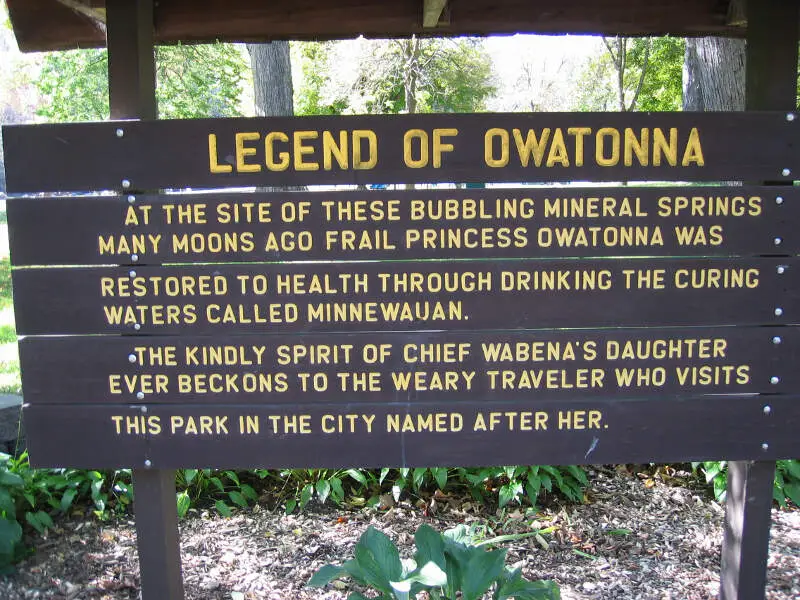
Owatonna, MN Photos
Rankings for Owatonna in Minnesota


Locations Around Owatonna
Map Of Owatonna, MN
Best Places Around Owatonna
Lakeville, MN
Population 72,480
Apple Valley, MN
Population 55,696
North Mankato, MN
Population 14,212
Savage, MN
Population 32,706
Farmington, MN
Population 23,675
Prior Lake, MN
Population 27,832
Rosemount, MN
Population 26,509
St. Peter, MN
Population 12,085
Rochester, MN
Population 121,638
Jordan, MN
Population 6,704
Owatonna Demographics And Statistics
Population over time in Owatonna
The current population in Owatonna is 26,462. The population has increased 4.5% from 2010.
| Year | Population | % Change |
|---|---|---|
| 2023 | 26,462 | 0.2% |
| 2022 | 26,400 | 0.1% |
| 2021 | 26,366 | 2.5% |
| 2020 | 25,716 | 0.1% |
| 2019 | 25,685 | 0.1% |
| 2018 | 25,656 | 0.2% |
| 2017 | 25,613 | 0.1% |
| 2016 | 25,580 | 0.1% |
| 2015 | 25,552 | 0.0% |
| 2014 | 25,550 | 0.0% |
| 2013 | 25,539 | 0.2% |
| 2012 | 25,489 | 0.1% |
| 2011 | 25,456 | 0.5% |
| 2010 | 25,319 | - |
Race / Ethnicity in Owatonna
Owatonna is:
83.2% White with 22,026 White residents.
4.6% African American with 1,219 African American residents.
0.1% American Indian with 31 American Indian residents.
0.6% Asian with 163 Asian residents.
0.0% Hawaiian with 0 Hawaiian residents.
0.2% Other with 44 Other residents.
3.0% Two Or More with 793 Two Or More residents.
8.3% Hispanic with 2,186 Hispanic residents.
| Race | Owatonna | MN | USA |
|---|---|---|---|
| White | 83.2% | 76.7% | 58.2% |
| African American | 4.6% | 6.7% | 12.0% |
| American Indian | 0.1% | 0.7% | 0.5% |
| Asian | 0.6% | 5.0% | 5.7% |
| Hawaiian | 0.0% | 0.0% | 0.2% |
| Other | 0.2% | 0.4% | 0.5% |
| Two Or More | 3.0% | 4.1% | 3.9% |
| Hispanic | 8.3% | 6.2% | 19.0% |
Gender in Owatonna
Owatonna is 49.9% female with 13,204 female residents.
Owatonna is 50.1% male with 13,258 male residents.
| Gender | Owatonna | MN | USA |
|---|---|---|---|
| Female | 49.9% | 49.9% | 50.5% |
| Male | 50.1% | 50.1% | 49.5% |
Highest level of educational attainment in Owatonna for adults over 25
2.0% of adults in Owatonna completed < 9th grade.
4.0% of adults in Owatonna completed 9-12th grade.
29.0% of adults in Owatonna completed high school / ged.
22.0% of adults in Owatonna completed some college.
11.0% of adults in Owatonna completed associate's degree.
21.0% of adults in Owatonna completed bachelor's degree.
8.0% of adults in Owatonna completed master's degree.
2.0% of adults in Owatonna completed professional degree.
1.0% of adults in Owatonna completed doctorate degree.
| Education | Owatonna | MN | USA |
|---|---|---|---|
| < 9th Grade | 2.0% | 2.0% | 5.0% |
| 9-12th Grade | 4.0% | 3.0% | 6.0% |
| High School / GED | 29.0% | 24.0% | 26.0% |
| Some College | 22.0% | 20.0% | 19.0% |
| Associate's Degree | 11.0% | 12.0% | 9.0% |
| Bachelor's Degree | 21.0% | 25.0% | 21.0% |
| Master's Degree | 8.0% | 10.0% | 10.0% |
| Professional Degree | 2.0% | 2.0% | 2.0% |
| Doctorate Degree | 1.0% | 2.0% | 2.0% |
Household Income For Owatonna, Minnesota
3.1% of households in Owatonna earn Less than $10,000.
3.2% of households in Owatonna earn $10,000 to $14,999.
5.5% of households in Owatonna earn $15,000 to $24,999.
8.8% of households in Owatonna earn $25,000 to $34,999.
10.8% of households in Owatonna earn $35,000 to $49,999.
15.3% of households in Owatonna earn $50,000 to $74,999.
13.4% of households in Owatonna earn $75,000 to $99,999.
22.0% of households in Owatonna earn $100,000 to $149,999.
9.9% of households in Owatonna earn $150,000 to $199,999.
8.0% of households in Owatonna earn $200,000 or more.
| Income | Owatonna | MN | USA |
|---|---|---|---|
| Less than $10,000 | 3.1% | 3.5% | 4.9% |
| $10,000 to $14,999 | 3.2% | 2.8% | 3.6% |
| $15,000 to $24,999 | 5.5% | 5.4% | 6.6% |
| $25,000 to $34,999 | 8.8% | 5.8% | 6.8% |
| $35,000 to $49,999 | 10.8% | 9.6% | 10.4% |
| $50,000 to $74,999 | 15.3% | 15.7% | 15.7% |
| $75,000 to $99,999 | 13.4% | 13.5% | 12.7% |
| $100,000 to $149,999 | 22.0% | 19.7% | 17.4% |
| $150,000 to $199,999 | 9.9% | 10.9% | 9.3% |
| $200,000 or more | 8.0% | 13.1% | 12.6% |


